Categories
Forex Assets

The Definitive Guide to Forex CFD Trading

Although it is a basic term within trading and forex, in this article I will explain what CFDs are and what they are not. I begin almost necessarily by telling you that CFD, as you know, corresponds to the acronym “Contract For Difference”, which translates into Spanish as “Contract For Differences”. It is a financial product in which the differences between the purchase price and the selling price of a financial asset are settled. When we talk about Forex specifically, about a pair of quoted currencies.

Yes, a CFD is a derivative instrument, or what is the same, it is issued on the price movements of an instrument listed in a market (referred to as the underlying asset), but without being able to physically purchase that asset. Only the benefit or loss of the transaction is charged or paid, but ownership of the asset is never acquired. CFDs have no maturity, the open position in the market can last as long as the trader deems necessary.

Index
  1. How CFDs are valued
  2. How to operate CFDs

2.1. Why an expert trader chooses to trade CFDs

  1. Why trade CFDs instead of shares
  2. Trading platforms to trade CFDs
  3. Characteristics of CFDs
  4. Trading strategies with CFDs

6.1. Risks of trading CFDs

6.2. Learn how to calculate the profits and losses of your CFDs

  1. Who can trade CFDs?
  2. Advantages and disadvantages of using CFDs
How CFDs are Valued

In case you are wondering how CFDs are valued, they are contracts with a broker who issues them, unlike for example the shares that are acquisitions of assets in the market. Typically, the broker offers two prices around the asset’s quotation, one for the purchase (which the trader is supposed to sell) and one for the sale (when the trader wants to buy); these prices are what you can see as “bid” and “ask” respectively.

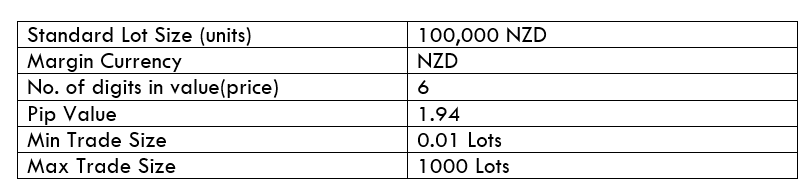
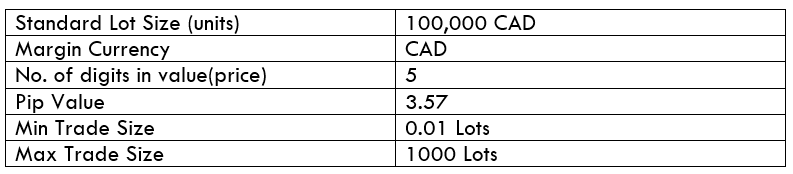
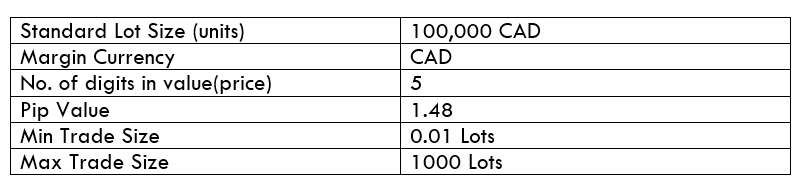
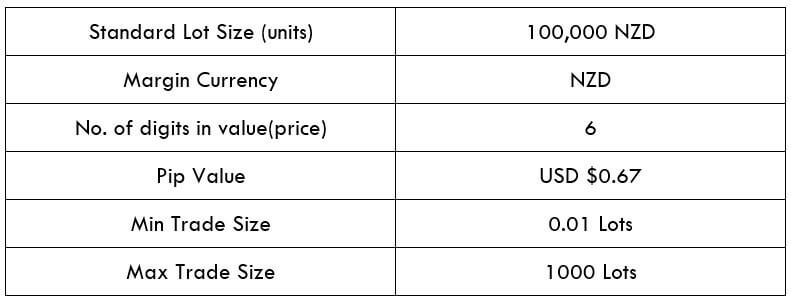
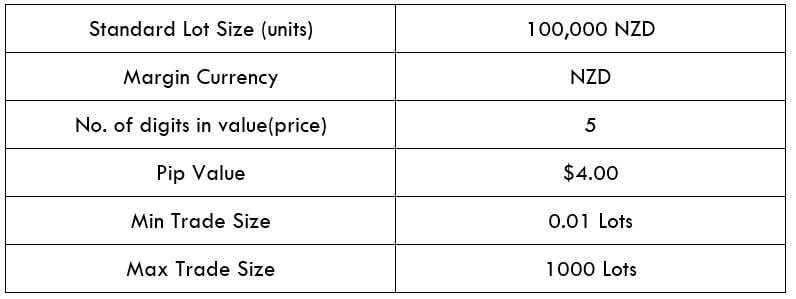
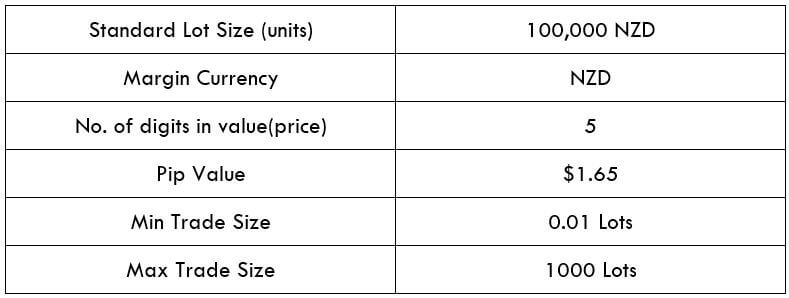
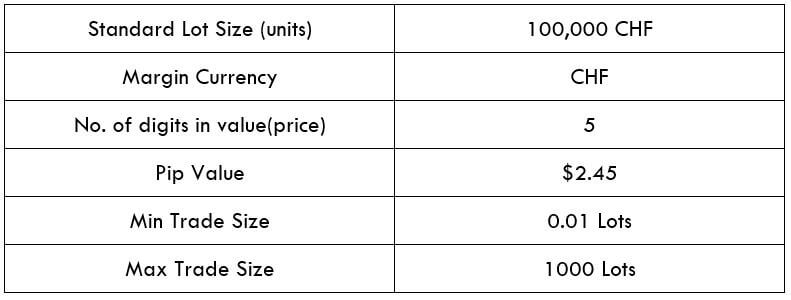
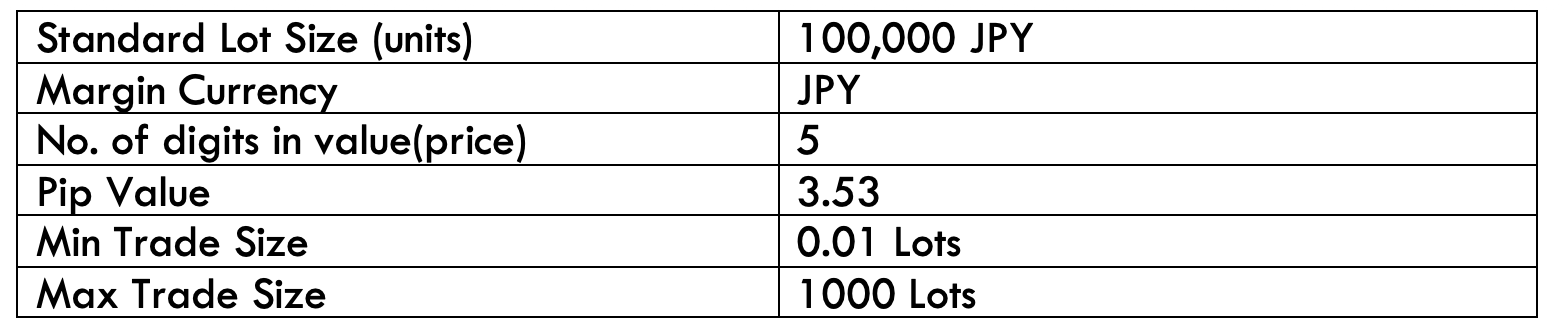
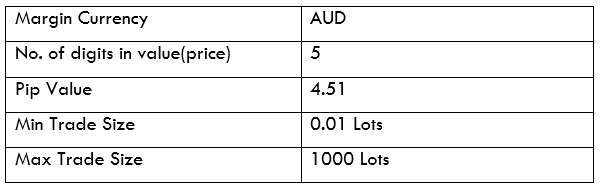
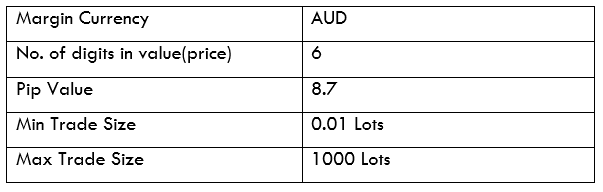
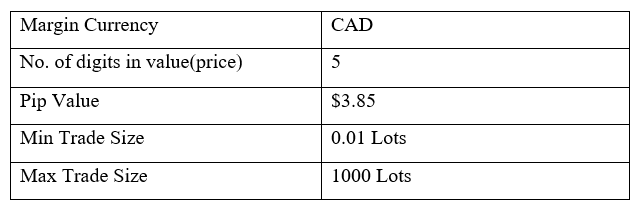
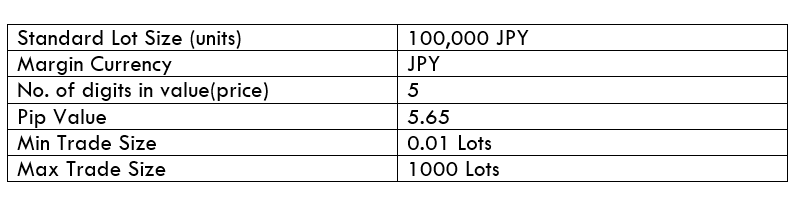
In forex, standard contracts are called lots and are equivalent to 100000 units of the base currency. Although there are also mini-lots (10000 units) and even micro-lots (1000 units).

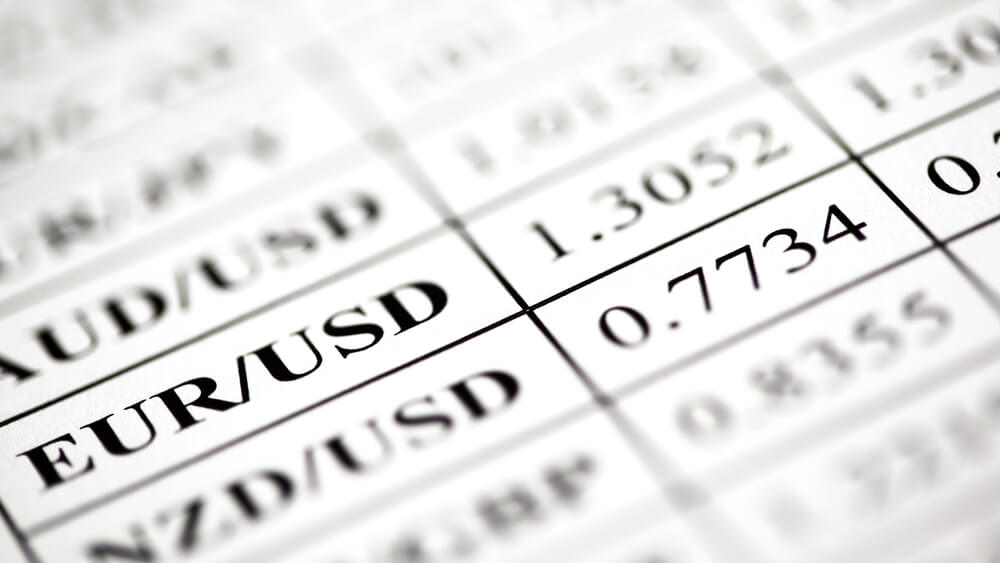
For example: if we buy 2 CFDs (2 lots) of the currency pair EUR/USD, it means that we are carrying out an operation of 200000 euros. If the pair is quoted at 1,1200, according to the ask price of our broker (one euro equals 1,1200 dollars), the value of our position would be 224,000 dollars.

How to Operate CFDs

To operate CFDs you only need to establish a contract with a broker that issues these financial products, opening an account with it, and providing an amount of initial capital. Generally, the whole process is done online. When opening an account, the broker usually provides all the tools necessary to trade CFDs, including the trading platform where market analysis is performed, purchase orders are issued and the capital contributed is managed.

Trading with CFDs is as easy as buying, launching a purchase order on the aforementioned trading platform when a price increase is expected. As well as selling when you expect a decline. CFDs are bought and sold as if they were the asset on which they are issued, with the advantage that it is not necessary to own them in order to sell them. It is possible to sell first and repurchase later to close our position (this operation is called “short investing”, “short position opening”, etc.).

To undo the operation, you just have to throw an order opposite to the opening one, even though the platform itself allows you to do it in a simpler way, simply by choosing the option “close position” (or similar).

Why Expert Traders Choose to Trade CFDs

A skilled trader knows how to handle financial markets (which doesn’t mean he always makes a profit), handles risk well, and is able to control his emotions. In this sense, trading through CFDs is an option if your goal is to use leverage. Trading with CFDs has a number of advantages and a number of risks that we will see below. Risks are controllable if you have the knowledge and a necessary methodology (an expert trader has these two characteristics). Once these two skills are achieved, trading CFDs can be an option to consider.

Trading and trading with CFDs requires:

  • Protect capital at all costs, managing the risk of each operation.
  • Think of trading CFDs as a business and not a hobby.
  • Create a strategy and follow it with absolute discipline.
  • Don’t overleverage yourself.
Why Trade CFDs Instead of Shares

When buying shares in a company, a part of the ownership of the company is acquired. In other words, we are shareholders and we are linked to the business of this company. However, we can only sell the shares if we have previously purchased them (unless they are requested on credit). Short transactions are therefore difficult: we can only have a profit if the shares are revalued. With CFDs this changes, it is possible to make money with upward and downward movements.

With the cash shares, we will not have leverage, we must disburse 100% of the purchase price of the same. This means that the volume of operations is limited to our capital in the account. In this case, the investments will require more maturation time, because they need more price travel to obtain an acceptable profit. Intraday trading, even short-term trading, becomes almost impossible unless a high amount of capital is available. Finally, when buying shares a physical purchase is made, you have ownership of them and this fact requires incurring commissions and additional costs.

Trading Platforms to Trade CFDs On

There are many trading platforms to carry out trading through CFDs. Generally, it is the broker himself who provides this tool to the trader when opening an account. There are brokers that have designed their own platform, others, on the contrary, offer it under a customer terminal, but it is not their property and can be used by various intermediaries. Some platforms you can find to trade with very popular CFDs are Metatrader 4 and 5, Visual Chart, Pro Real-Time.

Characteristics of CFDs

The main characteristics of CFDs are the great flexibility they provide, added to the leverage capacity. As I have told you before, are financial products with leverage, the trader does not need to deposit the entire value of the investment. Simply by providing a percentage of it as a guarantee to cover possible losses (margin required) it is possible to open a position with a much larger volume. The potential profit is increased because it is operated with the capital in excess of that actually available.

Liquidity is another of its characteristics, we can buy and sell at the desired time (the Forex market is always operating from Monday to Friday, 24/7) without worrying about the counterpart.

Trading Strategies for CFDs

A trading strategy is about maintaining rules, both for the analysis and for the execution of the trade. The strategy determines the purchase and sale decisions of CFDs, as well as the time, the asset, the volume of the transaction, the potential profit, maximum allowed loss, etc.

To establish a trading strategy with CFDs, the first thing we must decide is the tools we will use for our operations in the market:

Price action.

  • Trends: follow-up and rupture of these.
  • Use of technical indicators to determine market momentum or depletion.
  • Operate according to economic news and other key data.

In addition, the trader must define its style when trading (according to the time duration of the investments in CFDs):

  • Day trading
  • Swing trading
  • Position trading
Risks of Trading CFDs

The risk of trading CFDs comes precisely from the use of leverage. Trading with more than available capital means that each market fluctuation has a greater impact on the trader’s account, whether in favour or against.

An unfavorable operation, if you don’t have proper risk management, can damage your money. When the margin runs out, the broker will require a new contribution or close the position. Be careful because here you must already assume the corresponding loss.

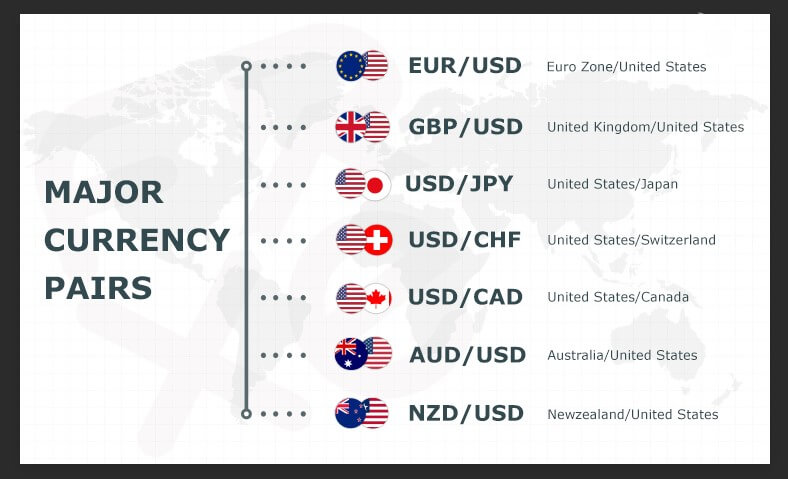
The maximum leverage level for CFDs on the Forex market for major currency pairs and for retail traders under the ESMA regulation for European customers is 1:30 (which means providing a margin of 3.33% on the volume of the actual trade), in accordance with current regulations. So, in this way, the risk of CFDs is limited.

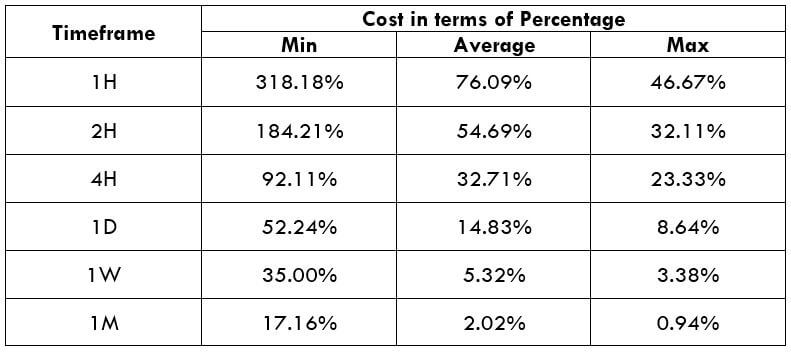
How to Calculate Profits and Losses

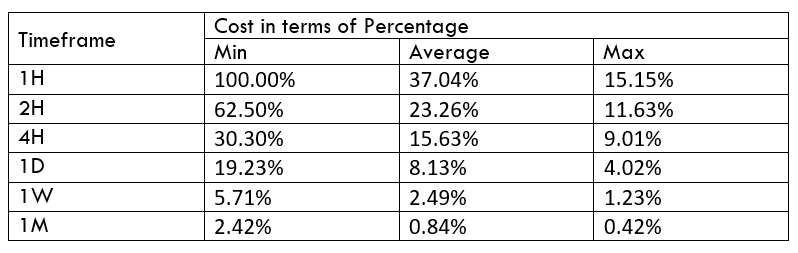
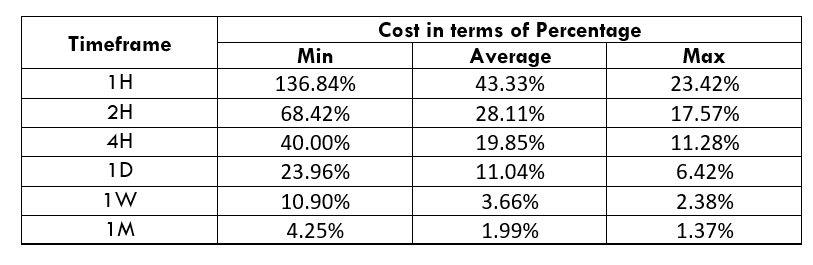
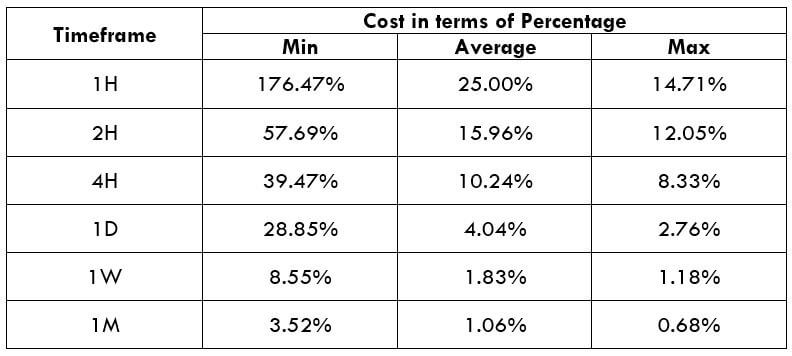
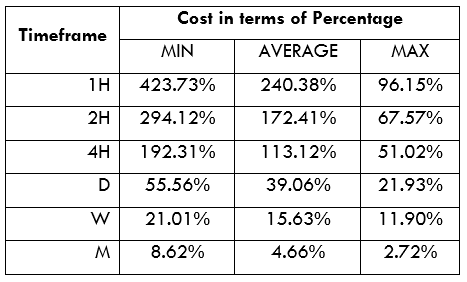
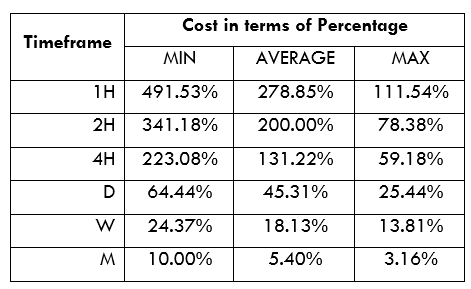
To calculate the profit or loss when trading with CFDs, the first thing that will be necessary is to take into account the costs of the transaction.

The main fees charged by CFDs brokers are:

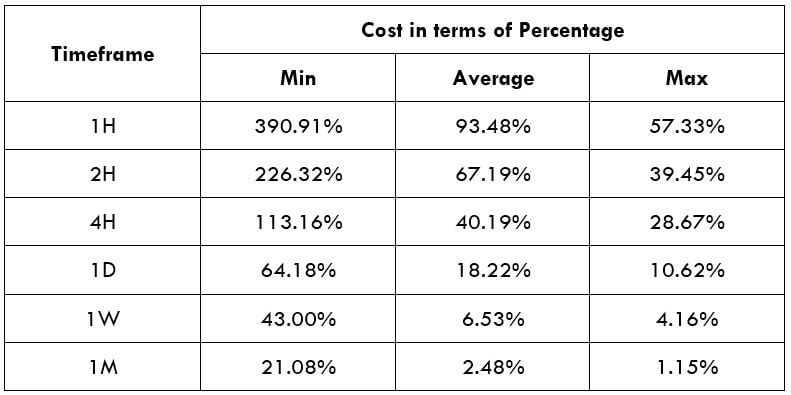
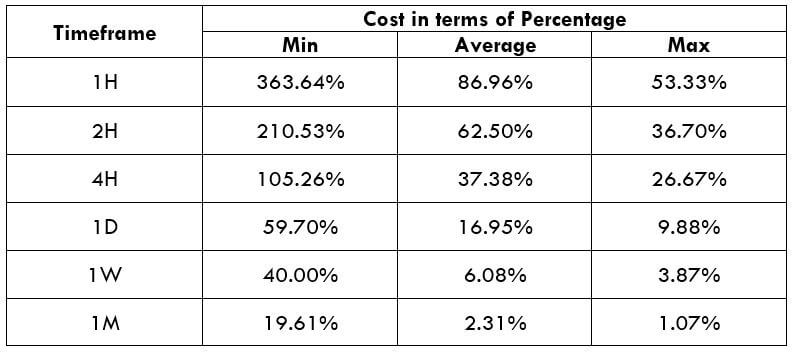
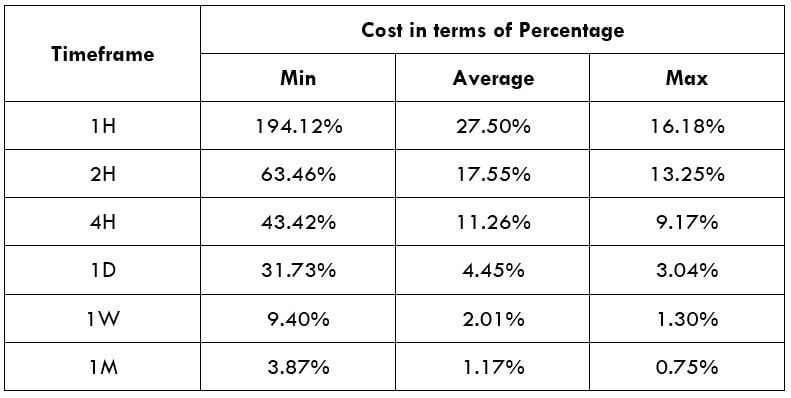
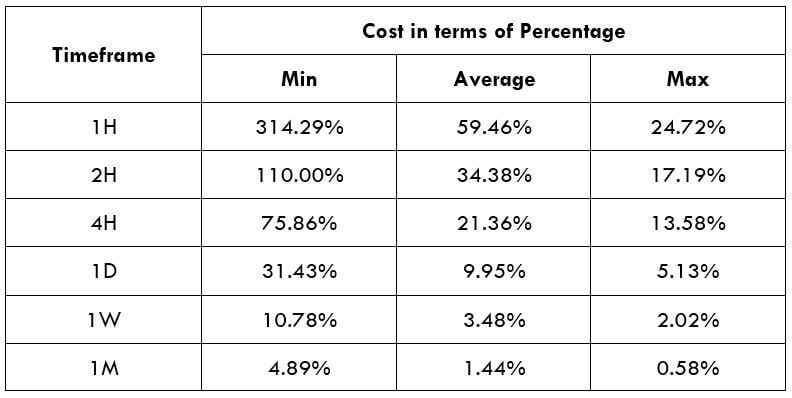
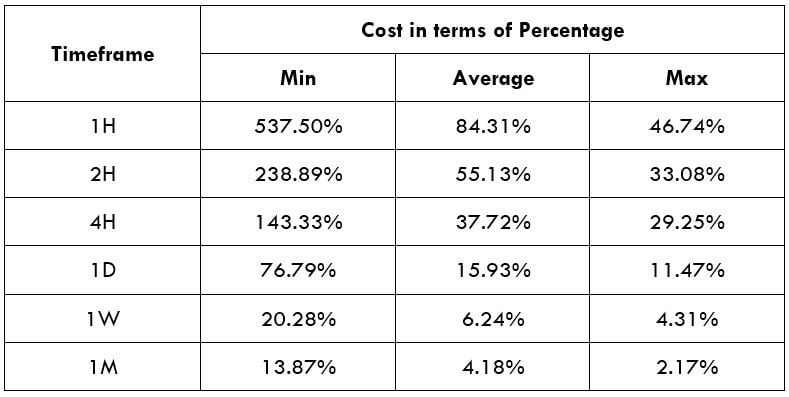
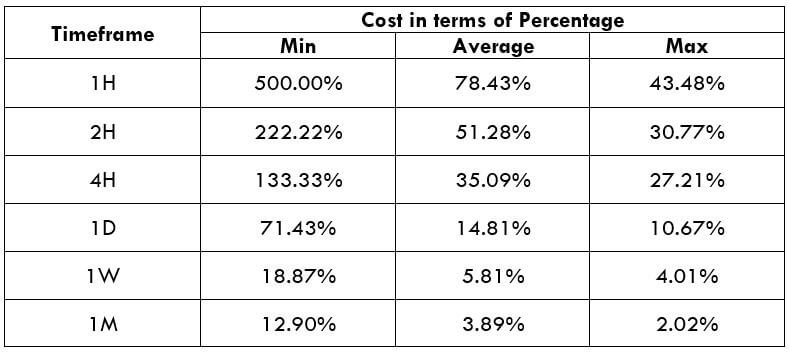
Spread: the difference between sales and offer prices (mentioned above). They are usually a few points and are usually loaded at the time of opening a position. For this reason, trading with CFDs starts with a small loss.

Swap: also called “rollover” or “night premium”. This commission has as a concept the daily interest of the money that the broker lends us for leverage. It is a charge or credit to our account each day, depending on the difference in the interest rate of the two currencies of the pair in which you trade.

Once the costs are known, the factors to take into account to calculate our profit or loss from the position with CFDs are the following:

The contract size or volume of the position (in the base currency).

  • The opening price of the position.
  • The closing price of the position.
  • Gains or losses are determined: (Contract size*Closing price) – (Contract size*Opening price) – Commissions.

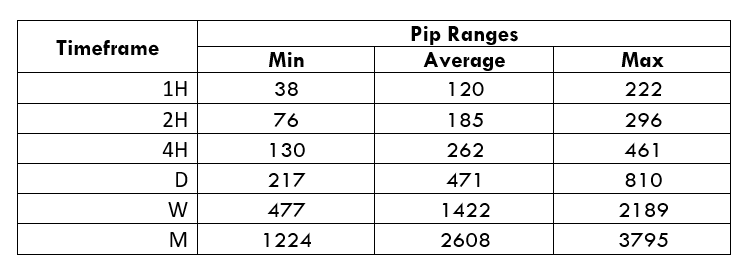
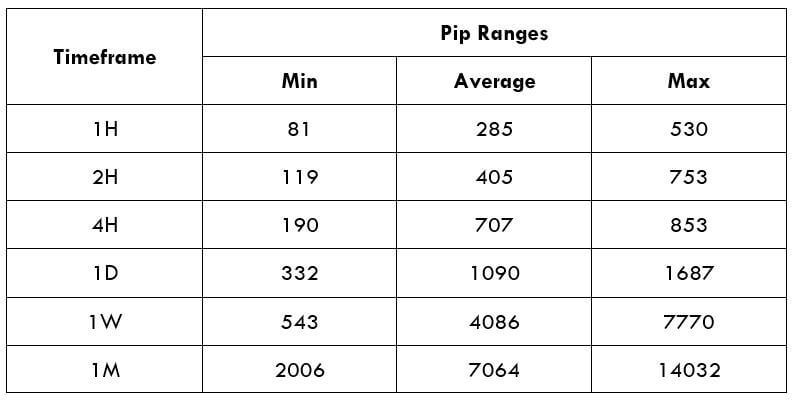
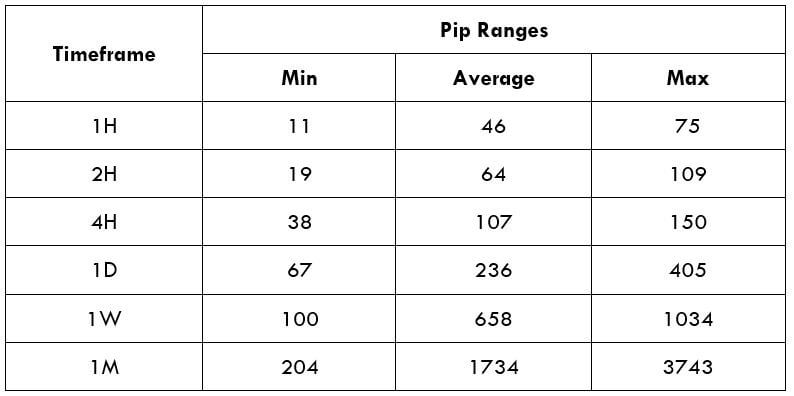
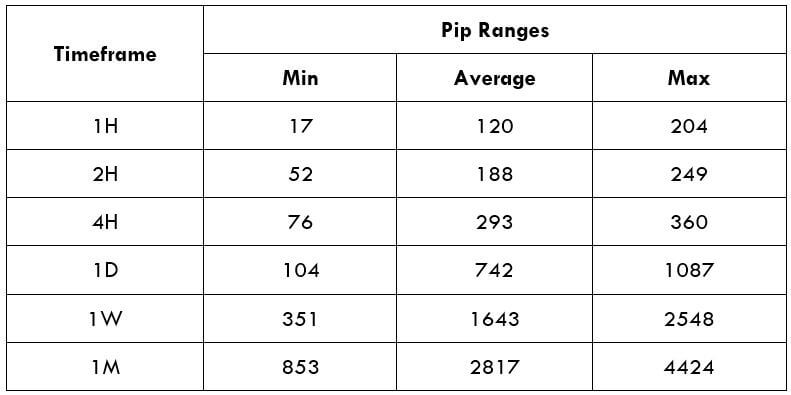
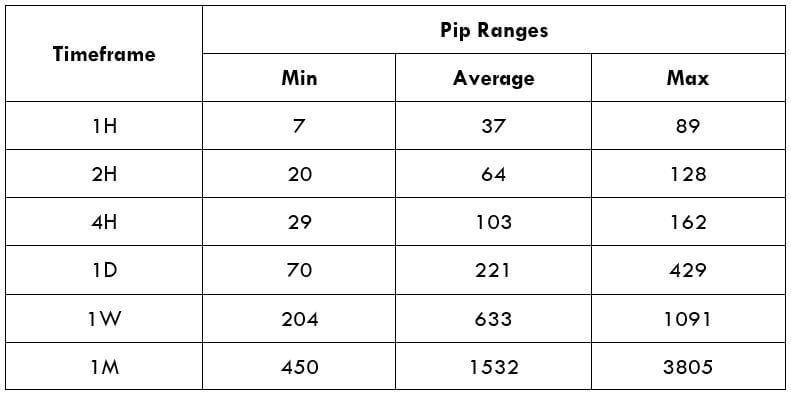
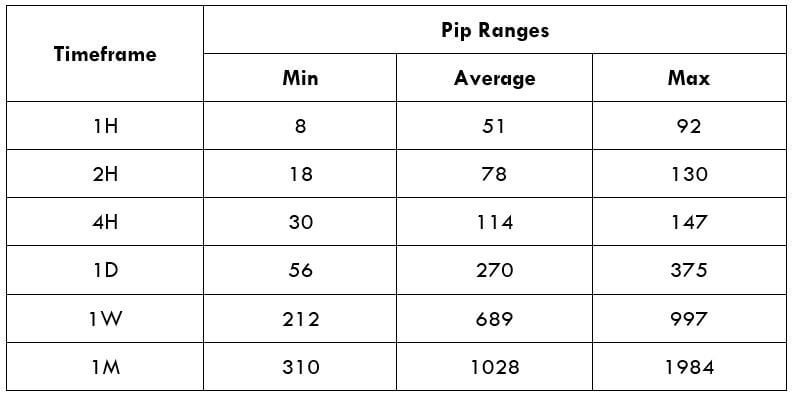
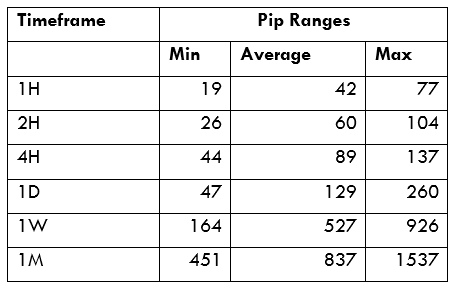
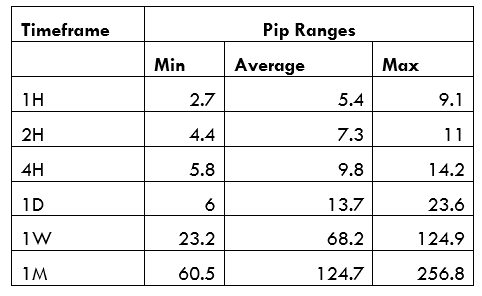
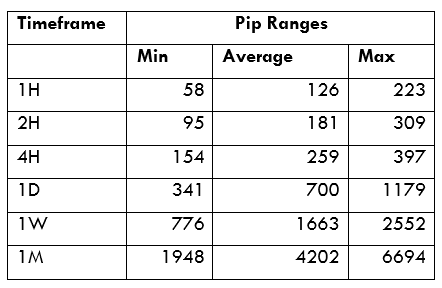
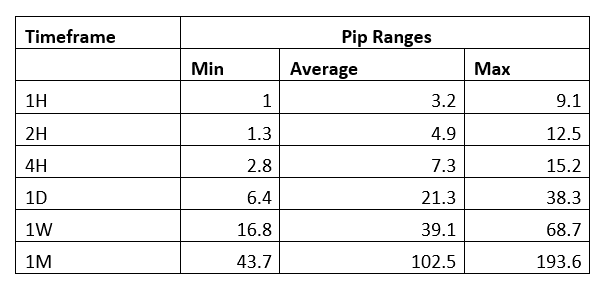
In Forex, the minimum price move is called “pip”. A pip is a variation in the fourth decimal place of the currency pair, except for the pairs involving the Japanese yen, which will be the second decimal place. The number of pips earned or lost by the value of each pip (depending on the volume of the position), less the commissions applied, results in the gain or loss.

Then we will have to convert profits or losses into the local currency at the exchange rate.

Who Can Trade CFDs?

Basically, any person with the ability to contract and who has available capital to invest is in perfect disposition to trade with CFDs. In other words, simply by being of age (and not being legally incapacitated) and contributing an amount as capital, it is possible to open an account with a CFD broker and start trading. Trading CFDs is within the reach of anyone because it is not necessary to have a large sum of money.

Advantages and Disadvantages

The advantages of operating with CFDs come from the characteristics of these products, as we have seen above:

-We will only have to deposit a part of our capital as a guarantee, being able to increase the amount of our trading operation.

-The liquidity of the profits obtained is immediate, we can withdraw the profits once obtained.

-They offer the possibility of short trading with the same ease of long trading. The trader can make profits even when the market drops.

-They are extremely agile, it is possible to perform operations of a few minutes duration. Thanks to CFDs and the leverage they offer the trader can take advantage of the slightest movement of the market.

-They require, in most cases, lower commissions than the sale of physical assets.

-They are available to anyone, it does not require much capital to trade with CFDs.

With regard to the disadvantages of:

-Leverage is the risk factor for CFDs, which can be both an advantage and a drawback at the same time. Comprehensive risk management is needed; for this reason, expert traders choose CFDs: they are masters in risk management.

-Although these products do not lack reliability and transparency, they are not quoted on an organised market.

-Daily interest payment is required due to the money borrowed by the broker in the leverage.

Categories
Forex Assets

What is the Best Trading Position? Part V – How to Choose Properly What Assets to Trade

So far, our lessons were quite technical, involving a lot of numbers and calculations. Today, however, we wish to show you how your own participation and involvement can grant you the best trading position. The examples will be based on the forex market, but the rationale of the story transcends to all markets we trade.

What are the consequences of trading widely popular currencies?

Most traders will tell you to trade the EUR/USD, USD/JPY/, and GBP/USD. Unfortunately, most people will rarely explain to you how the USD is heavily controlled by the big banks due to its popularity. What this further means is that the market can become pretty volatile and the prices can move suddenly without any logical explanation. Some other currency pairs, such as the NZD/CHF one, may escape the big banks’ attention, which is mainly triggered by a massive influx of orders. In addition, currencies such as the USD are highly susceptible to news events, leaving room for the big banks to manipulate the price in any direction they need to ensure their liquidity. That is why you should be very careful about choosing what you are going to trade in your market of choice and strive to earn as much as you can about potential dangers.

What are the best currencies to trade?

While you can trade any combinations involving the eight major currencies (avoid the USD whenever possible), you should still aim to make more profitable and stable choices. For example, trading the CAD/JPY is better than trading the EUR/USD, but the CAD and the JPY both are affected by USD news to a degree, which means that you can find other options that will prove to be better. It is your job to understand how the currencies you wish to trade work.

The EUR is a great currency to trade because it does not move much when the news on the USD comes out. Moreover, all the news concerning the EUR mainly related to the Eurozone, mitigating its overall impact. The only time traders should pay attention is when the ECB releases news, which still happens rarely and can thus be easily avoided.

The GBP, interestingly, does not correlate with any other currency, which makes it move more often than others do. Like the EUR, the news concerning this currency is easy to notice and avoid.

The CHF appears not to react even to the news it is directly related to. It may, however, react to a lesser degree to the news concerning the EUR. Furthermore, the CHF is one of the easiest currencies to manage because there is almost no erratic movement.

What are the best currency pairs to trade?

The EUR/GBP is one of the most traded currency pairs, but also one of the rare ones that does not involve the USD. Interestingly enough, this pair only accounts for 2% of the market share, which is extremely suitable for avoiding the big banks’ radar. It also gives low ATR, making it one of the least volatile pairs to trade. The EUR/GBP moves slowly, which allows you to set the stop loss and take-profit levels without the two being hit in one day. However, there is no stagnation or choppiness, making it much easier to control in comparison to other currency combinations. Also, the pair isn’t triggered by the US news and, even though both are European currencies, they do not correlate often, so you should not see either of the two gaining strength as the other one is growing weak. 

The GBP/CHF was once the inverse of the EUR/GBP, which thankfully changed after the EUR/CHF crash of 2015. The EUR and the CHF now correlate increasingly less, which allows traders to trade them both without needing to choose between the two. There are many advantages to trading this pair, including the fact that it moves much faster and trends more than the EUR/GBP.

The AUD/NZD is a perfect choice for all traders who tend to avoid volatile markets and heavy news. Both of the currencies that constitute the pair avoid the USD, which immediately takes all the unnecessary drama away. Another important fact is that the AUD and the NZD are both risk-on currencies, which is really important. Currency pairs such as the AUD/JPY, for example, are risk-on/risk-off, which makes it dependent on the stock market. Luckily, the AUD/NZD pair behaves similarly and they do not correlate much.

Additionally, any important news typically comes out early in the trading day, which is ideal for people who trade just before the close of the daily candle. In case of some unfavorable news, this gives these traders almost one whole day to see if the price will correct itself. Most commonly, the price goes back to where it was the previous day, so the news does not need to affect these trades negatively. Because of this pair’s specifics, you can either avoid it in the testing phase or use it as the control currency to see if your system functions at all.

As you can see, just by gathering information on these currencies, their histories, and trading specifics, you can discover how some common facts you read online are not necessarily true. That being said, you must find a way to experience whatever you read in a safe environment (i.e. demo account) and save yourself the pain from making the wrong choices. Whichever market(s) you opt for, make sure that your information collection strategy and research skills are at their best since this is something that will help you build your unique position.

As promised, we are giving you the results of the last problem where you were tasked with applying the scaling out strategy:

Based on the chart, we can see that the ATR is 34.86, which we will round up to 35. Owing to this information, we can calculate our stop-loss and take-profit point (52.5 ≈ 52). If we are dealing with a 50,000 account, our risk equals 1,000, so the pip value is 19.2 in this case. We will make two half trades (9.6 each). After the price hits the take-profit level, we will move the stop loss to the break-even point (the amount you invested in the currency pair in the first place).

We are getting closer and closer to the end of this series, so make sure you follow our next article and complete the story on the best trading position!

Categories
Beginners Forex Education Forex Assets

Adding a Currency to Your Trading Scope – The Singapore Dollar

A common approach to forex when traders begin their trading for the first time is to focus on one asset. Cryptocurrencies are a popular choice even though not a good pick because of many factors, one being this is still not a developed market. Many books, videos, bankers advice, and mentors suggest the EUR/USD to start with, without any good reason. Liquidity is not an issue if a broker has at least a few liquidity providers, so the EUR/USD pair as the most liquid asset on the forex is not offering any real advantages even in this area.

If we take a look at the two economies, it gets complicated. The US economy, politics, and dominance create so many possibilities to surprise your trading strategies in a bad way. And the EU economy is also somewhat unpredictable to follow with so many countries. Yet beginner traders are attracted to this pair thinking it is “safe”, easy, and because “everybody is trading it”. Our previous articles describe this pair as one of the worst you can pick, mostly because of the proven contrarian trader concept. Then there is another extreme, although rare, to go with an exotic currency pair with increased volatility. We have also presented our opinion on exotics in a separate article.

According to contrarian traders, you should go will all the majors and their crosses but avoid the popular EUR/USD and GBP/USD if there is a similar trading opportunity. This way you can fine-tune your system, plan, and mindset on various playgrounds ultimately giving you versatility. Now, as you develop, expanding the scope where you trade becomes a rewarding endeavor. But it does not come without caution. How we approach this expansion is described by a technical prop trader we are going to present in this article, using the Singapore Dollar example. 

The market during most of 2019 was flat, forex had a very low activity which can be seen just by looking at the VIX, EVZ, and other Indexes that measure volatility. In this environment, it is hard to get a relevant trading sample test with the asset you want to include in your trading array. So what you might think as good before, comes to be a very bad choice once the markets return to normal. Beginner traders are not always informed about the market stages and might go into volatile, less developed, even experimental assets such as the alternative crypto market.

A similar approach before the crypto age was when traders would often go with the penny stocks trading. When a prop trader wants to see if his system is working on a new asset, testing is a must. When the forex market is flat, testing in such an environment does not reflect normal conditions. Now, in 2020 we have another abnormal condition caused by the pandemic and extremes in the state/central banking stimulus. However, whenever there are trends to follow and capture profits from, it is good enough for signals to generate and test new assets. 

Testing involves a few stages depending on how thorough you want to be. Of course, investing more time with testing will give you more reliable data but at one point you need to decide if the results are good enough. Some currencies can have special drivers and chart characteristics we may or may not spot from testing alone. Forward testing on a demo account is an unavoidable phase after backtesting. If we want to add SGD, we can start with one pair, such as USD/SGD. After favorable forward tests, we add other combinations of the SGD, if available by the broker to test the currency and expand our trading scope. Since we aim to build a universal technical trading algorithm if you follow our structure example, there are no opportunity limits, all assets are viable. Professionals have an idea of what asset they are looking at, not all are equally interesting, therefore they scan what could be a good fit for their trading system. Trend following systems needs the volume that drives trends, without too many factors a trader cannot control (risk) and a chart with minimal whipsaws, among other, less important considerations. 

Consequently, Singapore Dollar could be a good choice. The SGD is not a currency that “drives the bus”. It is not dominant in the price move, as one prop traders describe it – it is a blank canvas. In the long term and even in the midterm, it will be the other currency that moves the price you are pairing with the SGD. As for the news impact, they almost do not have any effect on this currency. When you look at the reports, the Singapore economy is a good all-arounder most of the time. Singapore is the banking hub for most of Asia and the number one banking hub for the whole world right now. A bad manufacturing report in Singapore does not have any significance, as it turns out on the price change too. The economy is not based on manufacturing here and according to some research, even the GDP report does not have a big impact too.

Our prop trader is very interested to test currencies and markets like this, it all favors his technical trading system specialized in trend following. Now we could take other countries with similar characteristics, a few of them, but then liquidity might be a big question mark. Most of the time countries, their economy, and the currency might seem a great pick if we take all the above factors into account. But this particular currency might not be traded enough to have the liquidity we need. We do not need super-liquid pairs like the EUR/USD, but enough so we do not have uncontrollable risks caused by low liquidity on the market expressed as gaps, slippage, extreme spikes, crashes, whipsaws, and so on.

The Singapore Dollar is heavily traded, it has the liquidity, USD/SGD even has more liquidity than some of the minor pairs out of the major 8. This means we do not see whipsaws that cut the trade we have opened yesterday on a daily timeframe. Some observations conclude that SGD pairs either move smoothly or do not move much, enough to trigger our volume or volatility filters. Such movements are easily followed, ensuring high probability trades just because of the currency’s typical behavior. According to our prop trader, the only pair that is a bit jumpy is the CAD/SGD while other major combinations with the SGD are smooth. 

The picture above is the USD/SGD daily chart with smooth trends followed by clear flat periods even during the pandemic shock starting from march 2020. 

A few areas of caution, by looking at the other charts, you may think SGD pairs correlate. This may seem like a possibility but by looking at a zoomed out chart you will conclude pursuing signals out of correlation is not effective. The picture below is EUR/SGD (orange line) and USD/SGD (blue line) is showing mostly positive correlation until July 2020 when it became negatively correlated and then back again later. 

Correlations are hard to use in trading according to the experience of prop traders. Even if you notice a correlation, be it accidental or fundamental, the move should reflect in your trading system anyway. Trying to predict the movement of one asset just after another moved in the opposite direction is a hardly effective strategy. As described in our article about correlation, it is a good idea to ignore this type of analysis. 

Another factor traders might consider when looking for a new trading asset is the spread. Unless you are following a very high-frequency scalping strategy, the typical spread amount should not count as a criterium. It is a common misconception to trade nominally tighter spread currency pairs. Tighter spreads will give you a bit more if you are trading on an hourly chart, for example, although on the daily chart the spread is mostly marginal relative to the potential gain. Only highly illiquid exotic pairs have wide spreads and only on certain events. The spread dynamics during the day are not known unless measured, and rarely anyone measures it. An unaware trader can decide to trade some asset or pair just because the spread at that moment was tight, not knowing it can widen multiple times and trigger the Stop Loss. Optimal daily timeframe strategy will unlikely be affected in this way, however, the spread should not be a deciding factor in any case.

Aside from spread dynamics, which can also be dependent on the broker liquidity providers, traders also commonly forget to measure the volatility to spread ratio. Volatility is easy to measure with the ATR indicator. Now, comparing the ATR to spread ratio across assets can give us an approximate spread influence on our trades. Some currency pairs have higher spreads and lower ATRs, while some other pairs can have similar spreads but very high ATRs. NZD/CHF might have 3 pip spread but the ATR of 47 pips, meaning the spread percentage is about 6%. This percentage is one of the worst out of the 28 major currency pairs and crosses. High-frequency trading strategies on lower timeframes might have some use out of this analysis by choosing currency pairs with the best ratio (low spread with high ATR). Although if you trade on a daily chart using our algorithm structure and plan, it is completely redundant. 

Do not concern yourself with the spread, including on your search for a new currency or asset to trade. ATRs on the SGD pairs might not be very high compared to other pairs and the spread might not be as good. Still, daily timeframe traders should not care about this. If you have some criteria to trade only when the spread is lower than 3 pips, for example, missing out on a 150 pip trend because of 3 pips is a foolish decision. On the other hand, if you just randomly pick assets to add to your trading scope, you will probably find out your system cannot be as effective. Do your backtesting and then a good sample of forward testing. If the results are good, nothing is stopping you to reap the extra rewards.

To conclude, keep in mind the economy of the country behind the currency, how sensitive it can be on news events, how the charts look, is the currency liquid enough. In the next few articles, we will be covering how you can translate your forex trading system, adjust it If needed, and apply it to other markets. The Singapore Dollar is a good choice if you are looking into exotics, but it is rarely considered by traders. Currently, the SGD daily charts look smooth even during the pandemic and could even be a better choice than a pair with the majors only.

Categories
Beginners Forex Education Forex Assets

How to Choose a Currency Pair for Trading in Forex

Two mistakes that a lot of new traders make is to simply select a random currency pair to trade or to try and trade too many different pairs at once. An important thing to do when first starting out is to decide which currency pair you want to trade with, you can, of course, change this decision in the future or to pick up multiple other currencies once you have a bit of experience. However, that initial first currency pair can make a big impact on your trading. This is why we are going to be looking at how you can choose that first currency pair that you are going to trade.

Before we select the pair that we are going to be trading, we need to actually understand what a currency pair is. The currency pair is what it sounds like, it is simply a quote of two different currencies. There is the base currency which is the first currency listed so in the EURUSD pair, it would be the EUR, the quote currency pair is the second currency, so again for the EURUSD pair, it will be USD. The quoted figure is the current exchange rate of the base currency for the quote currency. For example, for the EURUSD it may be 1.11 which would mean that you get 1.11 USD for each Euro traded.

When first starting out with trading, it is recommended that you select one of the major currency pairs. This is for the simple reason that the amount of volatility is lower and the amount of liquidity is higher, this offers a much safer trading environment with less violent price movements than some of the minor or exotic currencies. Some of the major currency pairs to think about have been listed below along with some of their main characteristics, to give you an idea of what is involved in them and how they may behave.

EUR/USD

This is the world’s most traded currency, this currency pair has the highest level of liquidity out of any of the available currency pairs. Due to this, it is also one of the most stable. While it does have a lot of large trends, moving large distances, it does this at a slower pace, never jumping too far with a single tick. Many describe this pair as one of the safest pairs to trade due to it having the lowest spreads of all currency pairs. This pair is most active during the European and American sessions and can have some added volatility when there is news within the Eurozone and the United States.

USD/CHF

The US Dollar against the Swiss Franc, this pair often moves the other way to EURUSD, it has smaller movements with very few large jumps and often has a small spread making it one of the safer currencies to trade. The Swiss Franc is a safe haven currency which means that when there is a crisis or economic drop, it can also go down in value, this pair is active during both the American and European sessions.

GBP/USD

This used to be quite a safe pair to trade, but now with Brexit happening it is a little less predictable. There is still hope that once the Brexit saga is over that it will return to its old steady self. It is still incredibly popular for traders due to its increase in volatility and profit potential. It can have slime huge movements which are perfect for trend traders but also have a lot of breakouts as well as false breakouts which can catch people out. This pair reacts a lot to events in Britain and is most traded during he European and American sessions.

Other pairs include things like the USDJPY, USDCAD, AUDUSD, and NZDUSD, those are the other major pairs. Generally, they will have lower levels of volatility than the minor pairs but can still react quite a lot to major news events. They are often good for trend trading as they can have long drawn out movements rather than large and quick jumps.

The minor pairs include things like EURJPY, GBPJPY, EURGBP, EURCHF, GBPCHF, EURCAD, and GBPCAD, these pairs can have some added volatility to them and so are often not recommended for new traders. Instead, stick to the major pairs to start. The Exotic pairs include things like USDZAR, USDMXN, USDTRY, and USDRUB. The liquidity on these pairs are lower so you cannot make as larger trades at once and they can also jump about a lot which can make them very profitable, but also very dangerous which is why they are not recommended for beginners.

We mentioned above that it is recommended that you only trade with a single currency pair to begin with, this allows you to concentrate fully on that one pair. It also means that you are able to learn more about the way that the currency pair moves, allowing you to better analyze and trade it. You can branch out afterward, but we recommend learning all that you can about one before you try looking at another. You do not want to get confused and to mix up the characteristics of different pairs as this can lead to a series of losses.

In order to select the pair that you want to trade, you will need to look at a few things. The first is the strategy that you are going to be using. Some pairs are better for longer-term trading and others for the short term. If you are a scalper then you want a pair that has more volatility. If you are a trend trader, then you want one that goes on larger and longer movements over time. You also need to consider the time that the pair is most active. If you are from the Uk, then there is no point in trading a currency pair that is most active in the middle of the night, instead of one that works for the time that you will be up and that you will be free. 

You should also consider the spreads. Different pairs have different spreads. If you are looking for short-term trades or to scalp, then we would not recommend getting a currency pair with a larger spread. This will make it very difficult for you to make a profit, so instead, you would need to go for one with a small spread. This doesn’t matter quite as much for trend traders, but it is still worth considering the impact of the cost of a currency pair when looking at your potential profits.

So those are some of the things that you should think about when you are selecting a currency pair to trade. Think about your strategy, the costs, and when you are available to trade, then think about the characteristics of the different pairs. Work on one pair at a time until you have a good understanding of it and then move on to your next one. Don’t try to do too much at once and you should get on just fine.

Categories
Forex Assets

Trading The JPY/HUF Forex Exotic Currency Pair

Introduction

In the JPY/HUF currency pair, JPY represents the currency of Japan. On the other hand, HUF is the Hungarian Forint. This currency pair represents the value of Hungarian Forints (quote currency) per Yen (base currency). This pair can be represented as 1 JPY per X HUF. For example, if the value of this currency pair is at 2.91 (CMP), then about 2.9 HUF is required to purchase one JPY.

JPY/HUF Specification

Spread

If we want to determine the spread, we should subtract the Bid price and the Ask price. Spread is a trading charge that the broker takes as soon as we open a trade. This value changes with the change of the execution model.

Spread on ECN: 13 pips | Spread on STP: 18 pips

Fees

Every broker takes a trading fee from a trader. The process of taking the fee is almost the same as every broker in the world. Note that the fee is only applicable to ECN accounts.

Slippage

Slippage happens when the execution price and open trade price are not the same. The volatility and the broker’s execution speed are the main cause of slippage.

Trading Range in JPYHUF

The trading range is the representation of the minimum, average, and maximum volatility of this pair on the 1H, 4H, 1D, 1W, and 1M timeframe. Using these values, we can assess our profit/loss margin of trade. Hence, this proves to be a helpful risk management tool for all types of traders.

Procedure to assess Pip Ranges

  1. Add the ATR indicator to your chart
  2. Set the period to 1
  3. Add a 200-period SMA to this indicator
  4. Shrink the chart so you can assess a large time period
  5. Select your desired timeframe
  6. Measure the floor level and set this value as the min
  7. Measure the level of the 200-period SMA and set this as the average
  8. Measure the peak levels and set this as Max.

JPYHUF Cost as a Percent of the Trading Range

With the volatility values from the above table, we can determine the chance of cost with the change of volatility. We have got the ratio between total cost and the volatility values and converted them into percentages.

ECN Model Account 

Spread = 13 | Slippage = 5 | Trading fee = 8

Total cost = Spread + Slippage + Trading Fee

= 13 + 5 + 8

Total cost = 26

STP Model Account

Spread = 18 | Slippage = 5 | Trading fee = 0

Total cost = Spread + Slippage + Trading Fee

= 18 + 5 + 0

Total cost = 23 

The Ideal way to trade the JPYHUF

As per the above data, we can say that JPYHUF is not an extremely volatile pair. Therefore, traders from every level can trade with it and make money. The average cost per trade in the H1 timeframe is at 41.86%, which decreases to almost 1% in a monthly timeframe. As a trader, it is often hard to trade in a timeframe like weekly or monthly, as it is very time-consuming. Therefore, sticking to the hourly to daily timeframe is recommended for traders to minimize the trading cost.

Another way to reduce the cost is to place orders as ‘limit’ and ‘stop’ instead of ‘market’ orders. In limit orders, slippage will not be in the calculation of the total costs. Therefore, in the below example, the total cost will be reduced by five pips.

Limit Model Account (STP Model Account)

Spread = 18 | Slippage = 0 | Trading fee = 0

Total cost = Spread + Slippage + Trading Fee

= 18 + 0 + 0

Total cost = 18

Categories
Forex Assets Forex Basic Strategies

Key Strategies the Pros Use For Profitable Gold Trading

Trading and investing in Gold is one of the top searches on the internet and a hot skill that could be the best thing to develop nowadays. As one of the four precious metals usually offered for trading by brokers, gold is the most popular, most traded and historically the most valuable asset one can have in an economic downturn. Forex traders are in a very good position to grasp the advantages of precious metals trading, the small differences are easily adopted, the principles are the same.

Trend following is still the best approach, yet metals also offer opportunities for other trading combinations such as reversals. Before we move onto the actual gold differences, beginner traders should be familiar with the system structure and trading we apply in the metals assets category, using what we have mastered in the forex. The article in front of you will firstly digest gold fundamentals, trading requires some fundamental basics about this metal even though we are using mostly technical analysis systems. There is uniqueness for each of the 4 metals we are going to analyze.

XAU is the symbol mostly found on the brokers’ asset list for gold, the X stands for index or spot market and AU is the symbol from the periodic table of elements. In the asset contract, it is expressed in troy ounces which is slightly different from standard ounces. One standard contract holds 100 Oz and the chart price is for one Oz. 

Gold is not used in production very much when compared to other metals, only 10% of the total gold extracted is used for various jewelry and electronics. So the demand for gold from the industry is not the main driver for its price, even though electronic devices are making a breakthrough in everyday lifestyle. The main drivers come from safety, hedging, and investment needs. Countries also use it for the same purpose except the amounts are measured in tons, Russia, and China currently being the biggest hoarders of this metal. Rich people also have this habit to collect gold in various forms but a part of them do not use it primarily for investment. 

The image above is the supply of gold including a few years of prediction at this rate. Now, according to a certain group of prop traders, this is contrary to their expectations. They think millennials had new know-how and technology to boost production in the coming years, including better technology to find new deposits. The chart accounts for this phenomenon although the decline is still evident. This information has a huge bullish prospect for gold. The chart implies humanity can bring whatever technology they can to extract gold but unless it is dramatically effective in a short time it is not going to cut the price in a few years or compensate for the fact most of the gold is already extracted.

The chart is not implying anything related to world economic cycles, pandemics, or crises, making it easy for youngsters and traders to realize gold is the ultimate protection and savings solution. To some theories, China and Russia’s gold accumulation can bring the power balance to shift very quickly towards them. They do not have to strategize with trade wars, politics, military actions, all they have to do is gather the power out of gold holdings and wait out the west fiat influence to slowly fade out. Cryptocurrencies are also into play with this theory some might call crazy, but the effect is very close to being clear in a few years. 

Investment wise, the gold price cannot go down to zero for sure, we can only witness some short term falls unless a miracle economy recovery or a golden mountain is discovered. When we look at the supply, long-term investment is logical but the demand is increasing too. Aside from the governments across the globe hoarding gold, the population is also very interested in physical gold holding. If you are well informed about the economic cycles, we are well past the peak and into the downturn, however, if you look at the equities indexes, there is no evident downturn. This could mean the crash is going to get more dramatic and gold will be one of the first assets masses will flock to. 

XAU/USD and the USD Index can both move up as safe-haven assets but explains gold is in charge of the move, not the USD in the XAU/USD pair. When the metal has a reason to move it does not matter how strong is the currency denominating it. Investors, funds, and other major players will stock up gold reserves early in this trend, you will probably see signs like higher gold premiums, price action volatility, VIX, and $EVZ pick up, and others that a crisis is around the corner. Simply when things go bad, gold is the only asset people see as valuable, it has been like this for centuries. Essentially this is what investors do, when the world burns they hold the gold, and once recovery is in sight, cash in the gold and buy risk-off assets cheaply. Once another cycle downturn emerges, repeat. It is true these individuals make riches in such times. 

Now into the technical specs of XAU. Gold moves in smooth trends. Smooth trends trigger technical algorithms signals early in the trend and trades see a followthrough. On a daily timeframe (we like to use) this is especially true. In forex, it is common to have step-trends, the kind that triggers the signal to trade on one candle and then a period of flat price action and then another step candle. Choppy trends like this are hard to follow, and they are happening even on slower systems just with a few candles more as steps. Compare the XAU pairs with forex, the charts show smooth transitions most systems can pick up easily. Whatsmore, gold also exhibits smoother price action than other precious metals. All precious metals have this characteristic but gold is a special case. Because of this, our trading systems can have tighter Stop Loss levels relative to the initial position.

The trend will in most cases continue on its way up or down, it does not need some correction room as with forex where we have to leave some space so it does not trigger our Stop Loss too soon in an emerging trend. If we take our algorithm money management plan of 1.5 ATR Stop Loss from the entry price level, we can cut it to 1.35 ATR. The 2% risk profile is still on, just in metals trading we distribute the risk capital onto 1.35 ATR pip range. Metals do not leave traces of bank manipulation effect, there are still some but the effect is very small and the frequency is lower. Therefore, whipsaws do not happen often because of this, it is more likely the metal is changing course. 

Interestingly, gold with its smooth, somewhat predictable moves is easy to trade and we can also apply riskier strategies, like reversals…until Trump became president. Unfortunately gold is not immune to Trump’s tweets, speeches, and announcements. Gold is the fear metal, a panic buy button. One day a tweet may be about a trade war with China and one day after a positive outlook about a good deal with China. Banks can use the news as they see fit for short term USD manipulation, the price of gold will rocket as fears creep in, and when everybody goes “whew” it goes back down. These events will trigger your Stop Loss even if you see everything going smoothly. There is no defense against Trump’s tweets as we have explained in our previous article about them. Of course, you can avoid this inherent risk by waiting out his mandate but trends are still much better with gold than with forex, especially the USD currency pairs.

Prop traders adjust to this by bringing the Stop Loss level further away, like in forex to 1.5 ATR, but ultimately it is up to you if you want to avoid or adjust the risk profile. Since the new US presidential election is coming soon, hopefully, new traders will not have to deal with this. China’s trade war may not be a focal news point as pandemic cut down countries GDP measured in two-digit percentages, but the west tries to slow down the China extreme takeover in the global economic dominance. As a trader, you can expect more risks coming from this issue regardless of who will be the new US president. 

To wrap all up, know the asset you are trading, the fundamental drivers. Gold respects the supply and demand as all precious metals but the upcoming trends, statistics, and results show holding gold is almost a certain win. Contrary to forex, knowledge about the swissy background will not help you much for technical trading as gold can. Risk related to gold is reduced by its price action nature although know things masses react to, like the Trump tweets, can mess your trades. Gold is gathering the fears and as such you will need to know fundamental drivers. Adjust your risk accordingly and enjoy smooth gold trends.

Categories
Forex Assets

Coronavirus: What are the Best Pairs to Trade Heading into 2021?

At the moment of writing this article, we see a lot of turbulence involving the COVID-19 mixed in with the dramatic US elections aftermath. The pandemic presents a unique environment, one which cannot be categorized into a recession cycle or anything we have experienced before. We see the first large scale pandemic in modern history. Does this mean some assets are going to be better performing?

It is hard to predict future movements, you can ask any serious investor such a question. They are bombarded with them and what most say is that they do not know. But they can rely on some data that points to some expectations. It’s logical to see certain commodities and precious metals tied to economic activity level, still, it is not known exactly when oil is going to spike with the activity coming back to normal. Nor we may expect the same spike will happen with metals related to industrial activity. Entering any reversal trade based on a hunch is a great way to lose, but we can stay in certain safe heavens until it is time to slowly go into risk-off assets after clear indications the worst is over. 

Let’s see what happened since March, once the pandemic went viral and global. We will first analyze risk-off currencies such as NZD, CAD, AUD, then the neutrals, GBP, EUR, and lastly safe heavens USD, JPY, and CHF.  The NZD did not endure any special selloff. According to the picture below which represents the NZD basket against other major pairs, we see the exact opposite. Is this because New Zealand fared well in the fight against the pandemic than other countries? Unlikely. The correlation between the COVID-19 patient numbers and the currency directions is random in most countries, therefore trading based on these statistics is a bad idea.

The AUD followed a strong positive correlation with the equities or indexes. It is almost copied price action. The vertical red line marks the March pandemic breakout. Before the breakout, AUD was in a downtrend that looks like it just amplified a bit before it went long again. This price action seems it does not care about the pandemic at all. If we want to pick a currency to trade in 2021, COVID-19 impact on a single economy should not be our criteria. However, some other assets as mentioned above are directly affected. 

Canadian Dollar is considered correlated to oil. Most of the informed traders know about the oil price shock once the pandemic forced lockdowns in most of the world, especially developed economies, except China. From the CAD basket chart below, we see extreme whipsaws and price action that spells trouble for trend followers. We cannot say this chart is positively correlated to oil, we also do not see a small correction as with oil. How price action is going to look like in 2021 based on this info is completely unknown. At this point, CAD seems to be the worst currency to trade unless you have some special range-effective strategy.

So what we see in risk-on currencies is that AUD and NZD do not care about COVID-19 but are somewhat in-line with indexes. NZD is not the same copy, although it tends to move like the AUD. New Zealand was one of the best countries to cope with the pandemic, but this is not the criteria you should rely on. One should know Australasia currencies are very tied to China’s economy, a country that seems to know how to control the spread of this virus. However, China relies on export and inevitably depends on importers such as the USA and EU. 

Great Britain Pound has a lot of major fundamentals affecting its economy. Brexit, internal political struggles, COVID-19, and discouraging economic indications. GBP price action chart shows a strong bearish move than almost as strong pullback after the pandemic had started getting global. Chart analysts will easily spot three strong support points after the initial shock. Similarly to the CAD, GBP is extremely unpredictable by any means, probably only partially good for range-bound trading strategies. 

Euro and GBP seem to be in the same boat. EU countries took catastrophic hits to their economy and health systems. Has this affected the EUR? It is, but not in a negative way. By looking at the price action below, we see a strong uptrend after the pandemic start and then calm consolidation that lasts for months. Is the EUR the best currency to trade with? Depending on your strategy, range-bound reversals with channel indicators are probably the best way to go here, pairing the EUR with another ranging currency such as the GBP. In 2021 it is hard to predict what will happen to the Eurozone, but for now, it seems not much can shake this market. 

Swissy is copying the EUR. According to the price action below it is not behaving as the safe-haven currency, more like the EUR clone. Does it mean it lost its reputation? Unlikely, it just means it is not a safe haven in situations when the whole world shuts down. Similar to the above range-bound currencies, it is not a good pick for trend following strategies. 

JPY is not regarded as a safe haven apparently once COVID-19 went global and serious. It is just more volatile than the CHF but after the 2020 US elections and the recent vaccine announcement, it is testing its major support level before the pandemic. It is yet to see if this is just another spike before the real economic downturn is about to start.

Finally, the USD went sharply up but investors soon realized the US economy does not have that safe haven characteristic, what’s more, the pandemic has a strong impact on the ideals of this country, pushing the USD down more than any other currency. 

All this can provide us with some results which are the best pairs to trade until now during the COVID-19 since March 2020. The biggest difference index or pairs that moved the most are AUD/USD, NZD/USD, AUD/JPY, NZD/JPY, and to a lesser extent EUR/USD and GBP/AUD. Therefore, these pairs are the best for trend followers. Range bound strategies would probably like EUR/CHF, EUR/CAD, CAD/CHF, and AUD/NZD. Is the same going to continue in 2021? If vaccines prove to be effective we can probably see risk on sentiment again, however, the pandemic might have pushed the economic cycle off the cliff, causing another economic crisis on steroids.

Recently, after the US elections, we have witnessed interesting events. Pfizer and its partner, BioNTech announced the vaccine after the US elections, spiking equities up. Gold went sharply down back to the pandemic showup rally support. Gold futures experienced a single day decline not seen in seven years. However, some assets enjoy a real safe-haven personality – cryptocurrencies. Bitcoin is back to $15k levels at the moment of writing of this article, resembling the famous rally from 2017. So, gold is not really going to be a pick for 2021 unless we are into recession, Bitcoin on the other hand is on a good track to be both, pandemic safe heaven and also a recession safe haven.

Cryptocurrencies are volatile and require adapted strategies to trade. They are still considered risky assets and should be only traded with also good risk management. If we had to pick an asset to trade, it would not be currencies unless we see the end of the pandemic. In that case, going back to risk-on currencies seems a reasonable choice. If an economic downturn is about later, it is going to be global so precious metals and crypto could be the right choice.

Categories
Forex Assets Forex Basic Strategies

Embarrassed By Your Index Trading Skills? Here’s What To Do…

Indexes are popular as they represent the economic activity in certain areas. Therefore it is often the case to see a company stock move inline with the index it belongs to. Some traders turn to trade only indexes instead, it is easier to conduct fundamental analysis based on aggregated performance than to follow what a single company is doing – unless a trader is very familiar with its capital structure, reports, and its services or products.

German traders are very interested in trading their DAX index, what’s more, they are very informed about their economy and even beginner traders have a good knowledge base to start trading the DAX right away. Following our previous series of articles about carrying over our forex trading experience and systems to other markets, this article will be about what we need to adjust to being as good in the index asset category. We will present just some opinions from professional prop traders, following the algorithm structure and ruleset already described before. If you have a system already with good results in forex, there is no reason not to transfer that knowledge and the system to seize opportunities from other markets.

Since each asset category has specialties, indexes require attention to several market aspects, additional work is also a lot of testing. By exploring other markets from forex, the overall capital gain potential is increased to a big extent, just by having 10% from forex, 10 from precious metals, 2% from commodities trading, and an additional 10% from indexes make a difference. Of course, mastering one market before moving to another is the right approach, although people are not prone to get out of the comfort zone. The percentages above are for an average trader who has a proven system and a plan set in place already, it is not an elite benchmark, but it is an elite gain all combined. To compare, elite traders and investors have a 15% return from one market per year, consistently.

Do not be impressed by an expert advisor or signals provider with their presented unrealistic returns as it is almost always extremely high to attract your attention only. After we address the fundamental peculiarities, we will make adjustments to our algorithm or technical analysis.

Trading indexes for individual traders is done through the CFDs. These contracts allowed great freedom in terms of what we can trade, be it precious metals futures, commodities, or indexes. Long and short positions are possible even with stocks over the CFDs. Now, CFDs have leverage and therefore margin, allowing traders to have bigger buying power than what is otherwise possible. Leverage also amplifies the amount traders can lose, going beyond zero. In classic buy and holding strategies, you can lose all of your investment value only if that asset goes to zero, which is not likely, nearly impossible for precious metals. Using CFDs, depending on leverage amount, you can lose all investments if the asset falls in value, even if it is just a 10-15% drop. Money management we carry over from forex will make your trading completely protected from this risk since we are very strict on how much we allocate for each position. Traders should first understand CFD type financial instruments before trading, they bring certain benefits and increased risks compared to traditional stock trading. 

Indexes you are about to trade are volatile compared to forex. Their daily ATR (14) value is very high, much higher than precious metals, and could go to 13000 pips. Consequently, you will also find trading indexes require more capital. The usual amount in your demo account such as 50.000 USD may not be enough, contracts are not the same size as well as the price per one unit. Also, note trading indices carry an increased risk of unexpected trade “glitches”, and by this we mean your positions could be closed by broker adjustments to their products. Such changes are usually announced by email and they are mostly about indices from certain countries where elections or other events are expected to heavily affect their equities market.

Brokers can change the terms during these times as they see fit, mostly it is just the leverage reduction, although, they can completely close the assets from trading. If you happen to have a position in such assets, they are likely to be forcibly closed. Sudden spread widening is also an issue with volatile assets such as indexes, if the volatility spike is extreme it could trigger your Stop Loss levels even though they are properly set in line with your trading plan. Therefore, demo trading for a longer period is a must. 

Indexes price action is very active, you will have a lot of signals and you can even be thrilled how good you are. If you are lured into real money trading with indexes before forward testing your system for a few months, it could cost you. Backtesting will take more effort than with other assets, there will be plenty of signals to mark and measure, and they all have to be compared. Every time you make adjustments, be it another indicator or money management rule, collecting results and comparing them will be the biggest part of your job. Forward testing will discover new issues such as above mentioned volatility spikes and spreads that may cause your successful backtested system to perform much worse in real-time. When this happens, be ready to make a new plan or elements to cut the losers first, then think about pushing for more winning signals without compromise. 

CFDs are somewhat restricted to US citizens. Alternatives to this limitation exist, one of them is trading ETFs instead. There are inverse ETFs that allow shorting whenever you are actually in a long trade, and for certain ETFs, you even have 1:3 leverage. So Exchange Trade Funds are more than enough substitute to CFDs, however, you will need to do research about them, they have specifics we are going to talk about in another article. 

Now let’s get into the technical adjustments and setup for indexes according to technical prop traders’ recommendations. Firstly, you may notice correlations between the markets or indexes. If you are familiar with our opinion about correlations from articles about precious metals and forex trading, indexes are not much different. Correlation comes and goes without any clue why. Let’s take a look at the charts below, the daily timeframe shows very correlated movements between different indexes. 

The S&P 500 (sky blue line) has exaggerated price action in this whole year outlook compared with the rest of the most popular indexes. Nikkei also has somewhat uncorrelated moves in certain places but overall positively correlated with the rest. Now, take a look at the weekly timeframe. 

The zoomed out decade period shows completely different charts. At some points, we see a correlation, and then it is gone. Nikkei 225 (yellow line) is drastically different but all come into positive correlation during the COVID-19. 

Nikkei 225 remains flat on this latest 2020 weekly time frame chart, even with a mild bullish sentiment in the last two months while S&P 500, DAX, and Dow Jones Industrial are starting to slope down. It is hard to use any correlation info to the actual trading, it is not consistent and traders know consistency is a must. Some might notice a tighter correlation between US-based indexes since they are measured in the same country. The most uncorrelated index is the Nikkei 225. Now, similarly to precious metals trading, you do not need to trade various indexes for diversification purposes, it is redundant as indexes can move in and out of sync. It is recommended to trade only two indexes, regardless if there is a correlation or not. As our prop traders say, less is more in this case, you do not get any special advantage by having positions in more than two. If you have a signal on two indexes, one from the US and the other from the EU, trade them both only if they are not correlated on a daily chart. If they are correlated, trade the one with smoother price action. By comparing the DAX and CAC you can notice DAX is more smooth, so it is an easy choice. 

Note indexes have different uptime, they close at different times too. So the daily chart, the easy-going trading routine only at the session end could be a bit shaken if you expand to trade indexes. Your trading routine would also need some adjustment if your lifestyle allows it. Know you will be in constant action, indexes move all the time because traders, institutions, and investors need to be active, their jobs demand it and their investors require gains. 

If you keep your trading scope to 4 indexes, 2 from the US and 2 from the EU, you may want to explore Asian markets, the Hang Seng index. This Hong Kong (HK50) index has very attractive price action for trend traders that developed systems according to our recommendations and structure. HK50 rarely has flat periods for more than a few days. HK 50 has many fundamental drivers and still, apart from elections events, you can ignore them all! If you stick to the daily and higher timeframes, just do what your system tells you, no need to look at the event calendars. Non-Farm payroll might affect an index from the US, but the trend will prevail with only one or two candles in the correction way after the event. Indexes have such drivers they do not react too much and the memory does not hold for long. 

On top of the HK50, you may go even further to the Australian index, also symbolized as AUS200 or ASX 200. This index has its specific price action and this is a good thing. It is not moving as the US and the EU indexes, therefore you can also pick one from other geographic markets. India 50 is another example of alternative markets you can trade when you need something uncorrelated. Just know the ATR values with these are extreme, in one day you can find candles that moved 7000 pips in one day. Make sure your money management is sound before trying. Some brokers do not offer less popular indexes so you may not find Taiwan MSCI and other alternatives. Make sure you find a good combination and limit your scope, keep it simple. Pick 3 or 4 different indexes, a couple from the US and EU, and one or two from Asia or Oceania. 

Finally, let’s see what you need to change with your technical algorithm. It should have 6 components as we have discussed before. Indexes move relentlessly, therefore the volume indicator is not needed here. Even when there is no general direction, it is short-lived. Choppy price action like with certain currency pairs is not going to be present with indexes, expect a lot of strong trends. As a result, you do not need any volume measures, trade indexes like you would Oil. To remind you, implement adequate confirmation indicators to indexes, as well as exit indicators, and eliminate the baseline element too. What you end up having is two confirmation indicators and one exit adequate for indexes, ATR (14) indicator if you need to calculate position sizes, Stop Loss and Take profit levels, nothing else. 

In conclusion, indexes are up for grabs since you know about forex trading. Carrying over that trading style to other markets is an easy process, yet you still have to do a lot of testing. The exact recommended levels for risk management can be modified if you feel you would have better results otherwise, make sure you know what you are doing, ATR values are extremely high here. If you are from the US, know there are many ways you can trade Indexes even if you do not have access to CFDs. Lastly, know you are going to apply your trading knowledge and quickly master new markets with it. You have a higher goal now and that is to add on consistent returns wherever you can, be it forex, precious metals, oil, or indexes.

Categories
Beginners Forex Education Forex Assets

Which Currency Pairs Are Most Volatile?

One of the most prominent and most important decisions that you need to make at the start of your career is which currency pair you are going to b trading, there isn’t a right or wrong choice to make here. It will be down to your own preference, and will also need to take into account what your trading strategy is as well as your risk management plans.

One of the things that you should be thinking about when you select which currency pair is the amount of volatility within that pair. The forex markets are incredibly liquid with a lot of money going through them which normally means that there is a lower level of volatility. However, there are many reasons as to why certain currency pairs will have a lot more volatility within them than others.

The volatility of the currency pair that you decide to trade with will affect pretty much every aspect of your trading, the more volatile pairs can mean a lot bigger profits, but the other side of the coin is of course that there are opportunities for much greater losses too, as a result of this you are going to need to balance the potential gains against the potential risks. So we are going to be looking at some of the slightly more volatile currency pairs today, these pairs can offer fantastic opportunities but should be traded with caution, some are quite popular, others are a little rarer and not even found on the majority of brokers.

Just before we get into which the most volatile currency pairs are, it is important that we have a basic understanding of both what a currency pair is and what volatility is. So if we start with currency pairs, each pair is made up of two different currencies, the base currency, and the quote currency. The value of the currency pair is determined by how much of the quote currency make up a single unit of the base currency. So if we were to be looking at the GBPUSD pair, the base currency would be GMO and the quote currency would be USED due to it coming second. So you will then need to work out the price of both the base currency and the quote currency in order to work out whether that air is worth trading.

Volatility is something that is spoken about quite a lot when it comes to trading and forex, volatility is basically the amount of distance that the price fluctuates. The higher the volatility on a currency pair the more the price will move up and down, with a less volatile pair like the EURUSD moving less with each tick (movement). Price movements are of course measured in pips and so the higher the volatility, the higher each pip value and movement.

So let’s take a look at what some of the more volatile currency pairs are that you can trade…

USD / KRW: This pair is made up of the US Dollar and the South Korean Won, it has a highly inflated exchange rate which can make price fluctuations for this pair very common. Some traders seem to think that this currency pair is quite easy to trade and so more and more people are beginning to trade it, this does however mean that the volatility will only increase making it even more dangerous.

USD / BRL: The Brazilian Real falls into what is known as an exotic currency, this means that it is coming from an emerging market. These sorts of currencies often have much higher volatility so pairs such as this one with an exotic currency in it are often far more volatile.

AUD / JPY: The Australian Dollar and Japanese Yen is another very volatile pair, this is known as a commodity currency and these sorts of currencies can be very volatile. Yet the Japanese Yes is one of the least volatile currencies available on the market and people look for it to bring stability to their portfolio. The opposites of these two currencies give the currency pairing a high level of volatility making it very profitable for people looking to profit on price fluctuations.

NZD / JPY: This currency pair works very similarly to the USD JPY pair that we mentioned above with a very similar relationship between the two currencies. Once again the NZD is a commodity currency, its value is mainly tied to the exports of dairy products, honey, wood, and meat. A change in price for some of these products will cause a jump in volatility for this pair.

GBP / EUR: Ten years ago this currency pair would be on this list. However, due to the ongoing Brexit negotiations starting in 2016 this pair has become a lot more volatile, as have many of the pairs now containing the Great British Pound. Each and every news event regarding Brexit shakes up the volatility of this pair with rather large jumps and trends being caused by the news.

CAD / JPY: The Canadian Dollar is heavily dependent on oil prices, this currency pair has a similar relationship to that of AUDJPY and NZDJPY, the inverse in these currency types can cause a lot of volatility. With changes in the price of oil being quite common, it is not uncommon to see jumps in the price of the CAD and so added volatility for this currency pair. If you are thinking of trading this pair, then be sure that you are also monitoring the prices of oil.

GBP / AUD: The GBP USD pair was once again quite a stable currency pair in the past, but there has been a lot of conflict between the US and China in relation to their trade war which has disrupted the trade links between Australia and China, something that Australia really relied on and still does. Due to this, the Australian exports have dropped in value which has, in turn, made the relationship with the GBP a little more volatile.

USD / ZAR: South Africa is one of the world’s primary exporters of gold, and when selling gold around the world it is generally priced in USD. Due to this, the price of gold is highly linked to the strength of the US dollar, and so as the price of gold increases, it will mean that you will need more Arin in order to purchase USD, thus increasing the volatility of the markets.

USD / TRY: There has been a lot of political instability and disruption within Turkey which has caused the Turkish Lira to be incredibly volatile within the forex markets. During moments of political importance such as elections or coups, the volatility of this pair will spike dramatically.

USD / MXN: The relationship between the US and Mexico has been a little wobbly ever since Donald Trump was elected as the president of the US which has caused a lot of volatility within this currency pair. Even more recently, there have been some added tariffs on Mexican exports which have caused an even greater level of volatility within this currency pair.

So those are some of the most volatile pairs to trade, there can be a lot of profits in trading these pairs. However, there can also be a lot of danger, as the potential profits group, so do the potential losses, so these sorts of pairs are best left to those that have studied them or are considered to be experienced traders. Having said that, feel free to experience them on a demo account to get a feel for what it is like trading a volatile pair, you never know, it may be what is right for you.


Categories
Forex Assets

Which Are the Most Popular and Profitable Currency Pairs to Trade?

When it comes to forex trading there are a lot of pairs available to trade, a lot of them from the majors, the minors, and the exotic pairs. Some are, however, far more popular amongst traders than others. The world of Forex is attracting more and more people as time goes on, yet many of them do not know what the most popular pairs are or what the most profitable pairs are, they simply choose a random one and then start trading. So that is why we are going to be looking at what some of the most popular and most profitable forex currency pairs to trade are.

Before we do that though, let’s take a look at what a currency pair actually is. The forex market is the global market for trading currencies, it’s also the most liquid financial market in the world. Forex trading is simply the process of buying one currency while at the same time selling another, this is also the reason why the currencies are trading in pairs, one being bought and the other being sold.

There is a base currency and a quote currency, the base currency is the one that is quoted first while the quote currency is the currency symbol that is stated second. So if we were to trade the GBP/USD pair, then the GPB will be the base currency while the USD will be the quote currency. When trading there is also something known as a spread, this is the rate that you can sell a pair at and the rate at which you can buy it, the difference between these two figures is known as the spread. The final thing to point out is how they are displayed, if the GBP/USD pair is set at 1.31, this simply means that every single pound will be worth $1.31.

You also need to understand that there are different types of currency pairs, we very briefly mentioned them as the majors, minors, and exotic pairs. The defining features of the major currency pairs are that they include the US Dollar in them, examples of these major pairs include EUR/USD and USD/CHF. So this would mean that the currency pairs that do not include the USD are not majors, instead, they are known as minor pairs or crosses. They do however contain one of the world’s leading currencies such as NZD/JPY, GBP/AUD, and EUR/CAD. The final set of pairs are the exotic pairs, these often come from emerging economies around the world. They are often the least traded pairs but also some of the most volatile, some of these currencies include the Thai Baht, the Polish Zloty, and the Emirati Dirham.

So what are the most popular trading pairs available?

EUR / USD: The EUR/USD pair is the most well known and also the most popular pair to trade, it consists of the Euro as the base pair and the US Dollar as the quoted pair. It is also the most liquid currency pair available and also one of the most stable, yet it is still incredibly profitable to trade on, the spreads of this pair are also often the lowest of all the currency pairs.

USD / JPY: Another one of the most traded currency pairs traded on the markets and is also known for having its low spreads. The JPY is seen as a safe haven when the markets are in a time of uncertainty.

GBP / USD: The GBP and the USD are both among the most popular currencies and so this currency pair is also one of the most popular and profitable for traders to trade. This pair is normally quite stable, however with recent world events such as Brexit, the volatility has increased, but it remains incredibly popular to trade.

USD / CAD: There is a strong commodities link between the United States and Canada, this currency pair also has a strong link. This pair is known as the Loonie and as the Canadian dollar is linked to the export and prices of oil and grain, these commodities can influence this currency pair.

AUD / USD: The Australian dollar relies heavily on the export of the country’s gold pricing, due to this the AUD/USD currency pair can be influenced by the price of gold. This is yet another very popular trading pair.

USD / CHF: Yet another very profitable pair, the swiss franc is another currency that is seen as a safe haven, due to this the volatility is generally a little lower, yet this currency pair is still incredibly popular.

NZD / USD: The NZD/USD currency pair is another popular one, New Zealand has a strong agricultural influence around the world and so this pair relies heavily on the agricultural output and is an incredibly popular pair to trade.

EUR / GBP: This is again one of the most popular currency pairs to trade around the world due to both currencies being very popular. The Euro is used in many countries around the world making it popular to trade, normally quite a stable pair, this pair has been rocked with increased volatility due to the ongoing uncertainty around Brexit.

USD / HKD: Yet another popular trading pair, in fact, it is ranked as the 11th most traded pair, it can be seen as highly profitable with a lot of potential for smaller moves.

USD / KRW: South Korea has had some very impressive economic growth in local times. It is now the fourth-largest economy in Asia, due to this it now makes up to 2% of all trades that are made in the forex markets, due to its emerging and improving economy, this pair is becoming more and more popular as time goes on.

So those are some of the most popular trading pairs, yet you can’t really do anything with that information if you do not know how to actually trade them, having an understanding of the profitable pairs as well as how to trade them is how you can become a profitable trader. If we take the EUR/USD pair as an example, this pair often allows for a much safer trading experience due to its lower volatility, all that you really need to have when trading this pair is a basic understanding of how the markets work and some basic technical analysis know-how, this pair also often has the lowest spreads available of all currency pairs.

There is, however, absolutely no reason to limit your trading to a single pair, there are in fact over 250 different recognised countries and territories, so there is a lot to choose from when it comes to currency trading. Regardless of whether you chose to trade the majors, minors, or exotic pairs, it is important that you get your forex education done, at least the start of it, get some knowledge for analysing the markets and trade on a demo account to ensure that you are able to successfully trade before putting any real money into the account.

So those are some of the most popular pairs and also a little on what currency pairs actually are. Whichever pair you decide to choose, good luck, but if you are looking for stability combined with the potential for good profits, then go for the ones listed above, others can offer a lot more potential profits, but also a lot more risks.

Categories
Forex Assets

Exploring The Costs Involved While Trading The AUD/HUF Forex Exotic Pair

Introduction

The AUD/HUF pair is an exotic forex pair with the AUD representing the Australian Dollar and the HUF representing the Hungarian Forint. When trading in such an exotic currency pair, forex traders should anticipate higher volatility. The base currency in this pair is the AUD, while the HUF is the quote currency. Hence, the exchange rate of the AUD/HUF represents the amount of HUF that a single AUD can purchase. If the exchange rate of AUD/HUF is 221.51, it means that you can buy 221.51 HUF using 1 AUD.

AUD/HUF Specification

Spread

One of the ways forex brokers earn their revenue is through the spread. This is the difference in value between the price they sell a currency pair to you and the price at which they buy the same pair from you.

The spread for the AUD/HUF pair is – ECN: 22 pips | STP: 27 pips

Fees

For traders with the ECN account, they get charged a fee for opening positions. Note that not all brokers charge this commission. Forex brokers do not charge a fee on STP accounts.

Slippage

Every forex broker has different execution speeds. In times of high volatility, your order may be executed at a price other than the one you requested. This difference is slippage.

Trading Range in the AUD/HUF Pair

The trading range in forex trading is used to analyse the fluctuation in the price of a currency pair across multiple timeframes. The volatility, as measured with the trading range, is pips from the minimum, average, to the maximum for all timeframes. With this information, you can deduce the most profitable timeframes to trade.

The Procedure to assess Pip Ranges

  1. Add the ATR indicator to your chart
  2. Set the period to 1
  3. Add a 200-period SMA to this indicator
  4. Shrink the chart so you can determine a larger period
  5. Select your desired timeframe
  6. Measure the floor level and set this value as the min
  7. Measure the level of the 200-period SMA and set this as the average
  8. Measure the peak levels and set this as Max.

AUD/HUF Cost as a Percentage of the Trading Range

Now that we’ve established the volatility,  we can proceed to calculate the trading costs incurred when trading these timeframes. The trading cost is expressed as a percentage of total costs to the volatility.

Below are the trading costs of the AUD/HUF pair for both ECN and STP accounts.

ECN Model Account costs

Spread = 22 | Slippage = 2 | Trading fee = 1

Total cost = 25

STP Model Account

Spread = 27 | Slippage = 2 | Trading fee = 0

Total cost = 29

The Ideal Timeframe to Trade  AUD/HUF Pair

From the above analyses, we can see that the trading cost of the AUD/HUF pair decreases with an increase in volatility. Since the volatility also increases with the timeframe, trading the AUD/HUF over longer timeframes incurs lower costs.

Although the lower timeframes have higher trading costs, these costs can be reduced by timing trades when volatility approaches the maximum. Furthermore, slippage costs can be avoided if traders use forex limit order types. With the forex limit orders, trades are executed at precise price points, avoiding the impact of slippage. Let’s look at an example of this using the ECN account.

ECN Account Using Limit Model Account

Total cost = Slippage + Spread + Trading fee

= 0 + 22 + 1 = 23

Notice that the trading costs have been reduced in all timeframes. For example, the highest cost has been lowered from 423.73% to 389.83%.

Categories
Forex Assets

Little Known Facts About the Connection Between Crude Oil and Forex

Just as it is possible to use the movements of the Crude Oil market to identify trends by fundamental analysis or macroeconomics, this information can be very useful in the trading of foreign exchange and other types of Petroleum-related financial assets. In this article, we explain how the interpretation of oil price movements can be useful for a Forex trader when examining the relationship between Crude Oil and Forex markets. 

We will also explain why it would be useful to pay attention to Crude Oil prices in order to formulate a successful foreign exchange trading strategy. For those who want to trade with Crude Oil itself, this asset is offered to operate by many online Forex/CFD brokers.

Oil Price Movement and Forex Trading

Many countries in the world, such as Mexico and Saudi Arabia, depend heavily on their oil exports, especially in terms of budget and overall economic performance of their country. Crude oil is an essential commodity for the functioning of the modern world, so an increase in the price of oil is often related to inflation, economic growth, and the price of other goods, especially prices, Consequently the demand for products made of Petroleum.

The movements of the Crude Oil market are of great importance for the Petroleum producing economies and their derivatives, not only in terms of the formulation of policies but also the forecasting of local economic results. This is also true for the rest of the world, as it is impossible to imagine our current economic system without black gold, so that information can be useful in shaping our expectations with regard to inflation and other macroeconomic factors.

Oil Price Movements and Exchange Rates

We have already mentioned that there are countries that depend heavily on their oil exports. This is important not only because a bad year in the oil markets could affect the economic performance of these countries, but also because oil prices and quantity variations often affect the exchange rate of these countries.

Take Canada as an example. Like many other countries, Canada is highly dependent on its exports to the rest of the world, but as one of the world’s leading oil producers, You should not be surprised that Crude Oil is the main source of Canada’s total foreign exchange earnings, especially because Crude Oil is traded in US Dollars.

Movements in the price of crude oil and exchange rates. In other words, an increase in the price of crude oil (assuming constant demand) often means an increase in the supply of US Dollars in the Canadian economy. This tends to drive the exchange rate down, as Canadian dollars would now be relatively scarcer compared to the number of green dollars currently circulating in the economy. The opposite, of course, is also true: the fall in oil prices means that Canada will receive fewer dollars per barrel, which implies a lower offer of US Dollars in the economy and an increase in the exchange rate, given the relative shortage of US dollars.

As a merchant, there are ways to take advantage of Oil’s price movements by trading Crude Oil currency pairs, especially if you are reluctant or unable to trade directly with Crude Oil.

An “Oil Pair” in Forex is USD/CAD since the Canadian Dollar is the largest substitute for Oil in the global Forex market. This pair tends to increase in value when the Oil market is in decline and decreases in value when the market skyrockets, meaning that it may be possible to formulate a strategy to operate this pair based on the movements of the Oil market price.

Other currencies benefit from a positive correlation with Crude Oil, such as the Norwegian Crown and the Russian Rouble; however, these tend to have low liquidity, which means that it may be more difficult to take advantage of the relationship between these currencies and Crude Oil, at least compared to other Forex correlations. This means that trading with oil currency pairs like USD/NOK or USD/RUB can be more difficult, at least compared to other Forex “oil pairs” that tend to be more liquid, such as USD/MXN or USD/CAD.

As for the prices of crude oil and the value of the American Dollar relative to other currencies, there used to be an inverse relationship between them, but that has changed over time. The inverse relationship was especially true when the United States was considered as a net importer of petroleum, but the situation has changed significantly in the last decade since the United States became a major supplier of oil and a major influence on world crude oil prices. Now the correlation tends to be positive, although it should be noted that this has been anything but constant over time.

Oil Price Movements and Fundamental Analysis

Just as crude oil prices can influence foreign exchange rates, they can also affect the fundamentals that play a role in the valuation of some currencies. As we said, there are countries that depend heavily on their oil exports, for example, Mexico, Norway, and Venezuela. Because of this, unfavourable oil price movements affect the perceptions of traders and investors about the intrinsic value of their currencies. For this reason, it should not be a surprise to see traders fleeing from currencies like the Mexican peso into “safer assets” when oil prices collapse.

The opposite is also true. Rising oil prices could favor certain currencies. For example, because of Mexico’s vast oil reserves, positive movements in the price of crude oil tend to favour the performance of the Mexican Peso. Oil and Analysis Fundamentally, this correlation is not perfect, especially because there are other factors that could affect the fundamental evaluation of any currency, regardless of the country’s dependence on oil markets.

An example of this, at least in the long term, is the performance of the Norwegian Crown. As we know, Norway is a major energy producer, since oil accounts for about 62% of its exports. However, the correlation of this currency with the price of crude oil is very volatile and tends to be lower when oil markets recover. This has led some analysts to believe that, although positive price movements favour the Norwegian economy, the relationship between the performance of the Norwegian Krone and the price of Brent crude oil in the neighbouring North Sea is not very clear.

In any case, there seems to be a stronger correlation when the price of crude oil is falling, so it may be possible to benefit from this positive Forex correlation when the oil market collapses.

Crude Oil and Other Assets

As it is possible to trade Forex currency pairs based on Crude Oil price movements, traders can also take advantage of the relationship between the movements of the Oil market and other assets, particularly other commodities. There is, for example, a well-known (though not statistically constant) correlation between the price of crude oil and the price of gold. As an essential commodity, the increase in crude oil prices tends to increase inflationary pressures worldwide, so when oil prices skyrocket, this tends to increase inflation in the long run.

Gold is a well-known “safe haven value” against inflation and times of crisis, so should come as no surprise to see traders rushing toward this precious metal when they fear the continued depreciation of the world’s major currencies. Silver and other precious metals tend to have a very positive correlation with gold, so there may be an opportunity to take advantage of other Forex correlations.

On the other hand, falling oil prices tend to exert downward pressure on inflationary trends, which tends to hinder optimism about United States treasury yields. Oil prices also greatly influence global economic performance, so when crude oil prices rise too high, this tends to hamper economic growth, causing traders to rush to alternative assets such as gold. The gold supply chains themselves are also strongly influenced by what happens in the oil markets. Oil is widely used in gold mining, so rising oil prices tend to affect the margins of gold mines, affecting the supply of metal.

Another asset that has a well-known, albeit difficult, relationship with Crude Oil is natural gas. Historically, both commodities have moved together, as they were often positively correlated, but this relationship has changed significantly over the past decade.

Crude Oil Prices and the Foreign Exchange Market: Trading Opportunities

Abrupt market movements can be an opportunity to trade in currencies and other financial assets that have a positive (or even negative) correlation with Crude Oil. This means that a stock market crash may present an opportunity to sell energy shares, or to be long in the popular Crude Oil currency pairs like USD/CAD and safe-haven assets like gold.

On the contrary, a positive outlook for the stock market may be an opportunity to short the currency pairs of Crude Oil, or to be long in commodities that tend to have a positive correlation with the price of Crude Oil.

Categories
Forex Assets

Costs Involved While Trading The AUD/PHP Forex Exotic Pair

Introduction

In this exotic forex pair, the AUD is the Australian Dollar, and the PHP is the Philippine Peso. Note that trading with such exotic pairs is accompanied by periods of high volatility compared to major forex pairs. The AUD is the base currency, while the PHP is the quote currency. Therefore, in forex trading, the price of the AUD/PHP represents the amount of PHP you can purchase using 1AUD. Say that the price of AUD/PHP is 34.057. It means that with 1 AUD, you can buy 34.057 PHP.

AUD/PHP Specification

Spread

In the forex market, when going long, you buy a currency pair from the broker at a “bid” price. When you go short, you sell the currency pair to the broker at the “ask” price. The difference between the two prices is the spread.

The spread for the AUD/PHP pair is – ECN: 10 pips | STP: 15 pips

Fees

Forex traders using ECN type accounts get charged a trading fee by their brokers depending on the size of their position. STP type accounts rarely attract any trading fees from the brokers.

Slippage

If you have ever opened a trade during periods of increased volatility, you will notice that your order price differs from the execution price. This difference is slippage. It can also be caused when your broker is slow to execute your order.

Trading Range in the AUD/PHP Pair

The trading range refers to the analysis of the fluctuation of a currency pair over various timeframes. With the trading range, we can determine volatilities from minimum to the maximum across all timeframes. This information will be useful in deciding profitability across these timeframes.

The Procedure to assess Pip Ranges

  1. Add the ATR indicator to your chart
  2. Set the period to 1
  3. Add a 200-period SMA to this indicator
  4. Shrink the chart so you can determine a larger period
  5. Select your desired timeframe
  6. Measure the floor level and set this value as the min
  7. Measure the level of the 200-period SMA and set this as the average
  8. Measure the peak levels and set this as Max.

AUD/PHP Cost as a Percentage of the Trading Range

The percentage of the trading range is when we take the total costs associated with trading a particular pair and express it as a percentage of the volatility. Below are the percentage of the trading range for ECN and STP accounts.

ECN Model Account costs

Spread = 10 | Slippage = 2 | Trading fee = 1

Total cost = 13

STP Model Account

Spread = 15 | Slippage = 2 | Trading fee = 0

Total cost = 17

The Ideal Timeframe to Trade  AUD/PHP Pair

We can observe from the above analyses that longer timeframes produce higher volatilities. More so, as the volatility increases, the trading costs decrease. Therefore, shorter-term traders of the AUD/PHP pair experience higher trading costs than longer-term traders.

However, trading costs can be reduced if traders were to open their positions when the volatility is approaching the maximum. Notice that across all timeframes, the trading costs are lower when volatility changes towards the maximum. Furthermore, using forex limit order types can be used to lower trading costs. Such order types eliminate the slippage costs. Here’s a demonstration.

ECN Account Using Limit Model Account

Total cost = Slippage + Spread + Trading fee

= 0 + 10 + 1 = 11

By getting rid of the slippage costs, we have effectively lowered trading costs across all timeframes.

Categories
Forex Assets

AUD/TWD – What Should You Know Before Trading This Exotic Pair

Introduction

The AUD/TWD is an exotic currency pair with the AUD representing the Australian Dollar, and the TWD is the Taiwan Dollar. Such exotic pairs experience high volatility in the forex market. In this pair, the AUD is the base currency, while the TWD is the quote currency. That means that the exchange rate of the AUD/TWD is the amount of TWD that can be bought by 1 AUD. If the exchange rate of the AUD/TWD pair is 20.091, it means that you can exchange 20.091 TWD for 1 AUD.

AUD/TWD Specification

Spread

The spread in forex trading represents the difference between the price at which you can buy a currency pair when going long and the price at which you can sell the pair when going short. The spread for the AUD/TWD pair is – ECN: 24 pips | STP: 29 pips

Fees

Holders of ECN type accounts are typically charged a fee for every position they open. This fee depends on the size of the positions and the broker. Traders with STP accounts usually don’t get charged trading fees.

Slippage

If your broker delays executing your trade or if the market is highly volatile, you will notice a difference between the price you placed on your order and the execution price. This difference is slippage.

Trading Range in the AUD/TWD Pair

When trading forex, you will notice that a currency pair fluctuates over time. The trading range shows the minimum, average, and maximum variation in pips over different timeframes. By analysis of the trading range, we can determine the potential profit from trading a particular pair across various timeframes.

The Procedure to assess Pip Ranges

  1. Add the ATR indicator to your chart
  2. Set the period to 1
  3. Add a 200-period SMA to this indicator
  4. Shrink the chart so you can determine a larger period
  5. Select your desired timeframe
  6. Measure the floor level and set this value as the min
  7. Measure the level of the 200-period SMA and set this as the average
  8. Measure the peak levels and set this as Max.

AUD/TWD Cost as a Percentage of the Trading Range

To establish the Percentage of the trading range for CAD/TWD, we will express the total trading costs for both ECN and STP accounts as a percentage of the trading range above. This analysis will show us the true costs of trading the AUD/TWD pair across different timeframes, which will aid in determining the best timeframe to trade.

ECN Model Account costs

Spread = 24 | Slippage = 2 | Trading fee = 1 | Total cost = 27

STP Model Account

Spread = 29 | Slippage = 2 | Trading fee = 0 | Total cost = 31

The Ideal Timeframe to Trade  AUD/TWD Pair

From this analysis, we can tell that as the timeframe becomes longer, the trading costs become lower. For both accounts, the highest trading costs are at the 1H timeframe, which coincides with the lowest volatility of 2.7 pips. The lowest trading costs are at the 1-month timeframe coinciding with when volatility is highest at 256.8 pips.

Overall, we can also notice that the trading costs reduce when volatility changes from minimum to maximum across all timeframes. Therefore, traders of the AUD/TWD pair can reduce their trading costs by trading longer timeframes or trading when volatility approaches maximum. Furthermore, using forex limit order types can remove slippage costs.

Here’s an example.

ECN Account Using Limit Model Account

Total cost = Slippage + Spread + Trading fee

= 0 + 24 + 1 = 25

When the slippage costs are eliminated, the trading costs for the AUD/TWD pair drop. In this case, the highest cost dropped from 457.63% to 423.73%.

Categories
Forex Assets

AUD/ZAR – Analysing The Costs Involved While Trading This Forex Exotic Pair

Introduction

The AUD/ZAR is an exotic currency pair in the forex market. AUD is the Australian Dollar while ZAR is the South African Rand. Trading the AUD/ZAR pair is expected to attract higher volatility than trading major forex currency pairs.

The AUD is the base currency in this exotic pair, while the ZAR is the quote currency. It means that the price associated with the AUD/ZAR pair represents the amount of ZAR that you can buy with 1 AUD. Let’s say that the price of AUD/ZAR is 11.5077; it means that with 1 AUD, you can buy 11.5077 ZAR.

AUD/ZAR Specification

Spread

At any given moment, forex brokers display the “bid” and “ask” price, which represents the price at which you can buy or sell a currency pair. The spread is the difference between these two. The spread for the AUD/ZAR pair is – ECN: 7 pips | STP: 12 pips

Fees

Forex traders with ECN type accounts can sometimes be charged commissions by their forex brokers whenever they open a position. The fees vary with the broker and the size of the position. STP accounts are typically not charged commissions.

Slippage

The price at which we place our trades isn’t always the price at which the broker executes these trades. The difference between the two prices is called slippage in forex trading. It can be because of extreme market volatility or broker inefficiency.

Trading Range in the AUD/ZAR Pair

The trading range refers to the pip movement of a currency pair throughout a trading day. The pip movement can be analyzed across different timeframes to determine the volatility of the pair.

The Procedure to assess Pip Ranges

  1. Add the ATR indicator to your chart
  2. Set the period to 1
  3. Add a 200-period SMA to this indicator
  4. Shrink the chart so you can determine a larger period
  5. Select your desired timeframe
  6. Measure the floor level and set this value as the min
  7. Measure the level of the 200-period SMA and set this as the average
  8. Measure the peak levels and set this as Max.

AUD/ZAR Cost as a Percentage of the Trading Range

We can compare the total cost of trading a particular currency pair alongside the volatility of that pair. This will help us determine the total trading costs of the pair across different timeframes and find out the optimal trading periods.

ECN Model Account Cost

Spread = 7 | Slippage = 2 | Trading fee = 1 | Total = 10

STP Model Account Cost

Spread = 12 | Slippage = 2 | Trading fee = 0 | Total cost = 14

The Ideal Timeframe to Trade the AUD/ZAR

From the analysis of the trading range and the costs in terms of Percentage, we notice that low volatilities attract the highest costs. Since lower timeframes have the least volatilities, it means that trading costs are higher in lower timeframes.

We can say that the ideal timeframe to trade the AUD/ZAR pair is when the volatility is approaching the ‘Maximum”. Traders interested in this pair can also choose to use forex pending orders instead of market orders. With pending orders, you get to eliminate the costs associated with slippage.

Here’s an example with the ECN account when slippage is 0.

Total cost = Slippage + Spread + Trading fee = 0 + 7 + 1 = 8

Eliminating the slippage cost has helped reduce the trading costs of the AUD/ZAR pair across all timeframes. The highest cost in the ECN type account has been reduced from 169.49% to 135.59%.

Categories
Forex Assets

The Untold Story on VXX Trading That You Must Read or Be Left Out

For years we have had many interesting products which have allowed us to operate all kinds of volatility assets, even if they were comparatively young products. Understanding these products well has always required a little study time. On the other hand, improper management of these products could lead to increased risk, so traders should know exactly what they are doing.

So, think and test your strategies beforehand and fake everything you can into a demo account before using real money. The VXX, which we will analyze in this section, is by far the most volatile product with nearly $1 billion of assets under management. It is presented as a structured fund (TNC) and has a total expenditure of 0.89% per year.

The VXX can be marketed as a share and is also the underlying of a number of options. The product has existed since 2009 and since then has generated one of the most impressive charts among any of the financial instruments. As we noted, it is obvious that this product should not be considered in any way as a long-term investment, but as a bargaining and hedging instrument.

The decisive factor is that the VXX is not directly related to VIX, but to VIX futures. In previous articles, we have already presented in detail the fact that the movements of these instruments may deviate from each other in some cases. The configuration of the loss limit also depends on account size and personal risk, as well as money management.

Long or Short?

Given the obvious downward trend, the question arises as to why someone wants to go long for a long time. Additionally, it wouldn’t be more affordable for you to cut short a lot of times? The objective of long positions is to benefit from strong increases in volatility, which can multiply the value of the VXX in a very short time.

Since such increases in stock market volatility are accompanied by crashing, we will have effective coverage against price losses. However, this type of coverage becomes quite costly over time, as sufficiently strong volatility increases occur more rarely and the VXX slowly but steadily loses value the rest of the time.

The objective of short positions is the opposite: If there is not a sharp increase in volatility, the VXX decreases in value slowly but steadily, so we accumulate profits if we have a short position.

The problem is this: While the losses are theoretically unlimited in an increase in volatility, as the price can go up to very high, the gains are always below 100%. In addition, the exposure decreases with the fall in prices, so, in absolute terms, we will have less and less profit. Similarly, in the case of making a profit, new short positions would have to be taken in order to keep the initial risk constant. And we haven’t even said that it can be difficult to find a broker who can easily allow us to take short positions in the VXX. Strong increases in volatility can multiply the value of VXX in a very short time.

  • Where do the losses come from?
  • Could the VXX cause large losses?

To do this you must first take a closer look at its construction. The VXX is composed of a combination of VIX futures contracts in different periods, before and after, whose units depend on the maturity of the contracts. This composition changes

daily at the expiration of a small part of the previous month and purchase contracts for the following month. In particular, a separate index is constructed for this purpose (symbol: SPVXSTR), which is mapped to the VXX. It is very important to warn that these changes are made on the basis of a neutral strategic design so that the VXX does not lose value because during a contango situation – in which the lowest value futures are sold and the highest value futures are bought.

The real cause of the long-term price decline is the so-called contango loss. Which describes the predominant deviation of the curve forward to the lowest VIX. Because if these low VIX values persist until the end of the respective front contract, the final settlement will occur at that level. Let’s take an example, consider the following situation of a steep contango:

  • Current VIX: 15 %
  • Future of current month VIX: 18 %
  • Future of next month’s VIX: 20 %

If VIX remains at a low level until futures expire, the value will be lost continuously. Assuming that the VIX is maintained at 15 % until its maturity in the current month as well as in the future, then the losses will amount to 17 or 25 %. Although the structure of the container is rarely so pronounced, losses accumulate continuously as long as there is no significant increase in the volatility or reversal of the feed curve. Because contango prevails, the VXX will lose its long-term value. Certainly, everything becomes evident at the time we realize that, since 2012, the VXX has received around $6.5 billion, according to the money flow tool of www.ETF.com.

At the same time, we could say that a fortune of just under a billion US dollars is invested in the VXX. This means that around $5.5 billion of assets have been lost in the last 6.5 years. Vance Harwood adds another interesting aspect: If the issuer Barclays Capital were not fully covered, but for example only 90%, it would mean that we would get a good additional income of up to $550 million in addition to the management fee during this period.

Conclusion

VXX is a fascinating product with an unmistakable long-term trend. Despite this, and as is obvious, it is surprisingly difficult and very risky to try to make long-term gains with this product. While the long positions will often fight against the weight of the contango, for the short positions, the sword of Damocles hovers before a rapid and sharp increase of volatility and always on the slow gains that otherwise would be quite regular.

Categories
Forex Assets

Trading Costs Involved While Trading The AUD/PKR Forex Exotic Pair

Introduction

In this exotic, AUD is the Australian Dollar, and PKR is the Pakistani Rupee. Trading exotic currency pairs can be highly volatile compared to major currency pairs. The AUD is the base currency, and the PKR is the quote currency. That implies that the exchange rate of the AUD/PKR is the number of Pakistani Rupees that a single Australian Dollar can buy. Thus, if the exchange of AUD/PKR is 112.584, it means that with 1 AUD, you can buy 112.584 PKR.

AUD/PKR Specification

Spread

The spread in forex trading represents the value difference between the buying price of a currency pair and its selling price. These prices are referred to as “bid” and “ask.” The spread for the AUD/PKR pair is – ECN: 32 pips | STP: 37 pips

Fees

Some forex brokers charge a fee whenever a trader opens a position. The fee is not standardized and depends on the broker and the size of the trade. Note that STP accounts normally don’t attract broker fees.

Slippage

Whether long or short, when you open a position, it can be executed at a different price than what you requested. This price difference is called slippage in the forex market and is a direct result of extreme volatility or broker delays.

Trading Range in the AUD/PKR Pair

If you observed a currency pair’s price movement, you’d notice the difference in price changes across different timeframes. That is the trading range and is used to determine the volatility of a pair.

The Procedure to assess Pip Ranges

  1. Add the ATR indicator to your chart
  2. Set the period to 1
  3. Add a 200-period SMA to this indicator
  4. Shrink the chart so you can determine a larger period
  5. Select your desired timeframe
  6. Measure the floor level and set this value as the min
  7. Measure the level of the 200-period SMA and set this as the average
  8. Measure the peak levels and set this as Max.

AUD/PKR Cost as a Percentage of the Trading Range

When you combine the total trading costs of a currency pair, you can analyze the percentage costs across different timeframes. This analysis can help you determine the best time to trade a currency pair.

ECN Model Account Cost

Spread = 32 | Slippage = 2 | Trading fee = 1 | Total = 35

STP Model Account Cost

Spread = 37 | Slippage = 2 | Trading fee = 0 | Total cost = 39

The Ideal Timeframe to Trade the AUD/PKR

As seen above, trading the AUD/PKR pair on shorter timeframes is costlier. In both the ECN and the STP accounts, it is cheaper trading the pair over longer timeframes since the trading costs are lower. Note that the trading costs decrease with an increase in volatility. The lowest trading cost for the AUD/PKR pair is when volatility is at the highest 852.4 pips.

The ideal trading time is evidently on the longer timeframes. But shorter-term traders can open positions when volatility is maximum across 1H, 2H, 4H. and 1D timeframes. Traders can also employ the use of forex pending order types, which eliminate the cost of slippage. Here’s an example with the ECN account.

Total cost = Slippage + Spread + Trading fee = 0 + 32+ 1 = 33

Notice how the trading costs have been reduced across all timeframes when forex pending orders are used. The maximum cost, for example, has reduced from 593.22% to 559.32%.

Categories
Forex Assets

Costs Involved While Trading The AUD/RUB Forex Exotic Pair

Introduction

AUD is the Australian Dollar, and RUB is the Russian Ruble; AUD/RUB is thus an exotic currency pair. When trading this pair, forex traders should expect relatively high volatility due to its exotic nature.

In this pair, the AUD is the base currency, and the RUB is the quote currency. It means that the AUD/RUB pair’s price represents the amount of Russian Ruble that one Australian Dollar. If the AUD/RUB price is 55.813, it means that you can buy 55.813 Russian Rubles using 1 Australian Dollar.

AUD/RUB Specification

Spread

For the AUD/RUB pair, the spread is the difference between the price at which you can buy the pair from a broker and the price at which you can sell it to the broker.

The spread for the AUD/RUB pair is:

ECN: 10 pips | STP: 15 pips

Fees

If you have an ECN account, different brokers will charge you varying fees per trade, depending on the size of your position. For most STP accounts, however, there are no fees levied whenever you open a position.

Slippage

In the forex market, slippage occurs when you open a position, but it is executed at a price different than the one you requested. The primary determinants of slippage are market volatility and your broker’s speed of execution.

Trading Range in the AUD/RUB Pair

Throughout the day, the price of a currency pair fluctuates. This fluctuation, as observed from different timeframes, is known as the trading range. In forex, the trading range can help a trader determine the volatility of a currency pair, hence assess the risks it carries.

The Procedure to assess Pip Ranges

  1. Add the ATR indicator to your chart
  2. Set the period to 1
  3. Add a 200-period SMA to this indicator
  4. Shrink the chart so you can determine a larger period
  5. Select your desired timeframe
  6. Measure the floor level and set this value as the min
  7. Measure the level of the 200-period SMA and set this as the average
  8. Measure the peak levels and set this as Max.

AUD/RUB Cost as a Percentage of the Trading Range

We can combine volatility, slippage, and trading fees to determine the cost of trading a currency pair across different timeframes.

Below are cost percentages for both the ECN and the STP forex accounts. These percentages are in terms of pips.

ECN Model Account

Spread = 10 | Slippage = 2 | Trading fee = 1

Total cost = 13

STP Model Account

Spread = 15 | Slippage = 2 | Trading fee = 0

Total cost = 17

The Ideal Timeframe to Trade the AUD/RUB

In the analyses above, we notice that lower timeframes have low volatility, accompanied by higher trading costs for the AUD/RUB pair. With either the ECN or the STP account, costs are highest when volatility is at the lowest, 3.1 pips. The lowest costs are incurred when volatility is the highest at 802.2 pips.

We can observe that longer-term traders generally enjoy lower trading costs. However, shorter-term traders can reduce their trading costs by trading the AUD/RUB pair when volatility is above average; since costs are lower.

If traders use pending orders, they can eliminate slippage, which lowers the trading costs. Here’s an example with the ECN account.

Total cost = Slippage + Spread + Trading fee

= 0 + 10 + 1 = 11

You can notice that there is a significant reduction in trading costs. For example, the highest trading cost for the ECN account has reduced from 220.34% to 186.44%.

Categories
Forex Assets

Trading The AUD/INR Forex Exotic Pair & Analysing The Costs Involved

Introduction

AUD/INR is an exotic currency pair in the forex market, with the AUD representing the Australian Dollar and the INR representing the Indian Rupee. Here, the AUD is the base currency, and the INR is the quote currency. That means that the AUD/INR price represents the amount of INR which 1AUD can buy. For example, let’s say that the price of the AUD/INR is 52.2654. It means that 1 AUD can buy 52.2654 INR.

AUD/INR Specification

Spread

When you go long in forex trading, you have to buy the currency pair from your forex broker. Now, if you decide to sell back the pair to the broker, they will buy it at a lower price than they sold to you. The difference between these two prices – also known as “bid” and “ask” – is the spread.

The spread for the AUD/INR pair is:

ECN: 20 pips | STP: 25 pips

Fees

Some brokers charge a commission for positions opened using ECN accounts. They vary depending on the size of the trade. STP accounts are rarely charged any trading fees.

Slippage

Slippage in Forex is the difference between the execution price of a market order and the price at which that order was placed. The slippage comes about due to increased market volatility or inefficiency on the part of your broker.

Trading Range in the AUD/INR Pair

When a currency pair fluctuates, its volatility varies across different timeframes. The analysis of this volatility in different timeframes is done using the trading range. It can help the trader identify the most suitable timeframes for a particular currency pair.

The trading range is expressed in pips. It shows the value of pips you stand to gain or lose on various timeframes.

The Procedure to assess Pip Ranges

  1. Add the ATR indicator to your chart.
  2. Set the period to 1
  3. Add a 200-period SMA to this indicator
  4. Shrink the chart so you can determine a larger period
  5. Select your desired timeframe
  6. Measure the floor level and set this value as the min
  7. Measure the level of the 200-period SMA and set this as the average
  8. Measure the peak levels and set this as Max.

AUD/INR Cost as a Percentage of the Trading Range

Expressing the total trading costs of a currency pair as a percentage of the trading range helps to understand the trading costs that pair on multiple timeframes. It shows how the trading costs change with volatility.

Below are the trading costs for the AUD/INR  pair on ECN and STP accounts.

ECN Model Account Costs

Spread = 20 | Slippage = 2 | Trading fee = 1

Total cost = 23

STP Model Account

Spread = 25 | Slippage = 2 | Trading fee = 0

Total cost = 27

The Ideal Timeframe to Trade AUD/INR Pair

From the above analyses, we can observe that the lowest trading costs of the AUD/INR pair are on longer timeframes. The lowest trading costs for both the ECN and the STP accounts are when the AUD/INR volatility is at the highest – 518.3 pips. While the shorter timeframes have higher trading costs, intraday traders can take advantage of the maximum volatility periods during these timeframes.

Furthermore, traders can reduce the trading costs by implementing forex limit orders instead of market orders, which are prone to slippages. Here is an example of how the limit orders remove the slippage costs.

ECN Account Using Limit Model Account

Total cost = Slippage + Spread + Trading fee

= 0 + 20 + 1 = 21

You can notice that the forex limit orders lowers the overall costs by making the slippage cost 0. In this scenario, the highest trading cost has been reduced from 389.83% to 355.93%.

Categories
Forex Assets

Exploring The Costs Involved While Trading The AUD/KRW Exotic Pair

Introduction

The AUD/KRW is an exotic currency pair where AUD is the Australian Dollar, and KRW is the South Korean Won. This article will cover some of the essential elements of the AUD/KRW pair that you should know before you start trading this exotic pair.

The AUD is the base currency, and the KRW is the quote currency in this pair. Hence, the pair’s price represents the amount of KRW that can be bought using 1 AUD. For example, say the price of AUD/KRW is 795.89, it means that for every 1 AUD, you can buy 795.89 KRW.

AUD/KRW Specification

Spread

In forex trading, your broker will sell a currency pair to you at a higher price than the one they will buy from you if you sold it back to them. These prices are “bid” and “ask,” and the difference between them is the spread. The spread for the AUD/KRW pair is:

ECN: 21 pips | STP: 26 pips

Fees

STP type accounts incur no trade commissions. For the ECN accounts, the fees charged depend on your broker and the size of your position.

Slippage

When placing a forex market order with your broker, that order might be executed at a different price. The difference is slippage and is due to higher volatilities or execution delays by the broker.

Trading Range in the AUD/KRW Pair

The trading in forex aims to show the trader how a currency pair fluctuates across multiple timeframes. This analysis is used to determine volatility associated with the pair.

If. For example, the trading range of the AUD/KRW across the 4H timeframe is ten pips; it means that a trader can expect to gain or lose  AUD 12.6; since the value of 1 pip is AUD 1.26.

Here’s the trading range of the AUD/KRW  across multiple timeframes.

The Procedure to assess Pip Ranges

  1. Add the ATR indicator to your chart.
  2. Set the period to 1
  3. Add a 200-period SMA to this indicator.
  4. Shrink the chart so you can determine a larger period
  5. Select your desired timeframe
  6. Measure the floor level and set this value as the min
  7. Measure the level of the 200-period SMA and set this as the average
  8. Measure the peak levels and set this as Max.

AUD/KRW Cost as a Percentage of the Trading Range

Here, we calculate the total trading costs that a trader can incur trading the AUD/KRW across different timeframes under different volatility.

The trading cost is expressed as a percentage of the volatility, which is in pips.

ECN Model Account Costs

Spread = 21 | Slippage = 2 | Trading fee = 1

Total cost = 24

STP Model Account

Spread = 26 | Slippage = 2 | Trading fee = 0

Total cost = 28

The Ideal Timeframe to Trade AUD/KRW Pair

From the above analyses, we can observe that the highest costs in both the ECN and the STP accounts are incurred at the 1H timeframe when volatility is at the minimum 58 pips. Although the trading costs decline as the timeframe becomes longer, you can notice that the costs are lower when volatility is at the maximum across all timeframes. Therefore, for intraday traders trading the AUD/KRW pair when volatility approaches, the maximum will help lower the costs.

Using the forex limit order types can also help to reduce the overall costs since it eliminates the risks of slippage encountered in market orders. Here’s an example.

ECN Account Using Limit Model Account

Total cost = Slippage + Spread + Trading fee

= 0 + 21 + 1 = 22

Notice how the overall trading costs have been lowered in all timeframes. When volatility is at the minimum at the 1H timeframe, the highest trading cost has declined from 406.78% to 372.88%.

Categories
Forex Assets

The Fundamentals of the Canadian Dollar (CAD)

The Canadian dollar, which is also known as the CAD, may not date back long in time like some other currencies (e.g. the British pound), yet its history is equally fascinating. Although the CAD is relatively young, it is now believed to be the seventh most traded currency in the world. Back in 1941, an important decision was made in the Province of Canada, a then-new British colony in North America, to make their currency a one-tenth value of the United States’ Golden Eagle $10 coin. This change meant that the two currencies were connected more tightly and that the value of the CAD depended on the worth of the USD. As Canada did not have a central bank for some time, the printing of money was a duty performed by several private banks.

As Canada kept growing, new Canadian territories slowly started to adopt the CAD – Nova Scotia in 1871 and Newfoundland in 1949. The currency was pegged to the USD quite a few times throughout history: 1841—1933, 1940—1950, and 1962—1970. Despite the peg, Canada always demonstrated the air of independence, and this was particularly noticeable during the Great Depression when the Canadian government decided to move towards having their own monetary policy and central bank. Hoping to protect itself from the economic downfall that was particularly prominent in the US, Canada was pushed into making their own central banking institution and take over control of their currency. The CAD is nowadays also referred to as a loonie, which is the name of a bird that is printed on the C$1 coin, which incidentally inspired the derivation of the name toonie used for the C$2 coin. Aside from C$, some similar variations that include the dollar symbol are used as well so as to make a difference from other dollar-denominated currencies, notably CA$ and Can$.

Bank of Canada

For almost one entire century, Canada managed to go without a central bank with 10 private banks handling the issuance of the CAD. Nevertheless, the benefit of printing money was never intended for the government of Canada to reap, but the banks alone. One of the biggest banks at the time, the Bank of Montreal, grew to become a more dominant institution that acted as a central bank. This bank was, however, an independent player whose goals were not necessarily aligned with Canada’s needs, especially since there was an overall lack of autonomy and vision. After the Great Depression, Canada became aware of the need to become more separate from the USD, which brought forth the creation of their own central bank.

In 1935, the Canadian government did take necessary action and established the Bank of Canada, which then took on the responsibility of running the currency. The Bank of Canada (BOC) now holds meetings eight times a year to discuss matters pertaining to their goals of maintaining price stability. Unlike other central banks, such as the Federal Open Market Committee (FOMC) in the United States, the BOC has a single mandate, which has proved to be quite limiting for enacting monetary policy. Some other single-mandate central banks, e.g. the European Central Bank (ECB), do not deal with maximizing employment and GDP growth. As the ECB is only concerned with price stability, they are often unable to provide the assistance Europe requires. Canada, however, appears to be handling this issue much better, which could be potentially attributed to its laws.

The CAD Currency Basket

The BOC in fact seems to be acting as a dual-mandate central bank, which has been supported by their actions during some periods of crisis in the past. The new Governor of the Bank of Canada and the Chair of the Board of Directors, Mr. Tiff Macklem, was appointed in June this year, at a rather difficult time when many Canadian citizens and companies requested support in order to withstand the COVID-19 pandemic. Owing to his expertise in financial markets, the new Governor is believed to be able to assist the central bank to weather the current economic crisis. 

Canadian Economy

Canada is one of the largest economies, currently believed to be ranking in the top 10 economies in the world. Canada thrives on oil, mining, and logging, as these are the country’s biggest industries, which make the CAD heavily based on commodities. Canada still has strong ties with the United States, which is also its largest trading partner, and this relationship appears to impact the Canadian economy whenever there are changes in the US. Considering the fact that more than 50% of imports in Canada come from the US, any impediments in the US economy are likely to cause the same slowdown in Canada. In addition to the two economies being so closely intertwined, the CAD acts as the reserved currency for many Caribbean islands. What is more, one can even pay for all goods and services with this currency in some of the islands in this region.  

Major Correlations

Due to the strength of the Canadian economy largely stemming from oil, mining, and logging industries, the CAD has established some of its major correlations with the related commodities. The correlation between the CAD and oil, for example, has always been one of the more prominent ones although its nature and degree keep changing. In the past, traders have witnessed quite a high correlation between the two, which entails that once the oil goes down, so will the CAD during the same period of time. Information concerning such strong correlations can help traders assess the currency and come to an important conclusion that may help their trading. Nonetheless, as we can see from the chart below, these correlations are neither strong nor relevant 100% of the time, so the CAD and oil do not necessarily reveal any similar or dissimilar tendencies at all times. However, due to their historically prominent correlation, traders interested in the CAD should most definitely obtain information on what is currently happening with oil, what some of its previous tendencies were, and where it will likely move in the future.

CAD basket vs. Oil (blue line)

Economic Reports

As the Canadian economy greatly resembles that of the United States, the same reports are going to apply: quarterly GDP reports, monthly employment reports, monthly retail sales, monthly producer and consumer price index (PPI and CPI) as well as a trade deficit. Any trader keen on trading the CAD can potentially rely on its knowledge and understanding of the US economy, as the Canadian economy largely models that of the United States. 

Most Traded Pairs

The most-traded CAD-based crosses include USD/CAD, EUR/CAD, GBP/CAD, and CAD/CHF. In terms of volume and liquidity, the number one currency pair is USD/CAD, which is said to make more than 50% of all CAD transactions. The remaining four currencies fall behind on both volume and liquidity, which is an extremely important piece of information for traders. Understanding the nature of these pairs particularly comes to prominence during some news announcements, which often trigger lighter spreads and greater volatility. The EUR/CAD and GBP/CAD currency pairs both have decent volume, while most other crosses involving the CAD could be considered as more exotic. The AUD/CAD, for example, is an unusual pair primarily due to the vast geographic distance and the low quantity of trade between the two countries, which immediately leads to lower liquidity levels and greater width of the spreads. While trading the CAD, in general as well as in the face of any news events, the safest crosses are believed to be USD/CAD, EUR/CAD, and GBP/CAD.

Most Traded CAD crosses vs. AUD/CAD

Trading the CAD

Due to the fact that the Canadian economy is so heavily reliant on commodities, it is most likely to perform best during economic expansion. Any period of global growth involving a high demand for materials such as copper, steel, oil, etc. is assumed to be bullish for commodity-based currencies. Therefore, the CAD, too, is generally likely to be bullish during economic growth. Although this reaction of the CAD to the rising market may not always be true in 100% of cases, it is going to hold true for the majority of cases. Any time the price of commodities appears to be dropping, traders can ten assume that there is little demand for commodities such as copper, steel, or oil for example. Whenever the economy seems to be in recession, the CAD can be expected to underperform, experiencing difficulties.

In terms of interest rates, at 0.25%, Canada appears to have set neither the highest nor the lowest rates. While placed in the middle at the moment, Canadian interest rates are generally said to vary according to CPI and PPI inflation reports. As the Canadian economy greatly influences the state of commodities, traders can expect any rise in commodities to lead to a rise in inflation in Canada, causing the country’s central bank to increase interest rates. As we discussed before, the price of commodities will also affect the CAD and vice versa. In terms of trade deficits, Canada seems to be doing well in particular due to its large quantity of exports leading to a trade surplus. Currently, Canada plans to keep on offering quantitative easing programs in order to alleviate the impact of the COVID-19 pandemic. Nonetheless, the Canadian economy seems to be recovering, especially after the coronavirus restrictions started to ease although GDP is projected to shrink by 7.8% in 2020.

Central Bank Interest Rates

Recent Trends (until September 2020)

The CAD appears to have exhibited the greatest number of trend changes among all major currencies in the past few weeks. Going steady on the downwards trend line, the CAD broke the pattern through a reversal, followed by a bullish movement for three days straight, with the chart ending in a form of a pull-back. The nature of the continuation of this pullback may bring some lucrative opportunities, for example, should a reversal occur. Some market analysts state that they would prefer going on the upside than going bearish when it comes to the CAD at this time. It is interesting to know that professional traders believe that CAD has one of the best charts at the moment. Preceded by a clear change of trend and quite a few up-and-down movements, we may still not be able to see a true breakout, although the bullish reversal pattern is quite apparent at the end of the chart. This currency has been rather weak for a long period of time, but experts seem to believe that the CAD is finally going to start to go up in the near future. Just this past week, the CAD had a few important news events and economic reports come out, such as the Governor’s speech and the GDP report. Compared to other currencies, the CAD appears to be doing really well at the time, currently placed among the strongest currencies.

Categories
Beginners Forex Education Forex Assets

The World’s Top Forex Currencies

Many Forex traders make the mistake of not thinking about what they are trading beyond price fluctuations on a screen. While it is true in trading that the price is king and also that prices are never too high or low not to be able to rise or fall any more, over time it will work better if it understands what makes the currencies it negotiates unique. Understanding Forex’s major global currencies will make you a better trader, more focused, and more profitable.

What are the World’s Leading Forex Currencies?

There are eight currencies that are the most important in the Forex universe. These are the most important, more or less, according to the consensus:

  • USD (U.S. dollar)
  • EUR (Euro)
  • JPY (Japanese Yen)
  • GBP (British Pound)
  • CAD (Canadian Dollar)
  • CHF (Swiss Franc)
  • AUD (Australian Dollar)
  • NZD (New Zealand Dollar)

In addition, the Chinese yuan (CNY) is becoming increasingly important, although it is not yet fully convertible. There is an onshore Yuan and an offshore Yuan, the last of which is offered for trading by many Forex brokers.

The ranking shown above was not simply ordered by relative GDP or any other economic indicator. Instead, the level of importance given to individual currencies takes into account convertibility, its use as a global reserve, and its correlation with important raw materials. For example, there are several countries, such as India, which have economies much larger than Switzerland or Australia. However, Australia is a major producer of gold and several other raw materials used in manufacturing, while Swiss banks hold a large share of global private capital and especially of gold, which gives their respective currencies a weight that goes beyond the national economies they represent. You must think beyond the plain economic factors to succeed in understanding the major global forex currencies.

Currencies Are National Debt

All modern currencies are backed on paper by nothing more than the nation’s central bank’s promise to meet the obligation. Currencies are 100% debt.

The USD Is The King

The first thing that the trader must take into account in order to understand the main world currencies of Forex is that the USD is of paramount importance. All other currencies are first valued on the basis of their value against the USD. Therefore, you can trade in Forex markets much more easily by simply focusing on the other 7 currencies paired with the USD instead of worrying about every possible crossing, although there are some exceptions.

The importance of the USD is due not only to the large size of the US economy, which is larger than that of any other nation and almost as large as that of the entire eurozone. It is also due to the unique position of the United States as the architect of the global financial system and the world’s only superpower. The dollar is the world’s largest reserve currency, and there is still more cash wealth in USD than in any other currency.

This means that the USD will generally be the main driver of currency market movements. If people around the world want to keep the USD, it will go up and that will tend to weigh in most other currencies and vice versa. In the last 15 years, the USD has had a more predictable and strong trend than any other Forex world currency, which is something that helps to understand the main Forex world currencies.

“Security” and “Risk” Currencies

For various reasons, the market tends to view the following currencies as safe havens, so their relative value tends to increase when there is market turbulence that is caused by fears about global economic prospects: USD, JPY and EUR. The CHF used to be the main security currency, but its role as a safe haven is now considered to be lower due to some unbridled revaluations by the Swiss National Bank and also due to its very high negative interest rate of -0.75%.

Other currencies tend to perform well when there are good prospects for global economic growth. An appreciation of the appetite for risk in the face of risk aversion is a great help in understanding Forex’s major global currencies.

Currencies Related to Commodities

Certain currencies are highly correlated positively with the prices of various raw materials, as these countries are large producers of these raw materials in question. The most important examples are the CAD, which correlates positively with the price of crude oil, and the AUD, which correlates positively with the price of gold. NZD tends to perform well when there is a growing demand for dairy and lamb products.

Liquidity

Most traders will notice that different currency pairs have different “personalities”: some are very volatile and move quickly (a good example is GBP/JPY), while others tend to move in “2 steps forward, 1 step back” mode (the perfect example is the EUR/USD pair). This is due to the liquidity of the respective currencies. There are more euros and dollars than any other currency and this is why their prices tend to move quite slowly. However, when you look at currencies like GBP, JPY, and CHF, there are much smaller amounts involved and, when they are heavily in or out of demand, a liquidity constraint can cause the price to move very quickly.

Time of the Day

In general, currency prices move more during trading hours in London and New York, but also during your local business hours. This means, for example, that the GBP tends to be rather flat during the first part of the Tokyo session, while at that session there will tend to be more activity in Australian and New Zealand dollars, except during before the opening of London and later New York, which overlap to some extent with “domestic” business hours. This is partly due to the fact that currency exchange rates are often moved by economic data publications and central bank publications which, of course, are scheduled during domestic business hours.

While the factors discussed in this article are neither the first nor the only ones that traders will think about, taking this basic information into account can help them to be more flexible and successful in trading certain currencies.

Categories
Forex Course

159. Understanding Forex Assets Classes

Introduction

The forex market is the world’s biggest financial market, where daily turnover is more than 6 trillion dollars. The most exciting feature of the forex market is that it has an enormous number of trading instruments that allow traders to diversify their portfolio. Besides significant currency pairs, cross pairs are very profitable as it can make e decent move.

What is the Currency Pair?

In the stock market, investors’ trade in a particular stock of a company. This is not similar to the currency market. In the forex market, traders usually trade on a currency pair instead of a single currency.

The combination of two currency indicates the economic condition of two separate countries. Therefore, if we want to trade on a currency pair, we should know at least two countries’ economic conditions. For example, if we want to buy EURJPY pair, our analysis should indicate that the European economy will be more durable than the Japanese economy.

Major vs. Cross Currency Pair

US Dollar is the most traded currency in the world. Therefore, any currency pair from the developed country with the US Dollars will represent the major currency pair.

A list of 6 major currency pairs are mentioned below:

  1. EURUSD
  2. GBPUSD
  3. USDJPY
  4. USDCAD
  5. USDCHF
  6. AUDUSD

If we eliminate the USD from these major pairs, we will find the cross currency pairs. Let’s say the value of EURUSD is 1.0850, and the value of AUDUSD is at 0.7150. Therefore, the value of EURAUD would be 1.39 (1/1.085X 1.085/0.7150).

Other examples of Cross currency pairs are EURGBP, EURCAD, GBPCHF, GBPAUD, CADJPY, EURJPY, etc.

The condition for cross currency pairs are-

  • The currency should be from the major pairs.
  • The cross pair should eliminate the US dollar.

Is Cross Currency Pair Trading Profitable?

Trading cross currency pairs is similar to trading major currency pairs as both technical and fundamental analysis work well in cross currency pairs.

For example, we can make a decent profit from the GBPJPY pair if we can evaluate the UK and Japan’s economic condition.

Conclusion

Trading in a currency pairs means to anticipate the price based on the technical or fundamental analysis. Therefore, if we know the two countries’ economic conditions, we can make a decent profit from cross-currency pairs.

[wp_quiz id=”86447″]
Categories
Forex Assets

Analysing The CAD/HUF Forex Currency Pair & Determining The Costs Involved

Introduction

The CAD/HUF is an exotic currency pair where CAD represents the Canadian Dollar, and HUF – the Hungarian Forint. In this article, let’s understand some of the basic concepts you should familiarise with before trading the CAD/HUF pair.

For this currency pair, the CAD is the base currency and the HUF the quote currency. In this case, the price associated with the CAD/HUF pair shows the amount of HUF that 1 CAD can buy. For example, if the price of CAD/HUF is 232.97, it means that 1 CAD can buy 232.97 HUF.

Spread

Spread in the forex market is the difference between buying price, i.e. ‘bid’ and the selling price, i.e. ‘ask.’ The spread for the CAD/HUF is – ECN: 50 pips | STP: 55 pips

Fees

The trading fees you are charged depends on the type of forex account you have. STP accounts carry no trading fee, while for the ECN accounts, the trading fees are determined by your forex broker.

Slippage

In highly volatile trading sessions, sometimes the price at which you trade is different than the price at which that trade will be executed. This difference is called slippage and is usually determined by your broker’s speed of execution.

Trading Range in the CAD/HUF Pair

In the forex market, a currency pair will fluctuate differently across different timeframes. Trading range helps a forex trader analyze how a given pair moves (in terms of pips) over a given timeframe, which is an important risk management tool.

For example, let’s say that during a 1-hour timeframe, the CAD/HUF pair has a trading range of 10 pips. A forex trader trading this pair can expect to gain or lose $43 since the value of 1 pip is $4.3

The table below shows the minimum, average, and maximum volatility of CAD/HUF across different timeframes.

The Procedure to assess Pip Ranges

  1. Add the ATR indicator to your chart.
  2. Set the period to 1
  3. Add a 200-period SMA to this indicator.
  4. Shrink the chart so you can determine a larger period
  5. Select your desired timeframe
  6. Measure the floor level and set this value as the min
  7. Measure the level of the 200-period SMA and set this as the average
  8. Measure the peak levels and set this as Max.

CAD/HUF Cost as a Percentage of the Trading Range

Trading costs that can be expected in forex include slippage, spread, and brokers’ fees. Thus, Total cost = Slippage + Spread + Trading Fee.

Forex traders should learn how these costs change across different timeframes as the currency pair price fluctuates. The tables below show the percentage costs (in pips) that can be expected when trading the CAD/HUF pair.

ECN Model Account

Spread = 50 | Slippage = 2 | Trading fee = 1

Total cost = 53

STP Model Account

Spread = 55 | Slippage = 2 | Trading fee = 0

Total cost = 57

The Ideal Timeframe to Trade CAD/HUF

With both the ECN and the STP forex trading accounts, the 1-hour timeframes have the highest costs. Therefore, for short-term traders, using the timeframes with minimum volatilities increases the trading costs they will incur. For the 1H, 2H, 4H, and the 1D timeframes, you will incur lower trading costs by trading the CAD/HUF pair when the volatility is above average.

For both types of trading accounts, longer time frames, i.e., the weekly and the 1-month, offer lesser trading costs for the pair. It is worth noting that forex traders can minimize their costs by using limit order types, which eradicate the risks of slippage. Here’s an example with the ECN account.

Total cost = Slippage + Spread + Trading fee

= 0 + 50 + 1 =51

You can notice that when the cost associated with slippage is removed, the overall costs for trading the CAD/HUF pair significantly drops. The highest cost reduces from 898.31% to 864.41%.

Categories
Forex Assets

Understanding The Costs Involved While Trading The CAD/ILS Forex Exotic Pair

Introduction

CAD/ILS is an exotic currency cross. Here, CAD is the Canadian Dollar, and ILS is the Israeli Shekel. The CAD is the base currency, and the ILS is the quote currency. Therefore, the price of the CAD/ILS pair represents the quantity of the ILS that  CAD can buy. If the price of the pair is 2.6004, it means that 1 CAD can buy 2.6004 ILS.

CAD/ILS Specification

Spread

The buying price and the selling price of a currency pair tend to be different in forex. The difference between these two prices is the spread. The spread for the CAD/ILS pair is: ECN: 22 pips | STP: 27 pips

Fees

Forex brokers charge a commission on every trade made with the ECN account. The commission varies depending on the broker and the type of trade. Trades on STP accounts do not attract a trading fee.

Slippage

It is rare for a trader to get the exact price they request for a trade. Usually, there is a difference between the price requested and the execution price. This difference is the slippage, and it depends on market volatility and the speed of trade execution.

Trading Range in the CAD/ILS Pair

The trading range is the analysis of how currency fluctuates across different timeframes in terms of pips. The trading range is used to analyze a currency pair’s volatility and expected profit. For example, if on the 2-hour timeframe the trading range of the CAD/ILS pair is 10 pips, then a trader can expect to either gain or lose $38.5

Here’s the trading range for the CAD/ILS pair.

The Procedure to assess Pip Ranges

  1. Add the ATR indicator to your chart
  2. Set the period to 1
  3. Add a 200-period SMA to this indicator
  4. Shrink the chart so you can determine a larger period
  5. Select your desired timeframe
  6. Measure the floor level and set this value as the min
  7. Measure the level of the 200-period SMA and set this as the average
  8. Measure the peak levels and set this as Max.

CAD/ILS Cost as a Percentage of the Trading Range

The cost of trading any currency involves the slippage, fees, and the spread. These costs vary across different timeframes under different volatility conditions. For a forex trader, analyzing the cost as a percentage of the trading range helps implement informed risk management techniques.

The tables below show the analyses of the trading costs for the CAD/ILS pair across different timeframes.

ECN Model Account

Spread = 22 | Slippage = 2 | Trading fee = 1

Total cost = 25

STP Model Account

Spread = 27 | Slippage = 2 | Trading fee = 0

Total cost = 29

The Ideal Timeframe to Trade CAD/ILS

We can see that the trading cost for the CAD/ILS pair is higher during shorter timeframes and low volatility in both the ECN and STP accounts. Longer-term traders trading on weekly and monthly timeframes enjoy relatively lesser trading costs than shorter timeframe traders.

It is worth noting that for every type of trader, initiating trades when volatility is above average reduces the trading costs. Furthermore, opting to use forex limit orders instead of market orders which are susceptible to slippage, can significantly reduce trading costs. With limit orders, the risk of slippage is removed hence lowering trading costs. Here are the trading costs when limit orders are used.

ECN Account Using Limit Model Account

Total cost = Slippage + Spread + Trading fee

= 0 + 22 + 1 = 23

We can see that trading costs for the CAD/ILS have reduced across all timeframes, with the highest cost dropping from 491.53% to 372.88% of the trading range.

Categories
Forex Assets

Analysing The Costs Involved While Trading The CAD/INR Exotic Currency Pair

Introduction

The CAD/INR pair is considered an exotic currency pair where CAD is the Canadian Dollar, while the INR is the Indian Rupee. This article will cover the basic elements of the CAD/INR pair that you should know before you start trading the pair.

In this pair, the CAD is the base currency, while the INR is the quote currency. Therefore, the price attached to the CAD/INR pair is the amount of INR that can be bought by 1 CAD. For example, if the price of CAD/INR is 55.059, it means that for every 1 CAD, you can get 55.059 INR.

CAD/INR Specification

Spread

The price at which you can buy a currency pair is different from the price at which you can sell the same pair. This difference is the spread. The spread is considered a source of revenue for brokers and a trading cost for forex traders. The spread for the CAD/INR pair is as follows.

ECN: 39 pips | STP: 44 pips

Fees

The trading fee is the commission you pay your forex broker for every trade you make. STP accounts usually have no trading fees, while the fees charged on ECN accounts vary from broker to broker.

Slippage

Slippage represents the difference between the price at which you place a trade and the price at which your broker will execute the trade. Market volatility and the broker’s efficiency determine the amount of slippage.

Trading Range in the CAD/INR Pair

The trading range in forex helps a trader analyze the extent of a currency pair’s fluctuation during a specific timeframe. As measured in pips, this fluctuation can help determine the volatility of the pair and the expected gains or losses. For example, if in the 4-hour timeframe the CAD/INR pair has a volatility of 30 pips, a trader can expect to either gain or lose $54 since the value of 1 pip is $1.8

The table below shows the minimum, average, and maximum volatility of CAD/INR across different timeframes.

The Procedure to assess Pip Ranges

  1. Add the ATR indicator to your chart
  2. Set the period to 1
  3. Add a 200-period SMA to this indicator
  4. Shrink the chart so you can determine a larger period
  5. Select your desired timeframe
  6. Measure the floor level and set this value as the min
  7. Measure the level of the 200-period SMA and set this as the average
  8. Measure the peak levels and set this as Max.

CAD/INR Cost as a Percentage of the Trading Range

The knowledge of the potential costs when trading helps determine the trading strategies to be used. Cost as a percentage of the trading range will help us understand how trading costs vary with volatility under different timeframes.

Total cost = Slippage + Spread + Trading Fee

The tables below show the analyses of percentage costs in both ECN and STP accounts.

ECN Model Account

Spread = 39 | Slippage = 2 | Trading fee = 1

Total cost = 42

STP Model Account

Spread = 44 | Slippage = 2 | Trading fee = 0

Total cost = 46

The Ideal Timeframe to Trade CAD/INR

Depending on your forex trading style, you can use the above analysis to coincide with your trade of the CAD/INR pair with moments of lower trading costs. The 1-hour timeframe for the STP and the ECN accounts has the highest trading costs of 779.66% and 711.86% of the trading range, respectively. Also, notice that the highest costs coincide with the lowest volatility of 3.1 pips.

Trading longer timeframes like the 1-week and the 1-month timeframes are associated with lower costs. However, trading when the CAD/INR pair’s volatility is above average has a lower cost. Another way of reducing trading costs is by using the limit order types, which eliminates the slippage costs. Here’s how it works.

Total cost = Slippage + Spread + Trading fee

= 0 + 39 + 1 = 40

When limit orders are used, the slippage cost becomes zero. Consequently, the trading costs are significantly reduced, with the highest trading cost dropping from 711.86% to 677.97% of the trading range.

Categories
Forex Assets

Asset Analysis – Trading The CAD/PHP Forex Currency Pair

Introduction

CAD/PHP is an exotic Forex currency pair where CAD is the Canadian Dollar while PHP is the Philippine Peso, the Philippines’ official currency. This article will cover fundamental aspects that you should know about CAD/PHP before you start trading the pair.

Understanding CAD/PHP

In this currency pair, the CAD is the base currency, and the PHP is the quote currency. The CAD/PHP pair price represents the quantity of the PHP that can be bought by 1 CAD. If the CAD/PHP price is 36.181, it means that for every 1 CAD you have, you can buy 36.181 PHP.

CAD/PHP Specification

Spread

In forex trading, the spread is the difference in the value at which a trader can buy a currency pair and the price at which they can sell it.

ECN: 10 pips | STP: 15 pips

Fees

There are no trading fees associated with STP accounts. However, for the ECN accounts, the trading fees that you will incur per transaction are determined by your forex broker.

Slippage

When trading forex, slippage occurs when there is a difference between the price at which you place your trade and the price at which your broker executes it. Slippage in forex frequently happens at times of higher volatility or when significantly larger orders are made.

Trading Range in the CAD/PHP Pair

Forex traders should know how a given currency pair changes within different timeframes. This change in terms of pips is referred to as the trading range. It is used to analyze the historical volatility of a given pair across different timeframes. Therefore, the trading range can be used to determine the amount of profit that a trader should expect to earn.

The Procedure to assess Pip Ranges

  1. Add the ATR indicator to your chart.
  2. Set the period to 1
  3. Add a 200-period SMA to this indicator.
  4. Shrink the chart so you can determine a larger period
  5. Select your desired timeframe
  6. Measure the floor level and set this value as the min
  7. Measure the level of the 200-period SMA and set this as the average
  8. Measure the peak levels and set this as Max.

CAD/PHP Cost as a Percentage of the Trading Range

Slippage, spread, and brokers’ fees amount to trading costs to a forex trader.

Total cost = Slippage + Spread + Trading Fee

Therefore, forex traders should be aware of how these costs vary during different timeframes depending on the pip change of the currency they trade.

The tables below are of the percentage costs that can be expected when trading the CAD/PHP pair under the ECN and STP account types. The costs are expressed as pips.

ECN Model Account

Spread = 10 | Slippage = 2 | Trading fee = 1

Total cost = 13

STP Model Account

Spread = 15 | Slippage = 2 | Trading fee = 0

Total cost = 17

The Ideal Timeframe to Trade CAD/PHP

From the above trading range cost analysis, the most cost is incurred at the 1H timeframe at 220.34% for the ECN account and 288.14% for the STP account. These costs imply that it is not ideal to trade during times of low volatility of about 2.3 pips. However, the trading costs associated with the 1H, 2H, 4H, and the 1D timeframes are lower when the market volatility is above average. Intraday traders can time their entry when the volatility of the CAD/PHP is above average.

The longer timeframes for both types of accounts have lower trading costs associated with them. Thus, longer-term traders can get to enjoy lower costs.

Forex traders can also significantly reduce their trading costs by employing limit order types to ensure they do not experience slippage costs. Let’s look at the total costs when slippage is zero with the ECN account.

Total cost = Slippage + Spread + Trading fee

= 0 + 10 + 1 =11

With the ECN account, the highest trading cost reduces from 220.334% to 169.49%, showing that using the limit order types significantly reduces the trading costs.

Categories
Forex Basics

The Inertia of Asset Prices

Of all the factors of investment-those deviations in price behavior that, in theory, should not exist-, there is one that stands out over others by a curious and profitable quality: the more it is popularized and the more it is used, the more effective it becomes. It’s about the trend or momentum. That is, from the inertia of prices to continue to rise or fall beyond the reasonable pushed by human nature. Very good news for every investor, because although you can move mountains and alter the course of rivers, human nature cannot be changed.

What is an “investment factor”? Nothing more than an asset selection process or investment strategy that generates, in the long run, a persistent excess of return above the benchmark against which it is measured (its benchmark). For example, the Value investment factor or style consists of, as opposed to selecting actions similar to the index, invest in those companies that are fundamentally undervalued in price, and portfolio-weighted differently from the index. Thus, the fund that applies a Value investment factor is possible -although it is not guaranteed- that in the long term gets an excess of profitability above its benchmark.

More than 600 investment factors have already been detected, although the consensus is reduced to the four most significant: a) the Value just mentioned, b) the excess profitability of shares with low volatility, c) small-size shares with respect to the rest of the market and, finally, d) the “inertia” of prices to continue their previous trend beyond the theoretical random trajectory proposed by academic orthodoxy.

The problem is that any investment factor is liable to disappear if it becomes too popular. Like a 20 euro banknote lying on the sidewalk, if the opportunity is there, however difficult it may be to catch it in practice, it will not remain available for long. For example, if many funds and investors select their shares according to a Value methodology, it creates buying pressure on originally undervalued companies that can make those investment opportunities disappear. In other words, there is a real danger that well-known investment factors will eventually become arbitrations, in the sense that when they become sufficiently popular and widespread, their advantage tends to be progressively reduced until it disappears.

The Inertia of Prices

However, this is not the case with strategies that take advantage of inertia in prices. Capturing and converting this inertia into profitability is the common motivation for funds called “momentum”, “trend following” and “CTAs”. In the case of momentum, it refers to investments that are limited to capturing only bullish trends (long-only) and can be applied as absolute momentum (when only the inertia of the asset being measured is taken into account) or relative momentum (when comparing the relative behavior of an asset with others to decide which/is overponderar). The trend-following/CTAs or trend tracking is similar but is open to capturing both bullish and bearish trends in multiple markets and different time windows.

The different modalities of “Funds of inertia” (the appellative is mine), although implemented in ways sometimes very different and sophisticated, respond to the same underlying phenomenon. Today there are more than 400 billion dollars (400 billion Anglo-Saxon) managed based on this phenomenon in its different flavors.

But as we have said, according to economic theory this deviation in prices should not occur. So why is there this inertia in prices? There are at least three compelling reasons for this, and the good news for investors is that it doesn’t look like this 20-euro banknote on the sidewalk, though difficult to pick up, is going to disappear in the future.

Structural Reasons for the Investment Industry

Most institutional investors have to comply by law with pre-established market risk limits in their prospectuses. This forces them to reduce their exposure to those assets whose risk (usually measured by their volatility or VaR) is growing. That is, it forces them to sell these assets, so with their sales, they help the formation and continuity of bearish trends. On the contrary, a decrease in risk leads them to buy more, feeding in turn the upward trends of assets that are rising in price.

But it is not only the regulatory control of risk that feeds trends. The professional managers, in a personal capacity, are prisoners of the benchmark that their funds try to overcome, so they cannot stay out of the bullish movements. If they don’t buy when the market goes up and sell when it goes down (even if they don’t know why or disagree with the reasons for the move), they risk moving away from their benchmark and being fired. The fear of losing their jobs translates into feeding bullish and bearish tendencies when they appear. As I have repeated on other occasions, the professional managers of large firms do not manage the money of their clients, but their own professional career.

In addition, when a fund is surpassing its benchmark, it attracts investors’ attention and attracts new subscriptions, which have to be invested in those assets in which the fund is already invested, further fueling previous upward trends. The same is true of those funds that are falling in the ranking behind the benchmark: they suffer refunds that force them to sell and thus feed the bearish tendencies.

In short, the very idiosyncrasy of the management industry (investment and pension funds, large insurers, etc.), coupled with the incentives of its own professionals, forces the large players who provide the bulk of volume to the markets to align with trends and feed them.

Macroeconomic Reasons

Regardless of the industry’s structural reasons, the existence of business cycles results in some assets behaving better or worse than others for long periods of time.

Each state of the cycle or combination of states-expansion, recession, inflation, and deflation-generates different underlying dynamics in the economy, causing some types of assets to revalue more than others. Depending on the time of the cycle, this produces long-term trends usually called bullish or bearish markets (secular bull/bear markets). For example, during periods of economic expansion, which can last from one to twelve years, the stock market as an asset is revalued (as an expression derived from the economic boom itself), unlike during economic recessions. These secular trends are also inevitable and exploited by some long-term focused inertia funds.

Behavioral Reasons

The pervasiveness of fear and greed in financial markets is evident to anyone with a modicum of investment experience. The human being is gregarious and fickle by nature. What costs you the most, especially when investing, is to be consistent with your principles and strategies. When a price starts to rise significantly, it becomes the fashion theme and attracts the attention of investors. Regardless of the reasons for such revaluation are more or less justified, new investors join the movement by buying in the hope that it will continue. This contributes to nourishing the upward trend in a virtuous circle of growing and widespread greed transformed into buying pressure.

This self-fulfilling prophecy also works in reverse. When a price falls steadily, doubts are quickly dispersed among investors like a virus, producing a vicious circle of sales fed back by a growing fear that may eventually turn into selling panic. These phenomena alone, irrespective of whether asset increases or decreases are rationally or economically justified, are able to provide sufficient inertia to prices and build trends on different time scales usable by inertia funds.

This is so today and it was almost 400 years ago in the Amsterdam that drew the Cordovan José de la Vega in his book “Confusion of confusions”. In its pages, describing the regulars of the Dutch stock market of that time, we see exactly the same type of behavior that we see today in real-time through our mobiles.

In fact, trends are a phenomenon that is systematically found in all historical price series that have occurred and can go back up to 800 years in the past. Regardless of the time and, more importantly, of culture-trends can be observed both in the formation of medieval Japanese rice prices and in our contemporary stock exchanges. The same tulip bubble pattern in early 17th-century Holland is repeated in the South Sea bubble of next-century England or in today’s Bitcoin. As if it were the music of the markets, inertia in prices appears in each and every culture that has developed free markets.

The Stubbornness of Human Nature

“You can move mountains and divert the course of rivers, but you can’t change human nature.” -Medieval Japanese proverb

Will inertia strategies continue to work in the future? We can answer this question with another: what is the factor common to all markets, assets, and historical epochs? The answer is the human being. Markets are a human activity and are therefore inevitably conditioned by their nature. As long as we humans continue to negotiate freely in the markets, we will do so thanks to an organ we cannot let go of our brain. An extraordinary and unique tool in the Universe, but full of biases, fallacies, and emotions; all obstacles to investing efficiently.

In other words, convex strategies based on inertia will continue to work in the future because the human being born today will have the same brain as the human being who traveled the steppes 50,000 years ago. Biological evolution has not had time to adapt to rapid cultural and biological evolution. We continue to arrive in today’s world equipped with a brain prepared for a world that has ceased to exist.

For example, people don’t like to lose money. This is so even if temporarily losing is part of a larger and more profitable plan over a longer period of time. Although we understand it rationally, any temporary loss or potential produces the same suffering: a real pain that our emotional brain never fully understands. Inertia strategies, even if they work, require taking on inevitable and numerous losses along the way, sometimes over several years.

It is inevitable and consubstantial to any convex strategy. But when it comes to losing first, most people prefer to abstain and choose a type of strategy that best suits the emotional response of their steppe brain, not the unpredictable and volatile nature of abstract markets. Without being aware of it, they thus carry with potential energy the future trends that inevitably will continue to form in the future, thanks to the particularities of that kilo and a half of gray matter that we all transport in the skull.

Inertia as a source of profitability in the markets is there and, as we have seen, will continue to exist, even if most people are unable to maintain the rigor and consistency necessary to capitalize on it. Human nature refuses to let itself be carried away by the current of a river even if it benefits it. Instead of taking advantage of it and flowing, humans flee or are destroyed by it. They need to know why he’s moving, how he’s doing it and where he’s going, trying to push the river instead of flowing with it.

Categories
Forex Assets

Costs Involved While Trading The JPY/LKR Forex Exotic Pair

Introduction

JPYLKR is a forex exotic currency pair, where JPY is Japan’s currency, and LKR is the currency of Sri Lanka. In this currency pair, JPY is the first currency, and the LKR is the second currency. The JPYLKR shows how much LKR is needed to have one JPY. It is quoted as 1 JPY per X LKR. For example, if the value of this currency pair is at 1.7686, then almost 1.7686 LKR is required to purchase one JPY.

JPYLKR Specification

Spread

The spread comes from the difference between the Ask and Bid price that a broker take as a charge. This value is set by the broker. However, it varies on the type of execution model used for executing the trades. Below are the ECN and STP values of JPY/LKR forex exotic pair.

Spread on ECN: 19 pips | Spread on STP: 24 pips

Fees

Every broker takes fees from trading, which is similar to the stock market. However, there is no fee on STP accounts, but a few pips on ECN accounts.

Slippage

Sometimes the entry price and execution price does not match, which is known as Slippage. The reason for slippage is the market volatility and the broker’s execution speed.

Trading Range in JPY/LKR

Procedure to assess Pip Ranges

  1. Add the ATR indicator to your chart
  2. Set the period to 1
  3. Add a 200-period SMA to this indicator
  4. Shrink the chart so you can assess a large time period
  5. Select your desired timeframe
  6. Measure the floor level and set this value as the min
  7. Measure the level of the 200-period SMA and set this as the average
  8. Measure the peak levels and set this as Max.

JPYLKR Cost as a Percent of the Trading Range

With the volatility values from the above table, we can determine the chance of cost with volatility changes. We have got the ratio between total cost and volatility and converted into percentages.

ECN Model Account 

Spread = 19 | Slippage = 5 | Trading fee = 8

Total cost = Spread + Slippage + Trading Fee

= 19 + 5 + 8

Total cost = 32

STP Model Account

Spread = 24 | Slippage = 3 | Trading fee = 0

Total cost = Spread + Slippage + Trading Fee

= 19 + 5 + 0

Total cost = 27 

The Ideal way to trade the JPYLKR

The JPYLKR has enough volatility and liquidity. Hence, trading in this currency pair is straightforward and profitable. The above table’s percentage values are within 300%, which is an indication of stable volatility. Therefore, the costs are low irrespective of the timeframe and volatility you trade.

Digging it a little deeper, there is an inverse relationship between the cost and volatility. In a lower timeframe, the volatility is higher, and the cost is lower. However, in a higher timeframe, the volatility is lower, but the cost is higher. In this situation, traders should focus on trading when the volatility is on the average value. Therefore, it will be cost-efficient for all traders.

Furthermore, traders can quickly reduce costs by placing ‘limit’ and ‘stop’ orders. Because by using limit orders, the Slippage can be totally avoided, and the total costs get reduced. In our example, the total cost will be reduced by five pips, as shown below.

Using Limit Orders

Spread = 19 | Slippage = 0 | Trading fee = 0

Total cost = Spread + Slippage + Trading Fee

= 19 + 0 + 0

Total cost = 19

Categories
Forex Assets

Everything About Trading The CAD/SGD Forex Currency Pair

Introduction

CAD/SGD is a Forex exotic currency pair where CAD represents the Canadian Dollar and the SGD, – the Singapore Dollar. For this pair, the CAD is the base currency, and the SGD is the quote currency. Therefore, the price attached to the pair is the quantity of the SGD that can be bought by 1 CAD. If the price of the CAD/SGD pair is 1.0289, it means that 1 CAD dollar buys for 1.0289 SGD.

CAD/SGD Specification

Spread

In forex trading, the difference in pips between the buying price (bid) and selling price (ask) is the spread. Forex brokers primarily generate their revenues through the spread. The spread varies depending on the type of trading account. The spread for the CAD/SGD pair is:

ECN: 7 pips | STP: 12 pips

Fees

For every individual trade made on an ECN account, one has to pay a commission. This fee varies with the broker and depends on the type of trade executed and the currency being traded. STP accounts do not have fees.

Slippage

In forex trading, slippage is the difference in the price in which a trader initiates a trade and the price at which it is executed. Slippage is a direct result of the brokers’ speed of execution and market volatility.

Trading Range in the CAD/SGD Pair

In forex, the trading range shows the fluctuation of a currency pair within s specific timeframe. The trading range is useful to estimate potential profit or loss from trading different timeframes. For example, if the CAD/SGD pair fluctuates ten pips in the 2-hour timeframe, it means that a trader can expect to either gain or lose $97 by trading one standard lot.

Below is a table showing the minimum, average, and maximum volatility of CAD/SGD across different timeframes.

The Procedure to assess Pip Ranges

  1. Add the ATR indicator to your chart
  2. Set the period to 1
  3. Add a 200-period SMA to this indicator
  4. Shrink the chart so you can determine a larger period
  5. Select your desired timeframe
  6. Measure the floor level and set this value as the min
  7. Measure the level of the 200-period SMA and set this as the average
  8. Measure the peak levels and set this as Max.

CAD/SGD Cost as a Percentage of the Trading Range

Cost expressed as the Percentage of the trading range helps a forex trader establish the anticipated trading costs under different market volatility across different timeframes.

Total cost = Slippage + Spread + Trading Fee

The tables below show the percentage costs to be expected when trading the CAD/SGD pair. The costs are expressed as a percentage of pips.

ECN Model Account

Spread = 7 | Slippage = 2 | Trading fee = 1

Total cost = 10

STP Model Account

Spread = 12 | Slippage = 2 | Trading fee = 0

Total cost = 14

The Ideal Timeframe to Trade CAD/SGD

We can see that in both the ECN and the STP accounts, costs are higher when volatility is at a minimum across all timeframes. Furthermore, we can observe that these costs tend to reduce when the volatility increases to the maximum.

For the CAD/SGD pair, costs are highest when volatility is at the lowest at 0.02 pips during the 1-hour timeframe. Conversely, the trading costs are lowest at the 1-month timeframe when volatility is at a maximum of 8.7 pips. Since high volatility can be risky and low volatility less profitable, forex traders should consider trading during times of average volatility.

More so, traders can increase their profitability by eliminating the costs associated with slippage. By using limit instead of market orders, forex traders can avoid experiencing slippage when entering and exiting positions.

Let’s have a look at how zero slippage cost affects the total costs.

ECN Account Using Limit Model Account

Total cost = Slippage + Spread + Trading fee

= 0 + 7 + 1 = 8

Notice that using the limit order type reduces the overall costs. The highest cost, for example, has reduced from 169.49% to 135.59%.

Categories
Forex Assets

Top Secret: The Hidden Message of Indices

Spoiler for newcomers to the world of investment: In the long term, between 90% and 95% of funds fail to beat the benchmark they intend to surpass. This means that the active management fund (with that “star manager” so famous) they offer you in their bank branch (or in the luxurious private banking office, as if it were something very special and exclusive “only for a few”), has only a ten-to-ten chance of surpassing the index. An index in which you could invest much cheaper (up to 70 times cheaper) and profitable.

After the initial shock-if you were unaware of this reality, take the time to think about what your savings have been putting you through all these years-some questions arise: What lies behind this superiority of indices over active fund management? Is this a generalized clumsiness on the part of managers, or is it a consequence of the idiosyncrasy of an industry with perverse incentives?

What if the success of the indices is telling us something much more important and profound about the nature of the markets, and therefore they are a clue as to how we should or should not face investment? Although the most common question is the one that the media themselves induce us to pose uselessly:

What funds will beat the index?

This question is formulated with very bad intentions because it induces us to try to “guess” that fund every 10 that in the future will do better than the remaining 9. Are you familiar with the typical headlines in the press: “The funds that rent the most this year”? Obviously, the industry is interested in adopting this perspective because then we will always be subscribing to the fund that we believe will surpass the rest, thus changing the background as who changes shirts, instead of “standing still” indexing us.

The question does not make sense for two reasons:

Firstly, it is not possible to predict today what specific funds will beat the indices over the next few years. The fact that a fund has done so in recent years is not a sufficient reason for it to continue to do so. In fact, it is usually indicative of just the opposite. An example: Only 5% of US first quartile stock market funds in 2013 repeated quartile in 2014. And five years later, none of the funds that invest in large or medium-capitalization equities manages to stay within 25% of the best funds. Although the press and specialized media devote all their attention and praise to the funds that broke their index last year, investing “in pursuit of the best funds” is the worst way to choose an investment fund (and yet it remains the determining factor with which most investors make their investment decisions).

The second reason why there is no point in asking who will beat the index is practical: we do not need to know which funds will beat the index to achieve reasonable returns, with very low long-term risk. To illustrate this, imagine investing being like betting on a 20-team football league that will last 20 years. We can’t know who will end up being number 1, but we do know who will always be second to the rest of 18 teams: the index that everyone is trying to overcome. That is to say, obsessing about getting the first one right, when in the long run we have easy access to the runner-up -above the other 18 options available-, is at best frustrating and at worst very dangerous for our long-term heritage.

Why is this happening?

But let’s go back to the main question and stop being distracted by interesting distractions: What are the reasons for the success of indexation compared to other active investment strategies?

Although there are many reasons why managers have so many problems to overcome the index, we will summarize below the two most common: the costs and the idiosyncrasy of the management profession.

What I would like most in this article is to propose a third, much deeper and more fundamental cause, we could almost say philosophical, that justifies as much or more than those usually attributed to the success of indices as an investment strategy.

Is there passive management?

Before continuing, a necessary clarification: “passive” management does not exist. Someone, if not us, ultimately makes the decisions-systematically or discretionally-on what, how much, and when to invest. As we shall see, the dynamics of indices do not escape this unavoidable condition. By investing in indices we are investing according to its construction strategy-which by definition is active-, not immobilizing the money in a chest at the bottom of the sea. The appellation of “passive management” used by the industry is therefore unfortunate and leads to misunderstanding. The most appropriate “indexed management” or indexing should be generalized. But then,

What is an Index?

Apart from its orthodox definition, an index is nothing more than an attempt at simplified representation-and like any representation of reality, it is biased-of the market. We must not forget that its great success as a form of investment was neither premeditated nor intentional in its origins; it was simply an attempt to take a “picture” of the markets.

Very briefly, it consists of deciding on an amount of N shares to be included in a portfolio together with a selection and weighting criterion, which will result in a number (the “level” of the index at each point in time according to the quotation of its underlying components). For example, N=35 in our Spanish IBEX, N=500 for the S&P of large capitalization shares in the United States, etc. The most common criterion is that, in order to be representative of a market, they have to be the most “large”, as defined by those with greater liquidity and turnover. A committee of experts will meet regularly to assess whether existing actions meet the criteria and represent the market, or whether changes need to be made. That is, actively take and put actions to continue fulfilling the original criteria.

How does an Index work?

The indices are, in essence, baskets of dynamic actions in which their components are “recycled” as time passes, expelling the companies in decline and entering the ones that are capitalizing (for whatever reason or reasons) current dynamics of the current business cycle. The indices are therefore much more than “a picture of the market”, they are the tip of the iceberg -what you see- of a long previous process.

This process of “recycling” resembles the creative destruction that occurs in the real economy throughout economic cycles and that was described by Joseph Schumpeter in 1942. In free-market economies and throughout the inevitable economic cycles, the process of innovation involves the destruction of old companies and their business models (the winners in previous business cycles) by new products and emerging business models.

For Schumpeter, entrepreneurial innovation is the driving force behind long-term net economic growth, despite destroying companies from previous cycles along the way. Indeed, nothing is forever. Neither IBM was going to be eternal in the ’70s, nor today’s FAANG are going to dominate forever, no matter how much the myopia of the present makes us believe otherwise. Schumpeter called this recursive and inescapable process “creative destruction”.

If you look, the indices execute the same process of creative destruction as the economy but applied to the selection of their portfolio constituents. In fact, the indices are the last step in a company selection strategy that began decades ago with thousands of previous start-ups (most of which failed). Indeed, of all the start-ups, only a small group survives, and even less are profitable. Of that small, profitable group, only a small percentage eventually goes on the stock market. On the way are those companies unable to scale their business model or simply survive. And of that minuscule group of companies listed on the stock exchange, only the most successful companies become part of the stock index that represents that market and, by extension, the best of the economy of the sector, country, or region that the index tries to represent.

Usually, once inside the index, those companies with greater capitalization will have a greater weight in the index. Thus, the more successful a company is for investors, or so it is perceived, the more it will rise in price and its weight in the index will be higher. The effect of this process is that, in each new business cycle, those companies that better capitalize on the new business models of the current economy are the ones that weigh the most, so the indices end up capturing -automatically and inevitably- the most successful companies in each cycle.

The S&P-500 index first included 500 companies in 1957. Today only 86 of the original companies remain in the index. Since then, the remaining 414 original companies have been replaced by new ones.

It is this sense, and unlike investment in isolated companies, indices imply a low risk for the long-term investor because by definition they cannot fail. Although recessive periods are unavoidable (we must always bear in mind that stock market indices can drop temporarily around -50% or more at the worst times, which is not usually obvious to most investors) throughout business cycles, investing in indices globally ensures we capitalize on every new wave of growth. So, if we understand volatility as a mathematical description of how much an asset moves over time, and not as risk, then we can recognize that indexed investment, despite its high volatility, involves a lower real risk to the long-term investor than other investment alternatives.

Indexation thus allows us to participate in the process of natural creative destruction of the economy and its economic cycles, in a sufficiently efficient way -in fact, more efficient than 90% of all funds- automatically (the investor does not have to do anything) and much cheaper than through active management.

The next question is, being these investment rules that implement indices so simple…

Why don’t most managers surpass the Index?

We discussed this in-depth here. In short, the first reason is cost: Investment funds bear cumulative costs and fees which, in total, average between 2%-3% per year. This may seem little, but it would be the equivalent of participating in a marathon in which active managers are added between 20 and 30 meters more to run per kilometer. At first, it doesn’t seem like much, but in the long run of an “investment marathon,” leaving a 3% annual return on commissions means reaching only half of the accumulated return that we could achieve without that ballast. Ballast that indices lack, being simply an abstract numerical result.

The second reason is the idiosyncrasy of the industry, which generates perverse incentives in managers. On a personal level (yes, managers are also normal people), a fund manager within a large fund manager -usually within a large bank with a large product distribution chain- is not compensated for the risk of making investment decisions that are too different from those of his colleagues and therefore from those of the index construction. The manager has an unknown chance of getting it right. But if it goes wrong, he risks losing his job. This asymmetric incentive and the tyranny of being judged short-term work (if we deviate from the index, it is impossible to overcome it always and during all periods), cause mimetic behaviors that explain part of the little dispersion of results between managers with the same benchmark. These incentives cause managers to devote themselves to managing the best that their careers can, not the money of their clients. Usually, who pays for this perverse incentive dynamic is the final investor, who sees his active management funds moving further and further away from the total return on the index.

But as I outlined at the beginning, the costs and perverse incentives of the industry are not sufficient reasons to explain the overwhelming success of indexation versus active management. There is a deeper and more impactful reason, which however usually goes unnoticed or is not given the importance it deserves.

This reason has a lot to do with the worldview we have of the world, of what the world really is, and the path we take in the face of the inescapable dilemma of all investment.

The Dilemma of Investment

Investing means facing, whether we are aware of it or not, a dilemma from which we cannot escape. Regardless of the narratives, styles, or instruments used, and profitable investment strategy-that is, with positive mathematical hope in the long run-ultimately has to choose between two mutually exclusive ways of investing: Look for a high profit/loss ratio at the cost of sacrificing the percentage of hits. Or, pursue a high success rate at the cost of a low profit/loss ratio.

Unfortunately, in the real world, there are no consistent strategies that combine both a high degree of accuracy and a high profit/loss ratio. Attempts to pursue these “unicorns” are not sustainable and have always ended catastrophically (for the investor).

Thus, for deterministic environments, it is very efficient to assign media and talented people (and “hedgehog mentality”) to solve the problem via concave strategies. Very intelligent people are often attracted to these kinds of strategies, of increasing complexity and sophistication, with which they feel that they are controlling what is happening and can bring even more value the more they try. One example could be the engineering associated with the thermodynamics of gases and their mechanical conversion into transport vehicles. A car today has a sophisticated engine and systems that are far more efficient than any car half a century ago.

Decreasing marginal return on complexity when investing. 

However, as Jack Bogle has commented on numerous occasions, today’s average manager, regardless of his intelligence, does not manage better than the typical manager of half a century ago. For many great hedgehogs (including Nobel Prize winners) and dedicated media (including the now fashionable Artificial Intelligence and Machine Learning techniques), the marginal benefit of increasing complexity decreases very quickly from an optimal point (# a’ in the following diagram). Indeed, despite the “sophistication inflation” that the industry has suffered in terms of mathematical models and products in recent decades, there has been hardly any material advance for the investor in the quality of active management. The reason is that the system on which the manager works-the financial markets-, regardless of their talent and available means, is fundamentally non-deterministic.

Indeed, since markets are an emerging phenomenon as a result of human action, even if the mathematical models that describe the markets were definitely correct-something impossible in Popper’s scientific sense-and/or complete in his description of social reality-something impossible in Hayek’s sense-; the evolution of the markets in the short and medium-term will always and necessarily be unpredictable.

Warren Buffett reminds us of them in his own words on the next date. You don’t just need a great expert to obtain good investment results, but it is likely that, if we are very smart, we will be an obstacle to achieve our objectives because we will tend towards attitudes and worldviews of the hedgehog:

“If you have an IQ of 160, sell 40 points to another. You need to be smart but not a genius: Investing is not a game where the player with an IQ of 160 beats the one with 130. The rationality of what you’re doing is essential.” -Warren Buffett

Indeed, the industry is reluctant to accept that, in financial markets, as a paradigm of an environment dominated by uncertainty, less is more. In other words, maximum efficiency when investing is not achieved by indefinitely increasing the complexity of the models (point ìc’ in the upper scheme), but by keeping it at an optimal and reasonable level of complexity (point ìa’), adequate and consistent with its unpredictable nature. Once an optimal threshold of complexity has been passed to the environment, it is useless to continue allocating more resources or to increase the complexity of the solutions. It seems that the industry is endeavoring to increase the complexity of its services and products not to increase the value brought to the customer, but simply to use this striking sophistication as an advertising tool.

Indices resist where humans fail.

Most of the success in investing is in not letting us become our worst enemy (what I call investment iatrogenia). If markets and investments are by themselves a difficult art to learn, adding ourselves as a traitor to our goals sometimes gives it an insurmountable difficulty. We come into the world laden with psychological biases and are easy prey to fallacies. Becoming our worst enemy by investing is the easiest and fastest thing that can happen to us. And it is not a question of being more or less intelligent, but of knowing and being able to manage our emotions during the long journey. However, the indices, like any systematic strategy, lack the possibility of falling into some fallacy or psychological bias. Indeed, like any cost-effective systematic and convex strategy:

The index keeps winning shares as long as they meet the conditions to stay in the index. Be it for 1 year or be 100 years. This may seem obvious, but not at all during the time that we are invested, as human beings are very sensitive to the path traveled (“path-dependent”, which an old quant would say). If we invest in a company that after a few years suffers a fall of -70% or -90%, it is most likely that the “pain” for said loss leads us to abandon it and sell. . Philip Morris

The index eliminates the losers, even if we are “in love” with them. Once we have bought an action, we tend to reinforce the reasons for that decision, to “like” it beyond the pure strategic investment decision. When it falls below our purchase price, we tend to justify and believe that it is the market that is making a mistake. This results in many investors accumulating a large stock market that, if they had followed the criteria of the index, would have been sold long ago to make room for other stocks. In other words, indices don’t fall in love with any action. If it does not meet the conditions to stay in the index, then it is removed without hesitation twice.

In other words, by definition and when implementing a profitable convex strategy, an index cannot fail (the shares can). It is neutral with regard to sectors and investment factors (some sectors and investment factors do better or worse than others over time, but we do not know which and when). It is neutral regarding the risk of the manager as an incentive worker to keep their job; that may be implementing strategies that end up being, in the most benign cases, followers of the index (the problem of close trackers), and in the worst incoherent with the nature of the market (and make it much worse than the index). And above all, it is practically neutral with respect to the erosion of commissions, which in active management are usually around 2%, while funds and indexed ETFs are already reaching the 0.05% annual (up to 40 times cheaper) environment.

Categories
Forex Assets

Costs Involved While Trading The ‘CAD/TWD’ Forex Exotic Currency Pair

Introduction

The CAD/TWD is an exotic currency pair where CAD is the Canadian Dollar, and the TWD is referred to as the Taiwan New Dollar. In this pair, CAD is the base currency, and the TWD is the quote currency, which means that the exchange rate for the pair shows the quantity of TWD that can be bought by 1 CAD. In this case, if the exchange rate for the pair is 21.864, then 1 CAD buys 21.864 TWD.

CAD/TWD Specification

Spread

In the forex market, the spread is considered a cost to the trader. It is the difference between the ‘bid’ and the ‘ask’ price. Here are the spread charges for ECN and STP brokers for CAD/TWD pair.

ECN: 29 pips | STP: 34 pips

Slippage

When trading forex, slippage occurs when the execution price is below or above the price at opening the trade. The primary causes of slippage are the brokers’ speed of execution and market volatility.

Trading Range in the CAD/TWD Pair

The trading range in forex is used to analyze the volatility of a currency pair across different timeframes. This analysis gives the trader a rough estimate of how much they stand to gain or lose by trading that pair over a given timeframe. For example, say the volatility of the CAD/TWD pair at the 1-hour timeframe is 20 pips. Then, a trader can anticipate to either profit or lose $91.4

The trading range for the CAD/TWD pair is shown below.

The Procedure to assess Pip Ranges

  1. Add the ATR indicator to your chart
  2. Set the period to 1
  3. Add a 200-period SMA to this indicator
  4. Shrink the chart so you can determine a larger period
  5. Select your desired timeframe
  6. Measure the floor level and set this value as the min
  7. Measure the level of the 200-period SMA and set this as the average
  8. Measure the peak levels and set this as Max.

CAD/TWD Cost as a Percentage of the Trading Range

For us to understand the trading costs associated with the volatility, we will determine the total cost for both ECN and STP accounts as a ratio of the above volatility.

ECN Model Account

Spread = 29 | Slippage = 2 | Trading fee = 1

Total cost = 32

STP Model Account

Spread = 34 | Slippage = 2 | Trading fee = 0

Total cost = 36

The Ideal Timeframe to Trade CAD/TWD

From the above analyses, we can conclude that it is costlier trading the CAD/TWD pair on shorter timeframes when volatility is low. Longer timeframes, i.e., the weekly and the monthly timeframes, have lesser trading costs. Therefore, it would be more profitable trading the CAD/TWD pair over longer timeframes.

However, for intraday traders, opening positions when the volatility is above the average will reduce the trading costs. More so, using forex limit orders instead of market orders will reduce the trading costs by eliminating the costs associated with slippage. Here’s an example.

ECN Account Using Limit Model Account

Total cost = Slippage + Spread + Trading fee

= 0 + 29 + 1 = 30

You can notice that using the limit orders significantly reduces the cost as a percentage of the trading range.

Categories
Forex Assets

The Forex Trader’s Guide to Protective Assets

A protective asset is a financial instrument that shows a stable change in price without drops and spikes, regardless of the macroeconomic and geopolitical situation. As such, this type of asset is in demand during the time of crisis. As profits are typically earned on price movements when trading Forex, you are probably wondering whether you should be trading with this type of asset. In this article, you will find out.

Protective assets are subject to the following requirements:

-Price stability is irrespective of the overall volatility of the market. Force majeure should not have a significant impact on protective assets. On the contrary, at the moment of force majeure, investors’ capital flows into protective assets, since they enjoy the greatest confidence in the event of instability.

-Protection against inflation. The higher the return, the higher the risk. That is why protective assets do not have high returns, but at least they must grow in price after inflation.

-Minimum exposure to price changes. That is, they should have the lowest volatility and the highest liquidity.

Instruments, which grow in price when another instrument is depreciating, are sometimes mistakenly referred to as protective assets. For example, natural gas is not exactly a safe haven for oil. This is because natural gas has its own fundamental elements influencing price and its correlation with oil prices is weak. The situation, when oil falls and gas grows, can be called coincidence.

Ideally, a protective asset should not depend on geopolitics and the global economy but should still be highly liquid. There is no ideal, but there are some assets that have more of these features than high-performance instruments. A trader has two options: he can add to the portfolio instruments with a negative correlation (if one instrument depreciates, while another is appreciated). Or you might consider buying protective assets. The second option is more reliable because the negative correlation does not always work.

A good period of analysis to consider is the long crisis of 2008-2009. Although many companies started IPOs after this period, still, at present, it is possible to find interesting charts to make a comparison.

Gold

It is a classic protection asset, where investors’ capital flows amid major economic problems. It is partly the result of a historical stereotype. The scarcity of resources, the demand of the industry are the main factors that ensure the stability of the gold price.

Before 2008, the growth in the price of gold futures had formed a view that this asset is the most reliable, compared to currencies, stocks, and other commodities. This stereotype was ruined during the 2008 crisis.

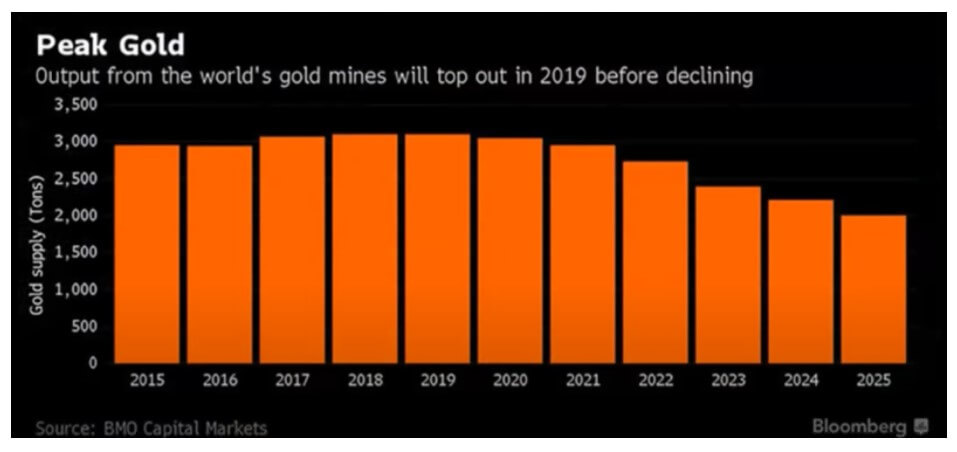
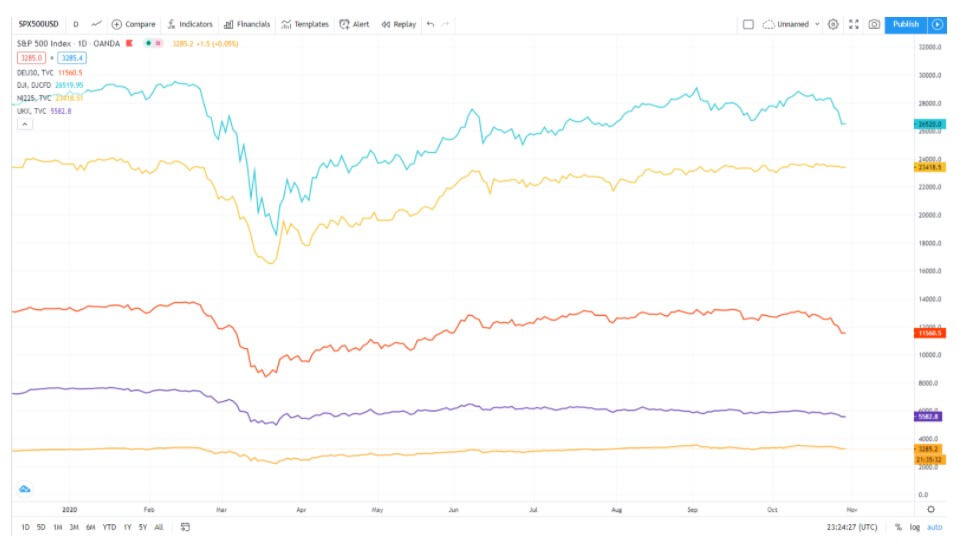
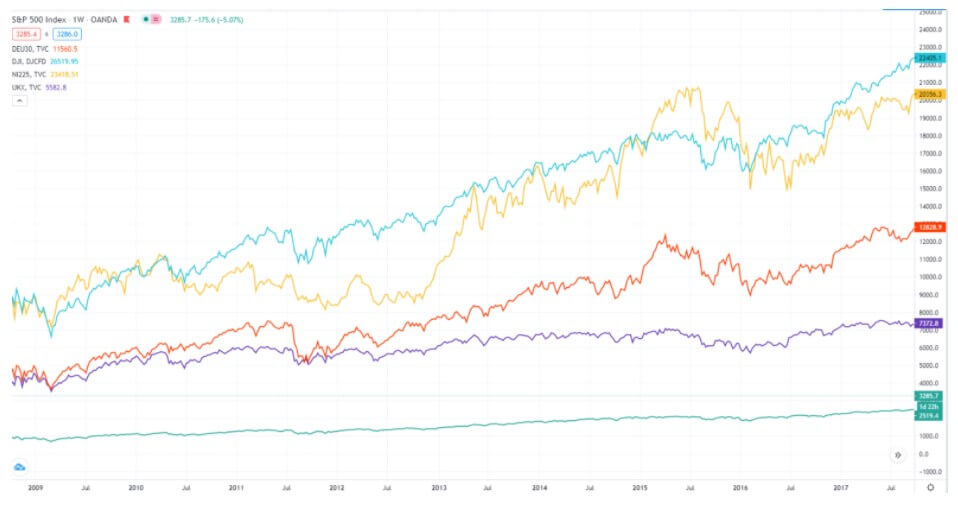
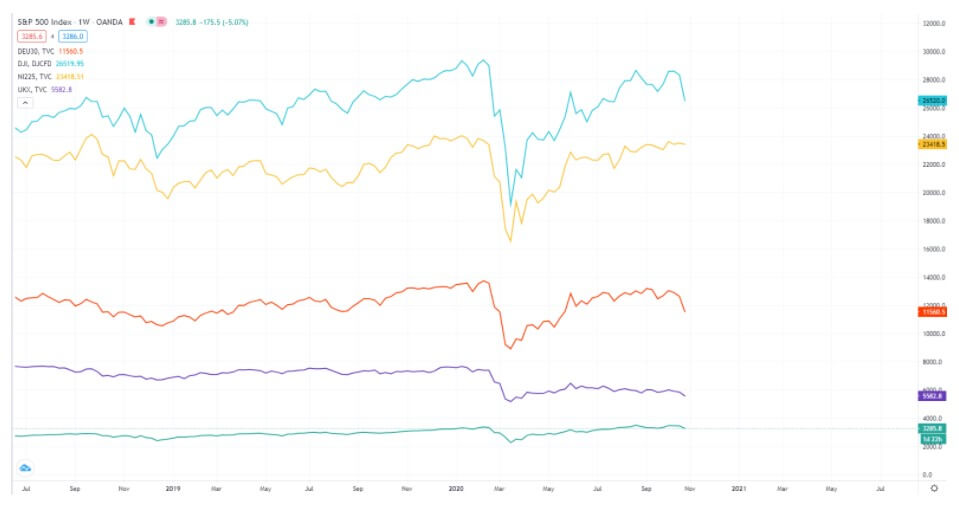
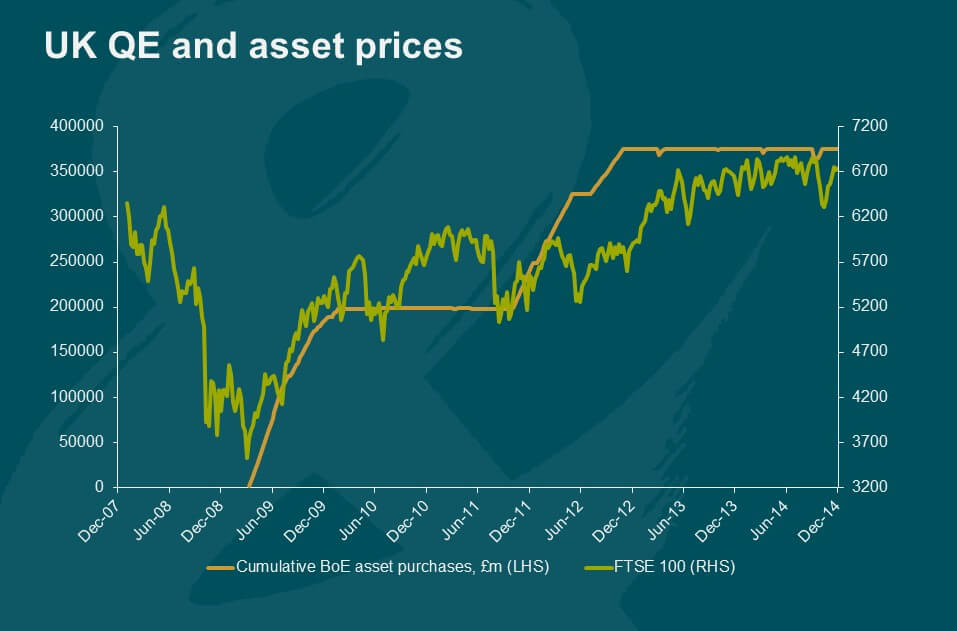
In the 2008-2009 crisis period, gold was also falling in value. And even with its peak growth in 2012, long-term investments were not the most profitable. As international stock markets recovered to pre-crisis levels, gold quickly devalued. It was at the end of 2018 that the stock markets collapsed. Even if we consider this situation as an example when gold was a safe asset, it is not convincing compared to the overall trend.

Conclusion. Gold can be considered a protective asset only during the time of the short-term economic crisis. Then investors’ money stays in the system, simply flowing from one market to another. But in the event of a global crisis, investors withdraw their money from all markets. As we have learned from history, gold is an asset that also falls during these times. And the long-term trend of gold does not look like a chart of a stable protective asset either.

Another problem with investments in gold is the form. It seems that the most accurate thing is not to invest in physical gold, the delivery margin reaches 20% – 30% (gold alloy tends to oxidize). You will need fairly large seed money to buy gold futures (from several thousand USD). There are also problems with taxes.

Protective Actions

Protective actions are actions whose price is relatively stable and have little or no response to a bearish trend. These values are not interesting to speculators, as they are not rising rapidly during a global bullish trend. These values have the following characteristics:

  • There is a demand for the company’s assets, regardless of the world situation.
  • The products are of strategic importance.
  • The companies do not have excellent financial performance, but they do have government support.

During global economic growth, investors pay attention to companies from developed economies, whose stocks during a crisis will quickly fall in price. So, protective assets are the shares of emerging market companies. The most promising industries in this regard are the mining industry (these are rare metals, diamonds) and power generation.

A good example will be some companies from Russia which is an emerging market. As mentioned above, the oil and gas industry is not a protective asset. After the fall in contributions in 2009, stocks did not return to the pre-crisis level. The crisis of 2008 did not affect the company very much. And even after the crisis, the investment was more than successful.

For developed countries, there is also a separate approach. It is based on the fact that even in a crisis, ordinary people will continue to buy food, and rich people will not yet be able to deny themselves luxury.

When most stocks were declining in 2008-09, McDonald’s shares, after a small decline, instead, increased in value. Note that there was no significant reduction at the end of 2018, as was the case with technology companies. For example, Apple stocks that passed the 2008 crisis quite easily showed a serious decline at the end of 2018. And IBM documents in 2008 fell by more than 30%. Tesco and Walmart, which represent the retail segment, have similar graphics to McDonald’s. In the future, stocks of these corporations declined sharply, so the shares of the consumer sector and the food sector are safer than the shares of retail companies.

Conclusion. There are no universal protective assets, and they can be different at different times. However, there are some values constantly increasing, as demonstrated in the example of McDonald’s.

It is important that we highlight that there is no single rule on how to identify a protection asset. The potential investor should review the stock chart of each company and analyse the behaviour of the quotes at the time of a prolonged crisis. Previous recommendations on which countries, industries should pay attention and which criteria should meet these values.

Important! Protective actions are less relevant to protective assets than gold or government bonds. Yes, they fall less during a crisis, they can produce losses when other values will increase at a different time. It makes sense to consider protective actions only for the period of a possible recession, then one must decide the actions of each company individually.

Investors should certainly not consider the actions of the oil and gas industry, technology, and biotechnology companies unless such companies are under the strict control of the government. Nor should you use second-tier stocks as protective assets, as investors generally dispose of them at the time of a crisis. The greater the capitalization of a company, the greater the probability that the company will receive state funds. Small-capitalization companies face high risk.

Government Bonds

Government bonds are also called sovereign bonds. Here we talk about one of the safest assets, although nothing is safe by default. First of all, these are US bonds, or treasury bonds, where the risk of default is almost zero. Some important moments:

-The priority of short-term bonds (less than 3 years). Long-term documents respond better to market volatility.

-The priority of values with a floating rate.

-The priority of government bonds in developed economies. Municipal bonds and emerging market bonds are considered to have low liquidity.

There is one drawback with government bonds, and that is their low profitability and that almost never exceeds inflation. But in a low market, a yielding asset is rare, and bonds can be an alternative to deposits.

Corporate bonds are not protective assets. During the crisis period, there is the largest number of bankruptcies of different companies, including large corporations. If knowing the above, you still want to add corporate bonds to your portfolio, focus on things like credit rating, the presence of foreign exchange earnings, and the possibility of government support. An alternative to individual debt securities is bond funds.

Currency

So far, the US dollar is one of the few currencies that analysts recommend adding to their investment portfolio in some way for diversification purposes. The confidence generated by this currency is very strong, even in spite of the growing size of the debt. The euro sinks more strongly in times of local or protracted economic problems; therefore it is not considered a protective asset.

In the course of a crisis, there is always a strong demand for the Swiss franc, but you have to know that there is a small problem with liquidity. For example, investors in Africa, India, or Russia will find it difficult to buy or sell it quickly.

The Japanese currency is also sometimes considered a protective asset. Previously, it really was, but now, when the country is trying to combat deflation for a year and, on the contrary, is looking for ways to weaken the national currency, it is not worth considering it as such.

Other Protective Assets

Real estate. Some analysts think that real estate can serve as a protective asset. Everything here is very relative. If tourist properties in the Mediterranean used to be in demand (for example, Spain), then, during the crisis, demand dropped drastically, and real estate prices also fell. You also need to know what the real estate service costs is (and rent doesn’t always cover them), so investment doesn’t look promising.

Investment funds and ETF. It can also be considered as a kind of protective asset, as they are often diversified. But, during a crisis, their coverage function is weakened: they are becoming cheaper along with other assets. These investments relieve the investor from responsibility for the formation of a balanced portfolio, but the risk of the fund manager’s error persists.

Deposits. They are considered the most reliable conservative investment vehicle. The banking system is backed by the State and the Central Bank, then, the probability of a large bank going bankrupt, even speaking in times of crisis, is quite small (although there are exceptions). The insurance funds fully or partially offset the deposit in case of force majeure.

Categories
Forex Assets

Forex Trader’s Guide to Agricultural Commodities

Agricultural commodities include items that revolve around crops and animals, making them an important source of nourishment for many people and animals in the world. These commodities can also play a role in industrial applications, such as the building of furniture, fabric for clothing, and skin and hair care products.

Many of these items can serve multiple purposes. For example, corn is food, but it is also used as an ingredient in fuel production. Beef can also be consumed, while other companies use other parts from the cow to make products. This sector also employees more than 1.3 billion people, which is nearly 20% of the entire world’s population. Even with the uncertainty of Forex trading, we know that humans will always have a need for agricultural commodities. In this article, we will provide a breakdown of each of the categories of industrial products and the driving forces behind their prices.

Cereal Grains

This category includes grains like oats, wheat, corn, barley, and rough rice. They serve as food sources for humans and animals. Some of these options, like corn, can be used in fuel. If you monitor the spread between one grain and another, it will give you a good idea of the values of one grain against another. Try Googling “What are the grain prices today?”

Oilseeds

Canola, cotton, palm oil, and soybeans are all examples of oilseeds because they have high oil content in their seeds. The meal from these crops can also be used in clothing and other industries. These are considered to be one of the most important crops in the world. 

Meat & Dairy

This category revolves around livestock and includes live animals sold for meat, hide, organs, bones, and other parts, or cuts of meat that are meant to be consumed. Dairy products are primarily used for cooking and include staples like milk, butter, whey, and cheese. 

Soft Commodities

Items in this category are farmed and are usually separated from cereal grains, oilseeds, meat, and dairy. Coffee, Cocoa, and Sugar are common examples. 

Miscellaneous Commodities

These commodities include items like lumber, rubber, and wool that don’t really fit into any of the above categories. Of course, these items serve multiple uses in different industries like clothing, building houses, and others. 

You might find yourself wondering whether you should add agricultural commodities to your trading portfolio. First, you should consider that the price of these products is driven by population growth, agricultural productivity, technology, demand for meat in China, and global warming. Population increase will create more of a demand for these items as the population increases to an expected 9 billion people in the next 20 years.

Agricultural productivity is growing in more developed countries, but it is lacking is less developed ones. Technology can help farmers figure out the best times to plant, monitor the weather, test livestock, and perform other useful tasks. China is the largest meat consumer in the world and that demand is also expected to increase with population growth. As for global warming, heatwaves might kill off crops as temperatures increase over time. This would obviously hurt crop production. 

Some other advantages of trading these products are high liquidity, transparent prices, leveraged trading options, and the fact that there are a lot of products to choose from. Of course, these products carry their risks just like any other forex instruments, so traders should be well-educated and prepared before investing in any asset.

Categories
Forex Assets

Trading The NZD/HKD Forex Exotic Currency Pair

Introduction

NZD represents the official currency of New Zealand, while HKD is the official currency of Hong Kong. It is an exotic-cross currency pair where NZD is the base currency, and HKD the quote currency. The price of NZDHKD determines the value of HKD, which is equivalent to one NZD. In other words, this pair represents 1 NZD per X HKD. For example, if the pair is trading at 5.14452, we would need about 5.1 HKD to purchase one NZD.

NZD/HKD Specification

Spread

To get the Spread value, we just have to subtract the Bid price from the Ask price. The value of the spread is set by a broker. However, the amount in pips depends on the type of execution model used for executing the trades.

Spread on ECN: 31 pips | Spread on STP: 35 pips

Fees

Like other financial markets, Forex has some fees that a trader needs to pay while they take a trade. Note that the broker does not take any fee on STP accounts, but a few fees are charged on ECN model accounts.

Slippage

The slippage is a set of pips formed by the difference between the demanded price by the trader and the execution price by the broker. The main reason for the occurrence of slippage is market volatility or the broker’s execution speed.

Trading Range in NZD/HKD

Procedure to assess Pip Ranges

  1. Add the ATR indicator to your chart
  2. Set the period to 1
  3. Add a 200-period SMA to this indicator
  4. Shrink the chart so you can assess a large time period
  5. Select your desired timeframe
  6. Measure the floor level and set this value as the min
  7. Measure the level of the 200-period SMA and set this as the average
  8. Measure the peak levels and set this as Max.

NZD/HKD Cost as a Percent of the Trading Range

The volatility values from the above table show how the cost varies with the change in volatility. The ratio between total cost and the volatility values reconverted into percentages to have a better outlook.

ECN Model Account 

Spread = 31 | Slippage = 5 | Trading fee = 8

Total cost = Spread + Slippage + Trading Fee

= 31 + 5 + 8

Total cost = 44

STP Model Account

Spread = 35 | Slippage = 1 | Trading fee = 0

Total cost = Spread + Slippage + Trading Fee

= 35 + 1 + 0 = 36

The Ideal way to trade the NZD/HKD

The NZDHKD is a pair with high liquidity. Therefore, trading this exotic currency pair seems to be feasible. We can see from the above table that the highest Percentage of values are barely above 100%. It means this currency pair is relatively less expensive to trade.

The most significant costs are in the hourly timeframe only, as the costs in 2H, 4H, and daily timeframes are also low. However, every trader should avoid the volatile market condition. Therefore, the best way to trade this pair is to look out for the possibilities to be on lower timeframes also while sticking to the average volatile level.

Also, traders can reduce the trading costs further by eliminating market orders and placing orders as ‘limit’ and ‘stop.’ In this case, slippage can completely be avoided. Please go through the below table to further understand this.

STP Model Account (Using Limit Orders)

Spread = 31 | Slippage = 0 | Trading fee = 0

Total cost = Spread + Slippage + Trading Fee

= 31 + 0 + 0 = 31 

Categories
Forex Assets

Forex Currency Pairs 101

You have probably heard about most of the available currencies such as the US Dollar, the British pound, and the Euro, the three of these currencies are traded within Forex as well as plenty of others. Each currency in the world has its own ISO code, this is often a three-letter abbreviation of the currency, on the rare occasion, this may be a four-letter abbreviation. The letters given to it are often related to the overall title of the currency, but in some cases such as with the Swiss Franc, it can be completely different as the Swiss Franc has CHF as its ISO.

We have outlined some of the major currencies below, there are of course a lot of other currencies available, however when you are starting out with trading and the foreign exchange markets, then you will most likely be concentrating on these slightly more major pairs.

So those are some of the main currencies, but when we trade in Forex, we are always trading one currency against another, these pairs of currencies are simply called currency pairs. They are the bread and butter and the buying and selling of these currency pairs is how we end up making money. So let’s have a look at what some of the main currency pairs that you should know and should be looking at trading when you are just starting out.

Major Pairs:

Euro Cross Pairs:

Pound Cross Pairs:

Yen Cross Pairs:

Other Cross Pairs:

Each currency has its own value that fluctuates up and down, the value of a US Dollar is $1, it will always be $1. However, $1 is not equal to £1. At the time of writing this £1 was worth almost exactly $1.26. So in the foreign exchange world, it would be written as GBP/USD = 1.26. It is always written as the base currency first, then the quote currency, and then the current exchange rate.

You are able to both buy and sell currencies, so let’s briefly look at what that means, thy can be summed up with a single sentence each:

Buy or Long = When you buy the base currency and sell the quote currency.

Short or Sell = When you sell the base currency and buy the quote currency.

So how do we make money? Let’s say we want to make a profit on this, we would buy into the pair, which means that we would be buying GBP with our USD for the value of 1.26 US Dollars to Great British Pounds. We would then hope that the value of your point would increase, so the exchange rate would move up to 1.27 or 1.28 (of course there are a  lot of extra decimals in there too). If that was to happen, when we sell back, we would have more dollars than we started with, giving us our overall profits.

That is in essence how the currency pairs work. Of course, there are far greater complications when we start looking at pairs that are completely different to our base currency, the good news is that you very rarely have to ever think about that, the broker that you are using will luckily be able to do all of the thinking and calculations for you, so all you need to look for is the fluctuations in the exchange rate between currency pairs. 

Hopefully, that has given you a little understanding of how things work, there’s a  lot to learn when it comes to trading, so it is good to sometimes keep things simple and to not give too much information at once. Take things one step at a time and you will manage to become successful in no time.


Categories
Forex Assets

Asset Analysis – Trading Costs Involved While Trading The CAD/AED Currency Pair

Introduction

CAD/AED is a Forex exotic currency pair, where CAD represents the currency of Canada, an AED is the currency of the UAE. In this exotic currency pair, CAD is the base first, and AED is the second currency.

Understanding CADAED

This pair’s price determines the value of AED, which is equivalent to one CAD. We can term it as 1 CAD per X numbers of AED. For example, if the CAD/AED pair’s value is at 2.8007; therefore, we need almost 2.8007 AED to buy one CAD.

CADAED Specification

Spread

In every financial market, Spread represents the difference between the Bid and Ask. It is usually a charge that is deducted by the forex broker. This value changes with the type of execution model.

Spread on ECN: 10 pips | Spread on STP: 15 pips

Fees

The trading fees in the forex market and stock market are the same. It is deducted from the traders’ accounts as soon as they open a new position. Note that STP accounts do not charge anything, but a few pips charges on ECN accounts.

Slippage

Slippage happens when price opens above or below the execution level. Slippage occurs because of two important reasons – market volatility and broker’s execution speed.

Trading Range in CADAED

Procedure to assess Pip Ranges

  1. Add the ATR indicator to your chart
  2. Set the period to 1
  3. Add a 200-period SMA to this indicator
  4. Shrink the chart so you can assess a large time period
  5. Select your desired timeframe
  6. Measure the floor level and set this value as the min
  7. Measure the level of the 200-period SMA and set this as the average
  8. Measure the peak levels and set this as Max.

CADAED Cost as a Percent of the Trading Range

The volatility values on the above table indicate how the cost varies with the change in market volatility. All we did is to get the ratio between the total cost and the volatility values and converted them into percentages.

ECN Model Account 

Spread = 10 | Slippage = 5 | Trading fee = 8

Total cost = Spread + Slippage + Trading Fee

= 10 + 5 + 8 = 23

STP Model Account

Spread = 10 | Slippage = 5 | Trading fee = 0

Total cost = Spread + Slippage + Trading Fee

= 10 + 5 + 0 = 15

The Ideal way to trade the CADAED

The CADAED is an exotic cross currency pair with higher volatility and liquidity. Because of this, traders may find it easy to trade in this pair. We can see that the percentage values above where the value did not move above 230% that represents a higher trading cost in the lower timeframe. However, when we move to the monthly timeframe, the average cost came to below 2%.

Therefore, trading intraday in this currency pair is risky due to the high trading cost. On the other hand, trading in a higher timeframe has less cost, but it requires a lot of patience and time. Overall, for every trader, it is recommended to stick on trading where the trading cost is at the average value.

Another way to reduce the cost is to place a pending order as ‘limit’ and ‘stop’ instead of ‘market.’ In that case, there will be no slippage in the calculation of the total costs. So, in our example, the overall cost will be reduced by five pips.

STP Model Account (Using limit orders) 

Spread = 10 | Slippage = 0 | Trading fee = 0

Total cost = Spread + Slippage + Trading Fee

= 10 + 0 + 0 = 10

Categories
Forex Assets

Analyzing The Costs Involved While Trading The CAD/NOK Exotic Pair

Introduction

CADNOK is a Forex currency pair, where CAD is the official currency of Canada, and NOK is the native currency of Norway. In this exotic pair, CAD is the base currency, and NOK is the quote currency.

Understanding CADNOK

This pair’s price determines the value of NOK, which is equivalent to one CAD. We can quote it as 1 CAD per X numbers of NOK. For example, if the CADNOK pair’s value is at 6.7135, it means we need almost 6.7135 NOK to buy one CAD.

CADNOK Specification

Spread

In forex trading, Spread indicates the difference between the Bid price and the Ask prices. Traders don’t have to do anything with this as it is deducted by the broker. This value changes with the type of execution model used for executing the trades. Below are the ECN and STP spread values of this currency pair.

Spread on ECN: 39 pips | Spread on STP: 44 pips

Fees

The trading fees that forex brokers take are similar to other financial markets. It is deducted from the traders’ accounts when they take a trade. Note that STP accounts do not take any charge, but a few pips are charged in ECN accounts.

Slippage

Slippage happens when a trader opens a trade at a price, but it opens at another price by expanding the Spread. The main reason to occur slippage is the market volatility and the broker’s execution speed.

Trading Range in CADNOK

The trading range is the representation of the minimum, average, and the maximum volatility of this pair on the 1H, 4H, 1D, 1W, and 1M timeframe. Using these values, we can assess our profit/loss margin of trade. Hence, this proves to be a helpful risk management tool for all types of traders.

Procedure to assess Pip Ranges

  1. Add the ATR indicator to your chart
  2. Set the period to 1
  3. Add a 200-period SMA to this indicator
  4. Shrink the chart so you can assess a large time period
  5. Select your desired timeframe
  6. Measure the floor level and set this value as the min
  7. Measure the level of the 200-period SMA and set this as the average
  8. Measure the peak levels and set this as Max.

CADNOK Cost as a Percent of the Trading Range

If we look at the volatility values from the above table, we can see how the cost changes with the change in volatility. We have provided the ratio between the cost and the volatility values into percentages.

ECN Model Account 

Spread = 39 | Slippage = 5 | Trading fee = 8

Total cost = Spread + Slippage + Trading Fee

= 39 + 5 + 8

Total cost = 52

STP Model Account

Spread = 39 | Slippage = 5 | Trading fee = 0

Total cost = Spread + Slippage + Trading Fee

= 39 + 5 + 0

Total cost = 44

The Ideal way to trade the CADNOK

The CADNOK is an exotic currency pair that has enough liquidity. As a result, traders may find it easy to trade in this exotic currency pair. The percentage values from the above table did not move above 138%, which is an indication of less volatility. However, the Percentage of trading cost is lower in the higher timeframe.

Therefore, traders should be cautious to determine the price where trading is suitable. An increase in volatility is risky, while the decrease in volatility is less profitable. Therefore, the best time to trade in this pair is when the volatility remains at the average value.

Furthermore, another way to reduce the cost is to place a pending order as ‘limit’ and ‘stop’ instead of ‘market.’ In that case, the slippage will not be considered in the calculation of the total costs. So, the total cost will be reduced by five pips.

STP Account Using Limit Model Account

Spread = 39 | Slippage = 0 | Trading fee = 0

Total cost = Spread + Slippage + Trading Fee

= 39 + 0 + 0

Total cost = 39

Categories
Beginners Forex Education Forex Assets

Intrinsic Asset Value Explained

Intrinsic value is a noteworthy term in the forex world as it refers to the measurement of what an asset is worth. Rather than referring to the simple trading market price of the asset, intrinsic value is calculated using more factors, some of which can be difficult to measure accurately. This gives one an overall idea of how a company is performing, along with the underlying value of the company and how much cash is flowing through it. Traders can then determine if the asset is overbought or oversold.

When measuring intrinsic value, there are two types of measurements:

  • Quantitative factors can be measured with hard numbers. This could include financial reports, profits, or any other statistics that can be accurately measured and represented with numbers.
  • Qualitative factors are more interpretive. Traders look at the company’s business model, what sets the business apart, governance, target markets and seasons, the quality of the company’s leaders, and other data that gives one an idea of the company’s qualities and chances of success.

Most traders take both quantitative and qualitative factors into consideration when determining a company’s intrinsic value because both offer important details that give an overall idea of how successful the company is. Many financial analysts have broken this down into effective mathematical models so that these factors can be measured in the most accurate way possible. While this makes the process more accurate, determining a company’s value is still subjective. One trader might find a business model to be solid, while another might feel that it is lacking, for example. These details can lead to differences in opinion. 

There are some popular calculation methods that are used by many traders, including the discounted cash flow (DCF) model, which looks at the company’s free cash flow and the weighted average cost of capital. The WACC accounts for the time value of money before then discounts future cash flow to the present. This system predicts the rate of return and future revenue streams for a company. 

The goal of measuring the intrinsic value for a company is to decide if an asset is overbought or oversold. Investors then make decisions about whether to buy or sell, depending on whether the stock is expected to rise in price or decline.  

Judging the intrinsic value of a company is subjective, but many traders have broken the process down to mathematical calculations that give good results. Most traders look at factors that can be measured with hard numbers, like financial reports, along with more interpretive data about a company’s target audience and other factors. Current events can also affect the intrinsic value of a company. For example, if a product launch fails or a major name in a company is arrested, the price is likely to fall. If you often invest in stocks, it is important to be aware of intrinsic value and how it can affect prices. Those that don’t want to keep up with this themselves should know that many successful financial investors publish their own intrinsic value calculations online for their followers.

Categories
Beginners Forex Education Forex Assets

Is the Value of the US Dollar Set to Decline?

Currently, the nation is still in the midst of the Coronavirus pandemic. Although there was some hope that precautions like masks and social distancing would lower the number of infected Americans by the summer, infection rates continue to rise with no end in sight. These trying times are also affecting the US economy and are forecasted to lower the value of the US dollar, which will affect forex traders across the globe. Here’s what you need to know:

  • The US government previously approved an economic relief package worth $2.2 trillion dollars in March of 2020
  • As the increased unemployment benefits are set to expire soon, the government is pressured to release another economic relief package to help many Americans that are still struggling with their mortgage or rent payments, bills, and to get by.
  • Another push for the economic rescue package comes from Americans that have been hit by reduced work hours. These people don’t qualify for the unemployment money, even though they are bringing home less money than usual, often significantly less. 

Due to these issues, the US Congress is currently considering another economic rescue payment. The exact figure of the proposed amount is in the debate, although it seems as though the package will total at least $1 trillion dollars. Some politicians are pushing for a package that would provide more relief than the previous one, with an estimated total of around $3 trillion. While the bigger package would contribute more to the US economy’s current debt, one should remember that the US government is already $23 trillion in debt.

When considering what can change the value of a currency, government debt is one of the top factors. Although only some of this debt is new, many investors previously trusted the Federal Reserve to work things out based on the recent economic expansion. Now, however, investors are beginning to doubt that the Federal Reserve can shoulder the burden as debt continues to climb, the US relationship with Germany declines, and some other world interactions that seem destructive are taking place. 

The bottom line is that investors need to remain up to date on current news and to be highly aware of any changes to the US dollar’s value, especially when taking part in forex trading. Several factors might cast a bleak light on the dollar’s value, including increased government spending, the current pandemic, and falling uncertainty surrounding the Federal Reserve and the US government. This doesn’t mean that you should avoid trading altogether, only that you should stay informed and pay close attention to the news during these times.

Categories
Forex Assets

Different Settings for Different Currency Pairs

A few days ago we had a debate with one of our trainees about his trading system. He had a very interesting observation. After the back-testing, he noticed that his system works better on certain currency pairs while other currency pairs go short. So he was scratching his forehead and asking himself should he change the settings on his algorithm and make certain pairs perform better than before. He wanted to find a way to tweak the settings just for pairs that underperform and make them produce more pips. Is it a good idea to make adjustments just on the bad pairs so we can amplify efficiency?

This is not the first time we get a question like this and we are going to try to bring our experience to the table because we can only debate from that standpoint. With this topic, there really is no right answer. If we are going to track our results, currency pair by currency pair, we are going to find out that certain currency pairs absolutely outperform others. Naturally, we might find currency pairs that are normally giving us negative results over time and cutting into our bottom line.

So what can we do about this? We are all aware of the overall ridiculousness of people thinking that in the daily time frame, certain pairs have certain personalities that other pairs don’t. On the daily time frame currency pairs don’t have their own unique movements. Just because some pairs are acting one way at this moment doesn’t mean that they will stay in that course forever. These things will change.

Surely, we have some currency pairs that are more friendly to trade. Those pairs trend more often and they chop a lot less, for example, the EUR/USD. If we take a look at what the EUR/USD did in 2017 and much of 2018, it trended pretty nicely and it was a good pair to be part of. The way these pairs move over the time is going to change and because we have tried to focus on this, it just wasn’t worth of effort and time we’ve been sitting in front of our system and adjusting the settings to our algorithm just for specific currency pairs because of the way they were moving at that specific moment.

We believe that this kind of approach is not going to do any significant favor to us, simply because of the unpredictable movements of currency pairs. But on the other hand, it is not like that some pairs have unique personalities but surely some tend better than others and some tend worse than others. Long ago when we noticed this sensation, we tried to change settings for the ones that trend worse and see what is going to happen. The idea was to try to make our system more friendly to them. In the end, it just serves us better to keep everything consistent.

A pretty great algorithm with really great optimized settings could be an awesome thing on its own. Super cool algorithm with good settings that stay the way they are, should and will work no matter what currency pair we are trading. If it struggles on certain pairs right now or throughout back-testing periods we might consider just wait. There has not been a currency pair in recorded history that is just been a genuinely lousy mover and just stayed that way. We believe that it’s not about you adjusting your system to it, it is going to adjust on its own. Again, if we have a pretty good system in place we are going to be there to catch it when it does. Remember traders, at the end of the day most systems can catch trends. It is just a matter of where. The one thing we strongly aim to do is to cut our losses and a good system should do that. It’s just a matter of weathering the storm until all comes back our way again. We need to take a zoomed-out approach to this and realize that it’s not a matter that certain currency pairs are taking down our bottom line. What truly matters at the end of the day is what the whole thing does.

Losses are the inevitable part of forex trading and we need to understand that currency pairs that don’t do well are just going to be on our trading landscapes probably always. If we have currency pairs that are just totally eating our accounts over and over again no matter what we do, we might consider eliminating those pairs from our systems for good. These are extreme and unusual situations when we need to act like this better than staying frustrated in front of our trading systems after multiple times where this just continues to be the case with certain currency pairs.

Anything different than that could be the matter of waiting and allowing these pairs to correct their course. But if this issue is simply constant with certain pairs and does not get any better than the only logical smart thing to do is just to stop trading those currency pairs. Unfortunately, we need to cut them off. If we run a business and we have an employee that is constantly stealing from us over the past 5 years then we should get rid of him as soon as possible. It is not a big deal to admit to yourself that after a certain period of time a certain situation is obviously beyond the repair.

Here we all believe in discipline and patience and we value them as one of the highest priorities but on those rare occurrences where it just never-ever gets good, we shouldn’t waste our time sitting there and hoping it will be good. We have a lot of other currency pairs we should trade with and we’ll be perfectly fine. One more thing we want to emphasize here is that if we were going to cut some of the weakest pairs we should wait until forward-testing them first. This is because forward-testing could expose mistakes we did in back-testing and this might be one final chance for those pairs that tend to underperform. If they still don’t do right you guys know what your next step should be.

Categories
Beginners Forex Education Forex Assets

The Forex Trader’s Guide to Facebook

Facebook is currently the top social media platform in the world, pulling in more users than other media giants like Twitter, WhatsApp, Instagram, Twitter, and other names you’ve heard of before. The truth is that most of us have a Facebook account, and most of the people that we know do too. It’s almost surprising to find that someone you’re searching for doesn’t have a Facebook account, which provides reassurance that Facebook will continue to attract massive amounts of users, both young and old. Even grandparents have joined the trend and learned to use Facebook to connect with friends and family.

Despite its popularity, Facebook is expected to see a decline in revenue resulting from the coronavirus pandemic. Its true that many of us are stuck at home and might spend more time using the platform; however, some of the company’s revenue sources from other outlets like ads are expected to drop as these companies reel from the profit loss caused by the pandemic.

In order to deal with this, Facebook will either have to offer more ad space, which will bombard users with ads, or the company will need to keep their ad space the same and reduce prices so that companies can afford it. Either way, Facebook is expected to take a loss in the ad department. The current outlook is that the stock’s value will drop by a few percentage points, although it is still too soon to tell. With ads failing to produce as much revenue, the company has stated that many of the services that are being used don’t actually bring in any revenue.

Despite the expected drop in value on the horizon, we do have some good news for those that like Facebook. In the same ways that coronavirus has hurt the company’s revenue, it has also attracted new users and gotten some people into using the platform even though they were previously uninterested. Statistics show that people in Italy are spending up to 70% more time on the app. Once the pandemic is over and things return to normal, Facebook will likely see their profits go up thanks to the increased user base that will allow more people to view ads and use services that bring them revenue.

Potential investors also need to know that Facebook has more than $54 billion dollars in cash and resources, which will help soften or eliminate some of the blow from the current pandemic. This will allow to company to keep many of its workers employed and to potentially hire experienced workers that have been laid off by other companies.

There are some recent developments that produce mixed feelings about Facebook as well. This platform isn’t entirely open to free speech – which is a good and bad thing. It’s good because Facebook won’t allow you to post certain offensive things, but many users believe that the platform goes too far with its monitoring. Users find themselves in “Facebook jail” for sharing or posting certain content if it gets reported. This is basically like a timeout that keeps you from using your account. Facebook has also introduced fact-checking lately and will add comments to posts or even delete things that are deemed inaccurate by the fact-checkers.

Some of this has been the subject of controversy, as fact-checking often revolves around politics. Of course, Twitter has also taken to fact-checking, and the site even fact-checked the president. Some users find these features to be wholesome, while others feel as though they are too restrictive. Lately, the #StopHateForProfit movement has been protesting the platform’s policies, with many retailers deciding to pull their ads from Facebook altogether. Eddie Bauer is one of the most recent companies to drop their ads from Facebook and only time will tell how much momentum this movement will attract

The market has been experiencing increased uncertainty thanks to the coronavirus pandemic. This has affected things on a global scale and provides traders with good and bad opportunities. Right now, Facebook’s stock is down, meaning that it is probably a good idea to invest. It’s true that things are volatile, but Facebook’s stock is expected to rapidly increase in value as things return to normal, thanks to their increased customer base and the return of their ad-driven profits. If you decide to invest in Facebook, be sure to stay updated on company news and to watch revenue reports, while also considering other information to make sure that the stock’s predicted growth does not change. Be sure to stay updated on the recent protests against the company as well, as this could affect future profits if more companies jump on the bandwagon. If all of this seems like too much, then perhaps you should wait to invest until things calm down.

Categories
Beginners Forex Education Forex Assets

Trading the AUD/NZD Currency Pair

Most traders nowadays trade pairs involving currencies such as EUR and USD because they have found such currencies to provide them with the best results. However, once paired, some of the other major currencies we trade in the forex market are said to be extremely profitable trades due to their unique traits. The AUD/NZD currency pair, for example, has been praised by a portion of professional traders who have recognized its great potential. According to these supporters, the nature of this currency pair, or what it is and what it is not in other words, is what makes it so different from all other combinations, making it to some traders’ list of favorites.

If you are a technical trader who keeps looking for ways to evade news and hectic market activity knocking traders’ stop losses, you may find this currency pair particularly interesting despite what you may have heard about it before. Especially during the times of some important events (such as Brexit) or the involvement of some important individuals and organizations (e.g. the European Union), you will find how some of the more popular currency pairs, such as EUR/GBP and GPP/CHF, are heavily encumbered by the surrounding hype and needless news popping up every minute or so. In this case, traders are faced with a few options: give in to the upcoming news events, avoid trading news, and/or avoid trading the affected currencies. What is more, with trading other currency pairs comes the danger of encounter some really choppy periods we can see for ourselves if we take a look at the daily chart. Solidation, on the other hand, is a process traders mostly accept as part of the currency market, but some other downsides of trading popular currency pairs may not always be shared transparently and objectively through all available sources of educational material.

There are quite a few reasons why traders may eventually learn to enjoy trading the AUD/NZD currency pair. Firstly, the pair in question does not involve USD, the currency that is heavily monitored by the big banks whose impact on the market is profound. Secondly, both AUD and NZD are risk-on currencies, which makes trading much easier. Some other currency pairs such as AUD/JPY or EUR/USD entail the risk-on/risk-off challenge, which ties the forex traders close to the activity in the stock market. While trading risk-on/risk-off pairs the market moves exceptionally violently and this may overthrow almost any technical expertise and, thus, affect traders. By entering such trades, you are in fact taking on the risk of not having much control because of dealing with external factors. However, when you are trading two currencies which are both risk-on, you are to an extent trading a pair with no conflicting agendas.

With AUD and NZD being both risk-on currencies, you can feel at ease knowing that you are in fact trading currencies that are both heading in the same direction, further eliminating your list of external factors you ought to be concerned about. Therefore, as you are trading AUD against NZD, you are trading a pair without needing to worry about any derailment on the path to securing your pips. What is more, despite these currencies’ similarities, they still do not exhibit much correlation in the sense that traders sometimes feel annoyed when both currencies go up and down at the same time. In such cases, the correlating movement directly impedes trading as traders cannot trade until this unnerving parallel movement comes to an end. Luckily, while the AUD/NZD pair can at times display similar behavior, it hardly occurs as often as it does with some other currency pairs.

With regard to news, the forex traders who are trading this pair feel relieved because most news comes early in the trading day. Experienced traders using the daily chart who are fond of the AUD/NZD pair claim to trade approximately 20 minutes before the daily candle closes. Such an approach typically leaves them with several hours before any relevant news comes out. In case they find the news to be going against them, they can then still have the remaining 20 hours for the price to take a different turn. According to those who are used to trading the AUD/NZD, many times the price overacts to the news but eventually corrects itself. Should the news, therefore, appear to be negative in any way, traders need not worry since the price often either returns to its initial position or takes the direction the trader favors as the close of the candle approaches.

If we compare this pair with the ones involving USD, we should take into consideration the factor of time, which is in that case reduced to only a few hours. USD-based trades entail a considerably limited amount of time for the price to change and end up going the way traders may need them to. AUD/NZD, however, does not pose a challenge in this regard due to the fact that price generally either trends or consolidates. Even if consolidation worries you, professional traders say how a good choice of a volume indicator can help traders evade most consolidation patterns even though this pair is more likely to trend than cause problems. The chart below reflects how this currency pair is not prone to creating any choppy trends we may witness in some other pairs’ charts. Nevertheless, even if you find yourself trapped in one of such unfavorable trend, experts affirm that the result would not be more than one or two losses. They also add that traders should not fear these areas in the chart because if you keep trading, such losses would eventually be eliminated, unlike with some other currency pairs.

The EUR/USD chart reflecting the same period leaves an entirely different impression. Not only is the price moving too rapidly, but traders can hardly make a profit equal to that of AUD/NZD. By relying on a useful trend indicator, you will be able to know exactly when you should start trading, thus avoiding periods of price consolidation. When a chart is too choppy and the price is moving in a hectic manner, even the best indicators may not be able to detect the activity on the chart. You can, therefore, receive false signals and take unnecessary losses just by trading a currency pair that is prone to these erratic movements. Luckily this is more common for pairs such as EUR/USD than it is for the AUD/NZD currency pair. If your system can handle trading other currency pairs, rest assured that it will take you through AUD/NZD trades with ease. Nonetheless, this does not imply that you should not have a set plan for this currency pair regardless of the benefits that naturally come along.


Traders should primarily be prepared to take each trade for which they get a signal even though they may at times get several signals at the same time. Should you need to decide whether to trade AUD/NZD long and AUD/JPY long with a 2% risk, professional traders would advise you to enter the AUD/NZD trade without splitting the risk because of the increased chance of winning. Even though you are taking on the entire risk on one currency pair, understand that the likelihood of winning is much greater. What is more, even when you are testing your system, you can skip this currency pair because it commonly provides favorable trading conditions. Therefore, if you would like how your system operates on some more difficult currencies, you can test USD pairs, but testing AUD/NZD is assumed to be needless because of everything we have discussed earlier. You can also test AUD/NZD first to assess your algorithm because, if it does not work properly with this currency pair, it is much more likely to cause a disaster with some other currency pairs.

It seems that AUD/NZD is not talked about at great lengths in forex traders’ favored media, but the sources that do go into details appear to be extremely satisfied with the results they get from trading this currency pair. Some professional traders even say how the only reason this pair makes the second (and not the first) place is that they cannot enjoy any giant moves with AUD/NZD. Traders’ experiences and trading methods may differ, but this article still reflects an innovative approach to trading and making use of the two currencies. If you have yet to test this currency pair, you will hopefully discover the same benefits professional traders claim to exist, finding reasons to keep trading AUD/NZD. Last but not least, whether you learn to love AUD/NZD for the ability to test your algorithm or the opportunity to avoid choppy trends, trading this currency pair will surely be an interesting experience, especially for those of you who favor calm waters over some news-heavier or more unpredictable currency pairs.

Categories
Forex Assets

Analyzing the Trading Costs on ‘NZD/CZK’

Introduction

NZD/CZK is the abbreviation for the Euro Area’s Euro against the Czech Koruna. This pair is considered an exotic-cross currency pair. Here, the NZD is the base (first) currency, and the CZK is the quote (second) currency. NDZ is the official currency used in New Zealand, while CZK is the native currency of the Czech Republic.

Understanding NZD/CZK

The price of this pair in the foreign exchange market defines the value of CZK equivalent to one NZD. It is quoted as 1 NZD per X CZK. So, if the value of this pair is 14.8124, these many Korunas are required to purchase one NZD.

Spread

Spread is the mathematical difference between the bid and the asking price offered by the broker. This value is distinct in the ECN account model and STP account model. An approximate value for NZD/CZK pair is given below.

ECN: 43 pips | STP: 48 pips

Fees

The fee is the price/compensation that one pays for the trade. There are no charges on STP accounts, but a few additional pips are levied on ECN accounts.

Slippage

Slippage is a variation between the value proposed by the trader, and the trader indeed received from the broker.

Trading Range in NZD/CZK

The tabular interpretation of the pip movement of a currency pair in separate timeframes is called as the trading range is the. These values are helpful in influencing the profit that can be produced from a trade before-hand. To uncover the value, you must multiply the below volatility price with the pip value of this pair.

Procedure to assess Pip Ranges

  1. Add the ATR indicator to your chart
  2. Set the period to 1
  3. Add a 200-period SMA to this indicator
  4. Shrink the chart so you can assess a large time period
  5. Select your desired timeframe
  6. Measure the floor level and set this value as the min
  7. Measure the level of the 200-period SMA and set this as the average
  8. Measure the peak levels and set this as Max.

NZD/CZK Cost as a Percent of the Trading Range

Trading Range is the interpretation of the total price variation of trades for distinct timeframes and volatilities. The values are achieved by discovering the ratio amongst the total price and the volatility value; it is expressed as a percentage.

ECN Model Account

Spread = 43 | Slippage = 5 |Trading fee = 8

Total cost = Slippage + Spread + Trading Fee = 3 + 43 + 8 = 56 


STP Model Account

Spread = 48 | Slippage = 5 | Trading fee = 0

Total cost = Slippage + Spread + Trading Fee = 5 + 48 + 0 = 53

Trading the NZD/CZK

The bigger the percentage values, the higher is the price on the trade. From the preceding tables, we can see that the values are sizeable in the min column and relatively less significant in the maximum column. This means that the prices are high when the volatility of the market is low.

It is neither suitable to trade when the market’s volatility is elevated nor when the costs are high. To balance out between both these aspects, it is perfect to trade when the volatility of the pair is in the array of the average values.

Additionally, to decrease your costs even beyond, you may place trades using limit orders as a substitute for market orders. In executing so, the slippage will not be involved in the computation of the total costs. And this will put down the cost of the trades by a sizeable number. An example of the same is given below.

STP Model Account (Using Limit Orders)

Spread = 48 | Slippage = 0 |Trading fee = 0

Total cost = Slippage + Spread + Trading Fee = 0 + 48 + 0 = 48

Categories
Forex Assets

NZD/PLN – Analyzing This Exotic Forex Currency Pair

Introduction

NZD/PLN is the short form of the currency pair New Zealand dollar vs. Polish Zloty. Here, the New Zealand dollar (NZD) is the base currency, and the Polish Zloty (PLN) is the quote currency. In this article, we intend to comprehend everything you need to know about trading this currency.

Understanding NZD/PLN

The price of NZD/PLN signifies the value of the Polish Zloty corresponding to one New Zealand Dollar. It is estimated as 1 NZD (New Zealand Dollar) per X PLN (Polish Zloty). So, if the market value of NZD/PLN is 2.4940, these many Polish Zloty are required to buy one NZ dollar.

Spread

The distinction between the ask & bid costs is recognized as the spread. It changes with the implementation model used by the stockbrokers. Further down are the spreads for NZD/PLN currency pairs in both ECN account models & STP account models:

ECN: 30 pips | STP: 35 pips

Fees

There are certain charges levied by the broker to open every spot in the trade. These charges can be referred to as the commission or fees applicable to the trade. Note that these charges are only applicable to the ECN accounts and not on STP accounts. However, a few additional pips are changed on STP account models.

Slippage

Due to high market volatility and the broker’s slow implementation speed, slippage is common. It is a variance in price intended by the trader and price implemented by the broker.

Trading Range in NZD/PLN

The trading range is essentially a tabular interpretation of the pip movement in the NZD/PLN currency pair for distinct timeframes. These figures can be used to ascertain the trader’s risk as it helps us determines the approx. gain/loss that can be incurred on a trade.

Procedure to assess Pip Ranges

  1. Add the ATR indicator to your chart
  2. Set the period to 1
  3. Add a 200-period SMA to this indicator
  4. Shrink the chart so you can assess a large time period
  5. Select your desired timeframe
  6. Measure the floor level and set this value as the min
  7. Measure the level of the 200-period SMA and set this as the average
  8. Measure the peak levels and set this as Max.

NZD/PLN Cost as a Percent of the Trading Range

The total cost consists of slippage, trading fee, and the spread. This fluctuates with the volatility of the market. Therefore, traders need to place themselves to avoid paying high costs. Below is a table demonstrating the variation in the costs for various values of volatility.

ECN Model Account

Spread = 30 | Slippage = 5 |Trading fee = 8

Total cost = Slippage + Spread + Trading Fee = 5 + 30 + 8 = 43 


STP Model Account

Spread = 35 | Slippage = 5 | Trading fee = 0

Total cost = Slippage + Spread + Trading Fee = 5 + 35 + 0 = 40

The Ideal way to trade the NZD/NOK

NZD/PLN is an exotic-cross currency pair. In this case, we can see, the average pip movement in 1hr timeframe is 46, which signifies higher volatility. The smaller the volatility, the higher is the risk, and lesser is the cost of the trade and the other way around. For example, we can see from the trading range that when the pip movement is lesser, the charge is higher, and when the pip movement is higher, the charge is smaller.

To further decrease our costs of trade, the costs can be reduced even more by placing orders as a limit or stop as an alternative to the market orders. In executing so, the slippage will become zero and will lower the total cost of the trade further. In doing so, the slippage will be eliminated from the computation from the total costs. And this will assist us in decreasing the trading cost by a significant margin. An instance of the same is given below using the STP model account.

STP Model Account (Using Limit Orders)

Spread = 35 | Slippage = 0 | Trading fee = 0

Total cost = Slippage + Spread + Trading Fee = 0 + 35 + 0 = 35

Categories
Forex Assets

Asset Analysis – Comprehending The NZD/NOK Exotic Forex Pair

Introduction

NZD/NOK is the abbreviation for the currency pair New Zealand dollar versus the Norwegian Krone. It is referred to as an exotic cross-currency pair. In this case, NZD is the base currency, and NOK is the quote currency. In this article, we shall learn about everything you need to know about this currency.

Comprehending NZD/NOK

Understanding the value of a currency pair is simple. The value of NZD/NOK verifies the Norwegian Krone that must be paid to buy one New Zealand dollar. It quoted as 1 NZD per X NOK. For instance, if the current value of NZD/NOK is 6.0549, then 6.0549 NOK is required to buy one NZD.

Spread

Spread is the keyway through which stockbrokers make income. The selling price and buying price are different; the distinction between these prices is termed as the spread. It ranges from broker to broker and their implementation type. Below are the spreads for NZD/NOK currency pairs in both ECN & STP account models:

ECN: 20 pips | STP: 25 pips

Fees

For every execution, there is a cost levied by the broker. This cost is also indicated as the commission/fee on a trade. This fee/commission does not apply to STP accounts; however, a few additional pips are charged.

Slippage

Slippage is the difference in the price executed by you and the price you indeed received. It occurs on market orders. Slippage varies on two factors:

  • Market’s volatility
  • Broker’s execution speed

Trading Range in NZD/NOK

The trading range is a tabular description of the pip movement in a currency pair in a variety of timeframes. These values help in evaluating the risk-on trade as it defines the minimum, average, and maximum profit that can be made on a trade.

Procedure to assess Pip Ranges

  1. Add the ATR indicator to your chart
  2. Set the period to 1
  3. Add a 200-period SMA to this indicator
  4. Shrink the chart so you can assess a large time period
  5. Select your desired timeframe
  6. Measure the floor level and set this value as the min
  7. Measure the level of the 200-period SMA and set this as the average
  8. Measure the peak levels and set this as Max.

NZD/NOK Cost as a Percent of the Trading Range

The total cost of the trade shifts/changes based on the volatility of the market; hence we must figure out the instances when the costs are less to place ourselves in the market. The table below exhibits the variation in the costs based on the change in the market’s volatility.

Note: The ratio signifies the relative scale of costs and not the stable costs on the trade.

ECN Model Account

Spread = 20 | Slippage = 5 |Trading fee = 8

Total cost = Slippage + Spread + Trading Fee = 5 + 20 + 8 = 33 

STP Model Account

Spread = 25 | Slippage = 5 | Trading fee = 0

Total cost = Slippage + Spread + Trading Fee = 5 + 25 + 0 = 30

The Ideal way to trade the NZD/NOK

NZD/NOK is an exotic currency pair, and hence we can see, the average pip movement in 1hr timeframe is 120, which indicates higher volatility. The greater the volatility, the higher is the risk, and smaller is the cost of the trade and the other way around. Taking an instance, we can see from the trading range that when the pip movement is smaller, the charge is elevated, and when the pip movement is higher, the charge is lower.

To further decrease our costs of trade, we may place trades using limit orders as an alternative to the market orders. In the below table, we will see the interpretation of the cost percentages when limit orders are applied. As we can see, the slippage is zero. In doing so, the slippage will be excluded from the calculation from the total costs. And this will help us in lowering the trading cost by a sizeable margin. An example of the same is given below.

STP Model Account (Using Limit Orders)

Spread = 25 | Slippage = 0 | Trading fee = 0

Total cost = Slippage + Spread + Trading Fee = 0 + 25 + 0 = 25

Categories
Forex Assets

How Expensive Is It To Trade The CHF/SAR Forex Exotic Pair?

Introduction

CHF/SAR is the acronym for the Swiss Franc against the Saudi Riyal. It is classed as an exotic currency pair as it usually has moderate trading volume. In this case, the Swiss Franc (on the left) is the base currency, and the Saudi Riyal (on the right) is the quote currency. The SAR (Saudi Riyal) is the official currency of Saudi Arabia, and one SAR is divided into 100 halalas.

Understanding CHF/SAR

To find out the comparative value of one currency, we require an additional currency to compare. If the base currency’s value goes down, the value of the quote currency moves up and contrariwise. If the market cost of this pair is 4.0742, then this amount of SAR is required to buy one unit of CHF.

Spread

Forex brokers have two distinct prices for currency pairs, which are classified as the bid and ask price. The bid price is the offering price, and ask is the buy price. The distinction between the ask and the bid price is known as the spread. The spread is how brokers make their income. Below are the spreads for CHF/SAR currency pairs in both ECN & STP brokers.

ECN: 9 pips | STP: 14 pips

Fees

A Fee is basically the compensation we pay to the broker each time we execute a spot. There is no compensation charged on STP account models, but a few additional pips are charged on ECN accounts.

Slippage

Slippage refers to the distinction between the trader’s anticipated price and the original price at which the trade is executed. It can occur at any time but often occurs when the market is fast-phased and volatile. Also, sometimes slippage occurs when we place a large number of orders at the same time.

Trading Range in CHF/SAR

The amount of money we will earn or lose in a specific timeframe can be evaluated using the trading range table. It is an illustration of the minimum, average, and maximum pip movement in a currency pair. This can be assessed simply by using the ART indicator with 200-period SMA. 

Procedure to assess Pip Ranges

  1. Add the ATR indicator to your chart
  2. Set the period to 1
  3. Add a 200-period SMA to this indicator
  4. Shrink the chart so you can assess a large time period
  5. Select your desired timeframe
  6. Measure the floor level and set this value as the min
  7. Measure the level of the 200-period SMA and set this as the average
  8. Measure the peak levels and set this as Max.

CHF/SAR Cost as a Percent of the Trading Range

The cost of trade widely varies on the broker and differs based on the volatility of the market. This is because the total cost also includes slippage and spreads, excluding the trading fee. Below is the interpretation of the cost variation in terms of percentages. The understanding of it is discussed in the subsequent sections.

ECN Model Account

Spread = 9 | Slippage = 5 |Trading fee = 8

Total cost = Slippage + Spread + Trading Fee = 5 + 9 + 8 = 22

STP Model Account

Spread = 14 | Slippage = 5 | Trading fee = 0

Total cost = Slippage + Spread + Trading Fee = 5 + 14 + 0 = 19

The ideal way to trade the CHF/SAR

The CHF/SAR is an exotic-cross currency pair, and it is volatile. For example, the average pip movement on the 1H timeframe for this pair is ~37pips. From the earlier tables, it is clear that the higher the volatility, the lower is the cost of the trade. Nevertheless, this is not an added benefit, as it is risky to trade when the markets are incredibly volatile.

Trading in such timeframes will ensure low expenses just as reduced liquidity. It will also involve fewer costs by placing orders using limit/pending orders instead of market orders. This will substantially reduce the total cost with slippage being zero.

STP Model Account (Using Limit Orders)

Spread = 14 | Slippage = 0 | Trading fee = 0

Total cost = Slippage + Spread + Trading Fee = 0 + 14 + 0 = 14

While reading the above tables, if the ratios are larger, more significant are the trade costs. Likewise, if the proportions are small, lower are the costs. This can be inferred as the trading costs are more significant for low volatile markets and smaller for high volatile markets. I hope this article will support you to trade this pair in a much efficient way. Cheers!

Categories
Forex Assets

Everything About Trading The CHF/THB Forex Exotic Pair

Introduction

CHF/THB is the abbreviation for the Swiss Franc against the Thai Baht. It is classified as an exotic-cross currency pair as it usually has a low trading volume. In this case, the Swiss Franc (on the left) is the base currency, and the Thai Baht (on the right) is the quote currency. The THB is the official currency of Thailand, and it is further split up into 100 satangs.

Understanding CHF/THB

The market price of CHF represents the value of THB that is required to purchase one CHF(Swiss Franc). It is quoted as 1 CHF per X THB. If the market cost of this pair is 34.350, then this amount of THB is required to buy one unit of CHF.

Spread

The distinction between the asking price and the offering price is labeled as the spread. ECN and STP account model will have various spread values; The approximate spread values of CHF/THB pair in both the accounts are mentioned below:

ECN: 30 pips | STP: 35 pips

Fees

The fee is the commission that one pays while entering a trade. A few extra pips are charged on ECN accounts, but there is no fee charged on STP accounts.

Slippage

The mathematical difference between the price expected by the trader and the given price by the broker can be termed slippage. Its cost varies on two factors, i.e., the market’s high volatility and broker’s implementation speed.

Trading Range in CHF/THB

The trading range helps us understand the minimum, average, and maximum pip movement in various time frames. These values assist us in determining the risk, which could be caused by trade. The same is in shown in the below table:

Procedure to assess Pip Ranges

  1. Add the ATR indicator to your chart
  2. Set the period to 1
  3. Add a 200-period SMA to this indicator
  4. Shrink the chart so you can assess a large time period
  5. Select your desired timeframe
  6. Measure the floor level and set this value as the min
  7. Measure the level of the 200-period SMA and set this as the average
  8. Measure the peak levels and set this as Max.

CHF/THB Cost as a Percent of the Trading Range

The cost variations in trade can be determined by applying the total cost to the table mentioned below. The cost percentage of the trading range represents the difference in fees on the trade and various time frames for differing volatility.

ECN Model Account

Spread = 30 | Slippage = 5 |Trading fee = 8

Total cost = Slippage + Spread + Trading Fee = 5 + 30 + 8 = 43 

STP Model Account

Spread = 35 | Slippage = 5 | Trading fee = 0

Total cost = Slippage + Spread + Trading Fee = 5 + 35 + 0 = 40

The Ideal way to trade the CHF/THB

The CHF/THB is an exotic-cross currency pair, and this market’s volatility is moderate. For instance, the average pip movement on the 1H timeframe is 51 pips. We should understand the higher the volatility, the lower will be the cost to implement the trade. However, this is not an added advantage as trading in a volatile market means more risk.

For example, in the 1M time frame, the Maximum pip range value is 1984, and the minimum is 310. When we evaluate the trading fees for both the pip movements, we can see that for 310pip movement fess is 13.87%, and for the 1984 pip movement, the fee is only 2.17%. With the mentioned example, we can conclude that trading the CHF/THB currency pair will be comparatively expensive.

Categories
Crypto Education

Forex to Crypto Trading: Making the Transition

Have you noticed how each and every post, podcast, and video out there focus only on one form of trading? If you happened to be wondering why someone who stresses on their success only highlights a single market’s potential, you are on the right track. Also, isn’t it interesting how many traders look up what’s new and they take on a new market, completely dropping what they did before as if their shiny new toy was going to render more success despite not having learned anything before? If you have already done some forex trading, and if you browsed through whatever available material there was, you then may have also wondered how understanding other markets could help you prosper. If that is the case, or if you are here for some fresh insight, in today’s discussion we are going to take on a road less traveled and provide you with the reasons why anyone should expand their range of trading experience from the forex to the crypto market.

The topic of expansion is often conditioned by various factors. You are allowed to expand, but when your projections and beliefs go against your primary community, you are either considered to be unrealistic or you may start questioning your judgment. What so many fail to see is that true knowledge comes not only from spreading out across one market’s ecosystem but from expanding across several markets as well. The truth is that no market should ever enjoy the exclusive privilege of being the one way to go about trading.

This topic of superiority has only limited traders from using real-life opportunities to learn how to make more money. What is more, those who recognized the importance of going wide also understand the changing nature of the markets we trade. We need to look for ways to always be a part of the game because we may wake up one day to find out that the currencies we know no longer have the same meaning and importance as they did before. Therefore, by making a conscious decision to learn about other forms of trading you protect your investment and your future as a trader.

Quite interestingly, although both the fiat and the crypto markets revolve around the topic of currency, any cryptocurrency trader who ever tried to boldly copy and paste strategies onto the forex market without attempting to learn before making any decisions probably failed initially. Unlike this situation, all forex traders who shifted to the crypto market faced considerably fewer challenges in comparison to the previous scenario. Although no market is exempt from failure, which can indeed be painful and quite costly too at times, we need to understand what it is that forex traders seem to know about trading that makes such a vast difference in overall trading experience and, naturally, the related financial reward. If you are interested in the topic of cryptocurrency and you strive to become a more affluent trader, then there should not be any reasons for you not to absorb whatever you may have learned about forex and extend this knowledge and previously acquired skills to another market.

The remaining questions, quite understandably, reveal the concern where to start looking. What are the steps that forex traders use to buffer some inevitable challenges looming in the cryptocurrency market? Which factors make it easier for the individuals engrossed in the fiat market to engage in trading cryptocurrencies rather than vice versa? Even though the questions are many, to be able to answer them, we may need to address the overall climate of the two markets first. The answers are often not quantitative, but qualitative, so to provide direct and useful advice that can be transferred to a certain degree from forex to crypto trading, we need to assess the entire setting surrounding both markets. In addition, we need to comprehensively assess how these environments and differences can allow the experience with one market to serve any future involvement with the other.

What each forex trader can testify is that most fiat-driven individuals are deeply immersed in the topic of trading and devoted to the exploration of new and useful information. The blogs and videos on this topic are growing in numbers on a daily basis and the search for the best indicators is as vigorous as it has always been. The same can be said about the world of cryptocurrency, yet there is one essential difference that directly and profoundly impacts a trader’s mindset. While we can see that the two communities experience an almost identical degree of devotion to the development and the desire to grow financially, it is the nature of the traders’ involvement in these communities that make a clear distinction between them.

Unlike the fiat realm, there is an air of neediness to communicate and share one’s expectations between crypto traders. An average crypto trader would commonly turn to the community, waiting for the announcements of upcoming events. Unfortunately, this exchange of information often projects an unrealistically optimistic perspective disguised as mutual support, and the charged-up atmosphere, aside from elevated emotions, often fails to produce any lucrative outcome. As contacts and groups, we engage with professionally help shape our careers, such specific collaboration typical of the crypto market produces a distinctive trader profile, which should be the focal point of research for any forex turn crypto trader.

To further describe why the overall trading climate is so relevant for the growth of every trader, we need to think about the topic of independence. As a forex trader, you may be on the lookout for some useful tips and success stories, but you will eventually need to test these out ether in the demo or in the real world, which needless to say does not apply to the crypto market. The crypto community still consists of individuals who seem to be lacking individuality in decision-making, always watching out for the approval or reassurance from their peers. These may seem to be insignificant differences on the surface yet, from the psychological point of view, such tendencies and practices are slowly but surely building insecure traders, dependent on external ideas before daring to take any deliberate action.

Naturally, this approach can hardly help develop any strategy or pave the way for drawing necessary conclusions. Therefore, short of deduction and planning, trading cryptocurrencies often prevent those involved from developing key analytical skills. Consequently, these traders’ constant reliance on outside support and input, accompanied by a severe lack of objectivity, makes generating revenue highly implausible. Since trading essentially revolves around profit, as a forex trader, it is your task to use your tested-out methods and plan how you can benefit from the pre-existing knowledge prior to new market penetration.

If you are still thinking whether you should embark on this journey, you should bear in mind that you have the necessary means to expand yet to another market and thus ensure an even greater source of income. Due to the fact that your trading experiences allowed you to grow an independent mindset, you can make use of the analytical and planning skills you took time to develop. With this advantage, you will not only progress faster, but you will be able to secure your financial stability should any unexpected events take place in either of the markets. Finally, to answer the question of why anyone should move from forex to crypto, consider how much better and profitable your trading career could be in the future with the ease of not having to put excessive amounts of effort as a pre-condition.

Categories
Forex Assets

Trading the EUR/USD Pair the Prop Traders Way

Prop traders are the elite in the trading game on Forex. They do this for a living and their gains are consistently way better than with any treasury note, saving account interest, and even mutual funds investment. If you are not new to Forex you have probably heard about the 99% of traders that breakeven or lose their accounts on Forex. The 1% that consistently win know what they are doing and proprietary traders are the top 10% of that group. When you are starting, it is almost certain you are trading on the EUR/USD currency pair. You are not aware of what is underneath the EUR/USD nice clothes. Here is what a prop trader by the name of VP from the Maverick FX prop company team has to say about this.

This is the most traded currency pair on Forex. Prop companies at its core are a team of elite traders that collaborate and excel at capturing the profits out of this market. They discuss what is going on, what is the best course of action and they release the report or a signal. The signal serves to other traders as to what is estimated to happen with a specific forex asset in a specified timeframe. More often than not, these signals are correct. As per their words, the EUR/USD pair is mostly avoided in their signals.

The 99% group we have mentioned above is trading the EUR/USD, the one that loses or breakeven at best in the long term. EUR/USD is also the most popular pair to start with. According to prop traders, trading with this pair is like having an affair with a celebrity. You will get burnt at the end. Before we move on with reasons, let’s understand what made prop traders to this position. It starts with a concept, a trading theory, strategy, indicator, tool, or method. All this is tested in different ways, mostly through practical backtesting and forward testing on various assets and timeframes.

Based on this data a consensus among top traders is made and can be adopted as a viable option trader can use to make consistent results. This has been done for thousands of indicators and theories, they know what works best to date. It turns out they are doing the opposite of what the 99% are doing, and it makes sense. What is even more interesting is the internet is full of popular “tips” majority of traders listen and become the 99% group. As you may presume, prop traders do not follow these tips.

Top 5 most traded pairs are the EUR/USD, USD/JPY, GBP/USD, AUD/USD, and USD/CAD. The EUR/USD cap is almost one quarter on the Forex. By looking at these pairs, you can notice they all have one in common, the US Dollar. Is this an issue? Prop traders say yes. But why the EUR/USD is the pair of choice for new traders?

This currency pair is often “offered” to them first, so they start trading exclusively on it. Also, all the rest of the popular tools are promoted to them as something that works. At a few busted accounts they either give up or, if they are open-minded and willing, continue to search out new ways of trading.

Beginner traders think they can get good at one before trying another. It is a common misconception that currency pairs all have a special way of price action. Apart from measured volatility specifics, price movements on every pair do not have any character! GBP/USD can have very calm periods, choppy and calm, volatile and uniform, sideways movement, spikes and it happens in cycles. The EUR/USD is no exception to this. Just when you think you have adapted your tools to it, it will start to behave differently, then again. It is the cyclic way economy manifests and it is also the way on forex. The order moves into chaos, chaos into order. Some strategies work better in one environment. For example, scalping strategies would benefit less volatile periods, while higher timeframe trend following strategies needs momentum and volume which causes volatility.

You will certainly notice the trading session spikes around the same time of course, but if we go back 50 days back or 50 days into the future, your trading results will be completely different. The EUR/USD in 2020 is different than the EUR/USD in 2019. Sticking to just one asset is not only unnecessary and a self-limitation, but it will also affect your account(s). The way to go is finding the pair that is adequate for your system at that time, ignore the others. The bigger the pool of pairs to choose from, the more opportunities where your system works best. This does not mean you should trade every currency pair there is, like extremely volatile/illiquid exotics.

The EUR/USD is the most liquid so that is why new traders focus on it. The EUR/USD is the most traded pair but that also makes it the most popular. Being popular puts you in that 99% group. Here is why this is a problem from different angles. Liquidity does not mean your trades will be more profitable nor it means the asset will have more “reasonable” price action. Retail traders do not have enough capital to move the markets, the liquidity pool is simply too big, at least within the major 8 currencies. Also, prop traders say the price spikes are less often on less popular currency pairs! So the notion of liquidity is better applies only if a pair is very exotic, like TRY/PLN.

Another problem with the EUR/USD having that 99% group is this is a world where big banks and institutions like to mess with them. If you do not know already what the big banks are doing, their manipulation is mostly done where the majority of traders are trading (popular) where they can extract the most money out of. This money goes back into the pool again and the cycle continues. In our Big Banks article, we mentioned that they know where traders’ positions are and move the price against their trades. News events are especially good for this since a lot of trades are focused on certain price levels in short periods.

Talking about the USD, it is a dominant currency and it is also packed with news events and the most manipulated. This brings us to the point where every currency pair with the USD is likely to be affected by this. Luckily, many pairs are not targets for big bank manipulation since they do not have a lot of traders, the 1% group which escape their hands from time to time. So to sum it up, here are some practical tips from prop traders you can apply and compare the results on your accounts:

Trade the EUR/USD only if you know what you are doing, expose less on this market, and do not limit your trading only on one asset. There is no specialization, no currency pair has a special way of price action, only volatility is different, If you are trading on lower timeframes than daily, you will notice volume spikes on certain trading sessions, but then again, every currency has its trading session.

Taking a wrong when you are just starting forex trading can be a danger to your effort. You may become accustomed to a certain asset, strategy, or tools that are not effective, or there are better alternatives you do not know about. This path is unfortunately easy to start walking since there are so many sources available the right paths are not easy to find. Keeping your mind open for other things to try will evolve your trading and your system for the better, it makes sense. Being adaptive will reflect on your system, it will too be adaptive as much as you are. This path is not the easy one, you will need to climb to that 1% group. Forex will filter out the ones who are not persistent, open-minded, emotionally in control, and the ones that gamble.

Source: No-Nonsense Forex channel