Categories
Forex Assets

CAD/JMD Asset Analysis

Introduction

CAD/JMD is an exotic currency pair. CAD is the Canadian Dollar, and JMD is the Jamaican Dollar. The CAD is the base currency in this pair while the JMD is the quote currency; meaning that the exchange rate of the CAD/JMD pair is the quantity of JMD that can be bought by 1 CAD. If the exchange rate for the pair is 105.68, it means that 1 CAD buys 105.68 JMD.

CAD/JMD Specification

Margin Currency CAD
No. of digits value (price) 5
Pip Value $9,46
Min Trade Size 0.01 Lots
Max Trade Size 1000 Lots

Spread

In forex trading, the spread represents the difference in the value at which you can buy a currency pair and that at which you can sell. The spread varies with different currency pairs.

The spread for the CAD/JMD pair is:

ECN: 2.4 pips | STP: 7.4 pips

Fees

When trading forex with an ECN account, the broker charges a commission for every trade. With STP accounts, no fees are charged on trades.

Slippage

In times of market volatility or if the execution of trade is not instant, there will be a discrepancy between the price at which you initiate a trade and the price it executed. This discrepancy is called slippage.

Trading Range in the CAD/JMD Pair

Since the price of a currency pair constantly changes, knowing by how much the price changes across different timeframes can help forex traders better understand volatility. This knowledge is vital, especially when estimating potential loses or gains. If, for example, the CAD/JMD pair has a volatility of 20 pips during the 4-hour timeframe, it means that trading the pair has a potential profit or loss of $189.2

Below is a table showing the trading range for the CAD/JMD pair.

Margin Currency CAD
Min Average Max
1H 3.4 20.4 80.2
2H 5.3 28.3 93.5
4H 9.8 43.4 124.8
1D 28.8 125.1 211.7
1W 66.6 210.9 224.5
1M 215.5 489.3 899.9

The Procedure to assess Pip Ranges

  1. Add the ATR indicator to your chart
  2. Set the period to 1
  3. Add a 200-period SMA to this indicator
  4. Shrink the chart so you can determine a larger period
  5. Select your desired timeframe
  6. Measure the floor level and set this value as the min
  7. Measure the level of the 200-period SMA and set this as the average
  8. Measure the peak levels and set this as Max.

CAD/JMD Cost as a Percentage of the Trading Range

Trading any currency pair comes at a cost. These costs vary across different timeframes and volatility. Expressing them as a percentage of the trading range will help to inform the trading decision for the pair.

Below are analyses of the trading costs for the CAD/JMD pair across different timeframes.

ECN Model Account

Spread = 2.4 | Slippage = 2 | Trading fee = 1

Total cost = 5.4

STP Model Account

Spread = 7.4 | Slippage = 2 | Trading fee = 0

Total cost = 9.4

The Ideal Timeframe to Trade CAD/JMD

From the above cost analyses, we observe that lower timeframes and low volatility correspond to higher trading costs with the CAD/JMD pair. For both the ECN and the STP accounts, the highest costs are when volatility is the lowest at 3.4 pips. The lowest cost is when volatility is the highest at 899.9 pips.

The long-term trader enjoys lower trading costs that intraday traders. However, across all timeframes, trading when volatility is average lowers the cost and the risks associated with high volatility. Furthermore, traders can lower their costs by employing the use of forex limit orders as opposed to market orders. Limit orders eliminate the cost of slippage. Here are the trading costs when limit orders are used.

ECN Account Using Limit Model Account

Total cost = Slippage + Spread + Trading fee

= 0 + 2.4 + 1 = 3.4

We can notice a significant reduction in the trading costs of the CAD/JMD pair. The highest cost has reduced from 91.53% to 57.63% of the trading range.

Categories
Forex Assets

CAD/BBD Asset Analysis

Introduction

The CAD/BBD is an exotic currency cross. CAD is the Canadian Dollar, and the BBD is the Barbadian Dollar – the official currency of Barbados. Here, the CAD is the base currency, and the BBD is the quote currency. Thus, the exchange rate of the CAD/BBD pair is the amount of BBD that can be bought using 1 CAD. For example, if the exchange rate for the pair is 1.4961, it means that 1 CAD buys 1.4961 BBD.

CAD/BBD Specification

Spread

One of the costs of trading forex is the spread. It is deducted by the forex broker and is calculated as the difference between the ‘bid’ and ‘ask’ price. The spread varies depending on the type of trade executed. Here are the spread charges for ECN and STP brokers for CAD/BBD pair.

ECN: 12 pips | STP: 17 pips

Slippage

In forex, slippage occurs when a trader opens a trade, but that trade is executed at a higher price. The slippage is influenced by market volatility and the speed at which the forex broker executes your trade.

Trading Range in the CAD/BBD Pair

In forex, the trading range shows how a given currency pair fluctuates over time. It shows the minimum, average, and the maximum volatility of pair across different timeframes. The analysis of the trading range can help us the profitability of trade over different timeframes.

The trading range for the CAD/BBD pair is shown below.

The Procedure to assess Pip Ranges

  1. Add the ATR indicator to your chart
  2. Set the period to 1
  3. Add a 200-period SMA to this indicator
  4. Shrink the chart so you can determine a larger period
  5. Select your desired timeframe
  6. Measure the floor level and set this value as the min
  7. Measure the level of the 200-period SMA and set this as the average
  8. Measure the peak levels and set this as Max.

CAD/BBD Cost as a Percentage of the Trading Range

Here, we will take the total costs in both the ECN and STP accounts as a ratio of the above volatility and express it as a percentage. This analysis will help us understand the trading costs associated with the CAD/BBD pair across different timeframes; which can be useful to determine which risk management technique is optimal.

ECN Model Account

Spread = 12 | Slippage = 2 | Trading fee = 1

Total cost = 15

STP Model Account

Spread = 17 | Slippage = 2 | Trading fee = 0

Total cost = 19

The Ideal Timeframe to Trade CAD/BBD

From the above analyses, we can see that the trading cost for the CAD/BBD pair is highest at the 1-hour timeframe. The highest trading cost for both the ECN and the STP accounts coincide with a period of lowest volatility of just 0.04 pips. The shorter timeframes have relatively higher trading costs that the longer timeframes. Therefore, longer-term traders tend to enjoy lesser costs.

We can also notice that the overall trading costs reduce as the volatility of the CAD/BBD pair increases from minimum to maximum. Therefore, opening trades when the volatility is above the average can help shorter-term traders reduce their trading costs. More so, intraday traders also significantly lower these costs by adopting the use of forex limit orders over the market orders. The limit order types remove the costs associated with slippage. Below is a demonstration with the ECN account.

ECN Account Using Limit Model Account

Total cost = Slippage + Spread + Trading fee

= 0 + 12 + 1 = 13

Removing the slippage costs reduces the trading costs significantly for the CAD/BBD pair. For example, the highest trading cost has reduced from 322.03% to 220.34% of the trading range.


Categories
Forex Assets

JPYINR Asset Analysis


Introduction

JPYINR is a currency pair where JPY is the currency of Japan. On the other hand, the Indian Rupee (INR) is the currency of India. It is an exotic currency pair where the JPY is the first currency, and the INR is the second currency

Understanding JPYINR

In this currency pair, we can determine the value of INR, which is equivalent to one JPY. It is quoted as 1 JPY per X INR. For example, if the value of JPYINR is at 2.4458, then about 2.4 INR is required to purchase one JPY.

JPYINR Specification

Spread

The subtraction of Bid price and the Ask price is the spread. It is a charge that the broker takes from a trader when they open a trade. Therefore, the spread is controlled by the broker. This value changes with the execution model used for executing the trades.

Spread on ECN: 12 pips

Spread on STP: 17 pips

Fees

Fees is the charge that broker takes from traders. Fees in the currency market works almost the same of other financial market. Note that, STP accounts does not have any fee, but a few pips is applicable on ECN accounts.

Slippage

Slippage is the difference between the execution price and the entry market price. Slippage occurs due to the market volatility and the broker’s execution.

Trading Range in JPYINR

The trading range is the representation of the minimum, average, and the maximum volatility of this pair on the 1H, 4H, 1D, 1W, and 1M timeframe. Using these values, we can assess our profit/loss margin of trade. Hence, this proves to be a helpful risk management tool for all types of traders.

Procedure to assess Pip Ranges

  1. Add the ATR indicator to your chart
  2. Set the period to 1
  3. Add a 200-period SMA to this indicator
  4. Shrink the chart so you can assess a large time period
  5. Select your desired timeframe
  6. Measure the floor level and set this value as the min
  7. Measure the level of the 200-period SMA and set this as the average
  8. Measure the peak levels and set this as Max.


JPYINR Cost as a Percent of the Trading Range

With the volatility values from the above table, we can determine the chance of cost with the change of volatility. We have got the ratio between the total cost and the volatility values and converted into percentages.

ECN Model Account 

Spread = 12 | Slippage = 5 | Trading fee = 8

Total cost = Spread + Slippage + Trading Fee

= 12 + 5 + 8

Total cost = 25

STP Model Account

Spread = 12 | Slippage = 5 | Trading fee = 0

Total cost = Spread + Slippage + Trading Fee

= 12 + 5 + 0

Total cost = 17 

The Ideal way to trade the JPYINR

As per the above data, we can say that the JPYINR is very liquid and volatile currency pair. Hence, it is very easy to trade in this exotic-cross currency.

If we look at the timeframe, we can see that the volatility in the lower timeframe is higher compared to the higher timeframe. However, in the higher timeframe it is often hard for traders to trade as it requires a lot of trading equity. Based on the structure, we can say that it is better to follow the average cost of this currency pair

Another way to reduce the cost is to place orders as ‘limit’ and ‘stop’ instead of ‘market.’ In that case, there will be no cost for slippage on the total cost calculation. Therfore, the total cost will reduce by three pips.

Limit Model Account

Spread = 12 | Slippage = 0 | Trading fee = 0

Total cost = Spread + Slippage + Trading Fee

= 12 + 0 + 0

Total cost = 12

Categories
Forex Assets

JPYKES Asset Analysis

Introduction


In the JPYKES currency pair, JPY is considered as the currency of Japan. On the other hand, KES is the currency of Kenya. It is an exotic currency pair where the JPY is the first currency, and the KES is the second currency.

Understanding JPYKES

The JPYKES represents how much KES is required to have one JPY. It is quoted as 1 JPY per X KES. For example, if the value of this currency pair is at 1.0286, then about 1.0286 KES is required to purchase one JPY.

JPYKES Specification

Spread

Spread comes from the difference between the Ask price and the Bid price that a broker takes as a charge. The brokers control this value; therefore, traders don’t have to do anything with this. This value depends in the execution model used for executing the trades.

Spread on ECN: 19 pips

Spread on STP: 24 pips

Fees

Every broker takes fees from trading in any currency pair, which is similar to the stock market. However, there is no fee on STP accounts, but a few pips on ECN accounts.

Slippage

Slippage is the difference between the open price of the trade and the actual execution level. The main reason for slippage is the market volatility and the broker’s execution speed.

Trading Range in JPYKES

The trading range is the representation of the minimum, average, and the maximum volatility of this pair on the 1H, 4H, 1D, 1W, and 1M timeframe. Using these values, we can assess our profit/loss margin of trade. Hence, this proves to be a helpful risk management tool for all types of traders.

Procedure to assess Pip Ranges

  1. Add the ATR indicator to your chart
  2. Set the period to 1
  3. Add a 200-period SMA to this indicator
  4. Shrink the chart so you can assess a large time period
  5. Select your desired timeframe
  6. Measure the floor level and set this value as the min
  7. Measure the level of the 200-period SMA and set this as the average
  8. Measure the peak levels and set this as Max.

JPYKES Cost as a Percent of the Trading Range

With the volatility values from the above table, we can determine the chance of cost with the change of volatility. All got the ratio between total cost and volatility values and converted into percentages.

ECN Model Account 

Spread = 19 | Slippage = 5 | Trading fee = 8

Total cost = Spread + Slippage + Trading Fee

= 19 + 5 + 8

Total cost = 32

STP Model Account

Spread = 19 | Slippage = 5 | Trading fee = 0

Total cost = Spread + Slippage + Trading Fee

= 19 + 5 + 0

Total cost = 24 

The Ideal way to trade the JPYKES

The JPYKES is a currency pair that has sufficient volatility and liquidity. Therefore, it is simpler to trade this currency pair.

The percentage values are above 500% in a lower timeframe. This means that the costs are low regardless of the timeframe and volatility you trade.

Digging it a little deeper, the cost increases when the volatility decreases, and the cost decrease when the volatility increases. In a lower timeframe, this pair is very volatile at above 600%; therefore, traders should be cautious to trade it.

However, the best time to trade in this pair is when the volatility remains at the average value. In that case, this pair can provide a decent profit with balanced volatility and cost.

Furthermore, traders can quickly minimize their costs by using orders as ‘limit’ and ‘stop’ instead of ‘market.’ By using these orders, the slippage will not be considered in the calculation of total costs. Therefore, the total cost will reduce by five pips.

Limit Model Account

Spread = 19 | Slippage = 0 | Trading fee = 0

Total cost = Spread + Slippage + Trading Fee

= 19 + 0 + 0

Total cost = 19

Categories
Forex Assets

CAD/BRL Asset Analysis

Introduction

CAD/BRL is an exotic currency pair. CAD is the Canadian Dollar, and the BRL is Brazilian Real– the official currency of Brazil. For this pair, the CAD is the base currency and BRL the quote currency. Therefore, the exchange rate for the CAD/BRL pair represents the amount of BRL that can be bought by 1 CAD. Let’s say the exchange rate for the pair is 4.1564; this means that 1 CAD buys 4.1564 BRL.

CAD/BRL Specification

Spread

When trading a currency pair, the spread is the difference in the price at which you can buy the pair and that which you can sell. Forex brokers earn their revenues using spread from traders.

The spread for the CAD/BRL pair is:

ECN: 31 pips | STP: 36 pips

Fees

Another way for forex brokers to earn revenues is by charging a commission for every trade made. The fee charged depends on the broker. STP accounts usually do not have a trading fee charged.

Slippage

When initiating a trade, you instruct your broker to execute the trade at a particular price. Slippage in forex is the difference between the price you instruct the broker and the price the broker executes your trade. The primary causes of slippage are prevailing volatility and your broker’s efficiency.

Trading Range in the CAD/BRL Pair

In forex, the price of currency constantly fluctuates across different timeframes. Trading range in forex helps to analyze the market volatility for a currency pair across different timeframes. The volatility for a currency pair can help a trader estimate the amount of profit or loss that is to be expected when trading in different timeframes.

Let’s say, for example, that for the 4-hour timeframe, the volatility of CAD/BRL pair is 10 pips. A trader can expect to either gain or lose $24 by trading a standard lot of the CAD/BRL pair.

The table below shows the trading range for CAD/BRL.

The Procedure to assess Pip Ranges

  1. Add the ATR indicator to your chart
  2. Set the period to 1
  3. Add a 200-period SMA to this indicator
  4. Shrink the chart so you can determine a larger period
  5. Select your desired timeframe
  6. Measure the floor level and set this value as the min
  7. Measure the level of the 200-period SMA and set this as the average
  8. Measure the peak levels and set this as Max.


CAD/BRL Cost as a percentage of the Trading Range

Expressing trading costs as a percentage of the trading range can help traders determine the difference in the trading costs across various timeframes. It is worth noting that these costs are calculated as Percentage of pips in the different timeframes.

Total cost = Slippage + Spread + Trading Fee

The tables below show the percentage costs to be expected when trading the CAD/BRL pair.

ECN Model Account

Spread = 31 | Slippage = 2 | Trading fee = 1

Total cost = 34

STP Model Account

Spread = 36 | Slippage = 2 | Trading fee = 0

Total cost = 38

The Ideal Timeframe to Trade CAD/BRL

From the above cost analysis, we can observe that shorter timeframes when volatility is lower, have higher trading costs. The highest trading costs for both the ECN and the STP accounts are during the 1-hour timeframe, which coincides with the least volatility of 0.4 pips. The least trading costs for either account is at the 1-month timeframe coinciding with the highest volatility of 42.3 pips.

You can also notice that the trading costs reduce as the volatility increases across timeframes. For shorter-term traders, opening CAD/BRL trades when volatility is above average can help reduce trading costs.

Another method which forex traders can implement to reduce trading costs is by using limit orders instead of forex market orders. Forex limit orders eliminate the costs associated with slippage. Here’s how it works.

ECN Account Using Limit Model Account

Total cost = Slippage + Spread + Trading fee

= 0 + 31 + 1 = 32

You can notice that trading costs have marginally reduced. The highest trading cost has reduced from 576.27% to 542.37%.


Categories
Forex Assets

NZD/AED Asset Analysis

NZD/AED is a currency pair where NZD is the currency of New Zealand. On the other hand, the AED is the currency of the United Arab Emirates (UAE). It is an exotic currency pair where the NZD is the first currency, and the AED is the second currency.

Understanding NZD/AED

The price of NZDAED represents the value of AED, which is equivalent to one NZD. It is quoted as 1 NZD per X AED. For example, this pair is at 2.4458, then about 2.4458 AED is required to purchase one NZD.

NZD/AED Specification

Spread

If we subtract the Bid price and the Ask price, we will find the spread. The spread is usually a charge that the broker takes from a trader when they open a trade. Therefore, the spread is controlled by the broker. This value depends on the execution model used for executing trades.

Spread on ECN: 9 pips | Spread on STP: 14 pips

Fees

The fees in the currency pair trading are almost similar to the other financial market. Note that, STP accounts do not take charges, but a few pips are charged on ECN accounts.

Slippage

Slippage is the difference between the instant execution price and the open market price. The market volatility and the broker’s execution speed are the reasons for slippage to occur.

Trading Range in NZD/AED

The trading range is the representation of the minimum, average, and the maximum volatility of this pair on the 1H, 4H, 1D, 1W, and 1M timeframe. Using these values, we can assess our profit/loss margin of trade. Hence, this proves to be a helpful risk management tool for all types of traders.

Procedure to Assess Pip Ranges

  1. Add the ATR indicator to your chart
  2. Set the period to 1
  3. Add a 200-period SMA to this indicator
  4. Shrink the chart so you can assess a large time period
  5. Select your desired timeframe
  6. Measure the floor level and set this value as the min
  7. Measure the level of the 200-period SMA and set this as the average
  8. Measure the peak levels and set this as Max.

NZD/AED Cost as a Percent of the Trading Range

With the volatility values from the above table, we can see how the cost changes with the change in volatility of the market. We have got the ratio between the total cost and the volatility values; therefore, converted these into percentages.

ECN Model Account 

Spread = 9 | Slippage = 5 | Trading fee = 8

Total cost = Spread + Slippage + Trading Fee

= 9 + 5 + 8 = 22

STP Model Account

Spread = 14 | Slippage = 5 | Trading fee = 0

Total cost = Spread + Slippage + Trading Fee

= 14 + 5 + 0 = 19 

The Ideal Way to Trade the NZD/AED

The exotic NZDAED pair is a liquid and volatile currency pair. Therefore, it is very easy to trade this exotic-cross currency pair. From the above table, we can see that the percentage values are 200% in the ECN model and within 128% in the STP model. It means the cost is comparatively low, and if we trade in the STP model, the cost will be further low.

In the lower timeframe, the volatility is comparatively higher, but the Percentage of volatility is not much higher to indicate that it is not tradeable. However, in a higher timeframe, the volatility is lower, but it is often hard for traders to trade in a higher timeframe as it requires a lot of patience and balance.

Furthermore, another way to reduce the cost is to place orders as ‘limit’ and ‘stop’ instead of ‘market.’ In that case, the slippage will not be considered in the calculation of the total costs. So, in our example, the total cost will reduce by three pips.

Limit Model Account

Spread = 14 | Slippage = 0 | Trading fee = 0

Total cost = Spread + Slippage + Trading Fee

= 14 + 0 + 0

Total cost = 14

Categories
Beginners Forex Education Forex Assets

Gold Market Analysis and Structure

If you are operating in the commodity market, you need to have an idea of the structure and dynamics of the supply and demand of the assets. Oil is a typical example, which is rapidly recovering lost positions, thanks to the growth prospects of global demand and the contraction of the surplus in the midst of the opening of the major world economies. Unlike Brent and WTI, gold is less sensitive to the conjuncture of the physical asset market, but at any time it can punish a trader who ignores the fundamentals.

Global demand for precious metals is dominated by jewelry and investment, which accounted for 48.5% and 29.2% in 2019. The share of gold purchased by central banks was 14.8% and the share of its use in the industry was 7.5%. The last indicator is very important. The fact is that silver is considerably higher, and the closure of industrial plants due to the pandemic caused the faster sinking of XAG/USD compared to XAU/USD. As a result, the ratio of the two metals plummeted to historic highs. It is logical that in conditions of recovery of the world economy it makes sense to expect a reduction of the coefficient, that is, to bet on a faster growth of silver compared to gold.

In the first quarter, the share of investments in the structure of global demand for precious metals increased to 49.8%, while jewelry shops fell to 30.1%. Gold consumption contracted in almost all areas compared to October-December and January-March 2019, with the exception of ETF and coins.

Changing the structure of demand is an important point for pricing. When this happens, we can talk about the stability of the existing trend. The shift from jewelry to investment is a sure sign that bulls dominate the market. Jewelry is too expensive, leading to a reduction in its consumption. On the contrary, the faster the stock of specialized funds traded on the stock exchange grows, the higher the stock price will be and the greater the army of buyers will be. Sometimes, in the context of an upward trend, gold is said to flow from east to west. In fact, the share of China and India in the consumption of precious metals in the jewelry industry in 2019 was 67%, while the main ETFs are located in the United States (including the largest fund SPDR Gold Shares) and in Europe.

The main gold producers are China (404.1 tonnes), Australia (314.9 tonnes), Russia (297.3 tonnes), the United States (221.7 tonnes), and other countries. The impact of supply on price is limited. A typical example is 2013. Then many said that XAU/USD quotes will not fall below $1300-1350 per ounce, as this is where the equilibrium point of the mining companies lies. They say they will reduce production, leading to shortages and higher prices. In fact, existing hedging technologies allow companies to price and continue production at the same volumes. The gold fell considerably, punishing buyers for themselves.

But, it is necessary to know the offer completely. In 2020, amid the pandemic and company shutdown, investors felt a severe lack of physical assets in the negotiation of forward contracts, leading to increased trading premiums in the United States and Europe, contributing to the increase in XAU/USD contributions.

Therefore, the most important element in the pricing of precious metals is the demand for investment, the value of which, in the first place, is influenced by the monetary policy of central banks. Large-scale monetary expansion contributes to the weakening of the world’s major currencies, falling bond yields, and rising XAU/USD rates.

Categories
Forex Assets

Investing In Silver (the Forex Way)

Many investors wonder how to invest in silver in the most appropriate way since silver has traditionally held up well to inflation and has contributed to the offsetting of investors’ portfolios. When everything else goes wrong, silver becomes one of the best investment alternatives, just like gold. In today’s article, we will analyze the different options with which we can invest in silver since the possibilities to invest in this unique precious metal are very wide.

Silver As A Refuge

It has usually been associated with silver as an active refuge, but it is much more than that, it is a natural element that has a multitude of uses in different fields, ranging from industry to luxury. Historically, gold has played a role closely linked to the monetary field. This historical fact is due to its properties, of which the five most important are the following: its scarcity, its durability or resistance, its divisibility, its homogeneity, and its difficult falsification.

Differences Between Gold and Silver

The main difference between gold and silver for investors is that silver has a much more industrial use than gold, therefore silver in relation to gold has to be more valued as a raw material. We do not want to claim that silver is a commodity per se, but in relation to gold, it is, on the other hand, if we compare it with steel, this valuation would change.

Because of this industrial attribute, there have been large discrepancies between the value of silver and gold. Gold has covered inflation, is an international currency, is relatively not very volatile, and is the stock of value par excellence. Silver however has great industrial use, has not covered inflation, and is quite more volatile than gold. For these qualities, it seems that having gold in the portfolio is more interesting than silver, but this also has good qualities, and depending on the period, silver has been a better investment than gold, as has happened recently. From the minimums of the pandemic to the maximums of the post-quarantine rally, silver was revalorized by more than 100%, while gold did so by around 30%.

Risks of Silver Trading

The risks of investing in silver are not as limited as those of gold, but arguably, the main risk of investing in silver is mainly opportunity cost, because, if we invest in it is waiting for a recession and finally comes an expansive cycle, while the entire stock market goes up your silver investment will fall or fall flat. Another risk is deflationary pressure, since if a crisis comes, where silver is supposed to act better but is linked to a very strong deflationary trend, silver might not behave at all well, because this makes it better with inflationary tensions. Finally, there is a certain cyclical risk, since silver, when used industrially, can have a cyclical component depending on the economic cycle or industry in particular where silver is needed.

How To Invest

Undoubtedly, investment in physical gold is traditionally the most common form of investment and widespread option. It consists of the physical acquisition of a silver ingot, silver jewelry, silver coins, or any element that contains silver mostly in its composition. This option has the advantage that you possess silver physically. On the other hand, it has the disadvantage that you have to bear some storage costs because, being such a valuable product, most investors do not keep it at home.

In this sense, there are different companies that are dedicated to the storage of any gold product, and that offers you the possibility of buying gold physically but not having to store it, I mean, you own the amount of silver you buy and it will be 100% insured. To emphasize that the acquisition of physical silver is more related to the idea of acquiring the good more like a luxury good than as an investment asset.

Investing in silver through the stock exchange is a way of owning silver by means of a title that accredits a right over the silver and not by means of its physical possession. This way of acquiring, which as we will see below has many variants, has a more investment approach. As in most situations, it has pros and cons in each of its different branches.

Silver ETFs

Silver ETFs are traded funds that try to replicate the behavior of silver. Although the fund must maintain a legal obligation to have all derivative contracts issued backed by silver, the ETF holder owns that derivative contract (ETF) which replicates the silver price, and not a proportion of the silver reserve. In this way, the investor, who owns the derivative, is exposed to the yields of the precious metal.

The advantages and disadvantages of silver ETFs are a projection of the advantages and disadvantages of the overall investment in ETFs. Investing in a silver ETF and not in physics has the advantage that it requires a lower cost, both for the execution of the investment and storage. In addition, as they are listed in the market as any stock they have the advantage of having greater liquidity compared to investment funds, giving the possibility to liquidate the position at any time in the market.

On the other hand, it has the disadvantages that the investor did not pose the silver physically, but a title (right) on some silver reserves. There is the possibility that the ETF does not faithfully replicate the price of silver, depending in part on how the ETF is composed. The ETFs are subject to commissions in their purchase, it will be necessary to take into account what are the commissions that can charge us for the operation and what impact it will have on the replication of the silver price.

Investment Funds

These are funds that develop their entire investment strategy around silver, gold, or other precious metals, either by acquiring companies that develop activity within the silver sector, either by own acquisition of silver in any of its tradable forms or by acquisition of ETFs silver. In addition, they are also often exposed to other precious metals, which increases the diversification of the fund. In addition, as you comment later on it is very complicated to find companies that have only exposure to silver and not to more precious metals.

The advantages of investing in silver through this form are the professionalized management of the fund, focusing on generating value for the shareholder. At the same time, it gives the possibility to invest in shares or other funds where it is not possible individually.

The disadvantages are the costs associated with the management of the fund, greater than in the ETFs, which can weigh the profitability.

Listed Silver Companies

Investing in shares of listed silver companies is the most direct way to invest in silver. We will differentiate two main types of businesses that operate in the sector with different business models: pure mining and royalty companies. In either option, we are exposed to greater risk than in the rest of the alternatives, which implies that we can enjoy both higher profits and higher losses. Within these two, the business model of royalties can be more interesting and less risky.

Seeing all the conflicts that are currently developing, the lower interest rates, the US elections, and the real risk of a slowdown, or even a recession triggered by the coronavirus, It seems not unreasonable to think that people will continue to support their investment strategy in buying gold with the aim of reducing risk and further diversifying their portfolio. Therefore, we could be looking at a good time in the cycle to buy silver.

Categories
Forex Assets Forex Basic Strategies Forex Trading Strategies

Trading Strategy For the CAD/JPY Currency Pair

In this article what I want to tell you is one of my strategies that is working well in real life using the CAD/JPY pair. Why this pair? I have chosen this pair as an example but will show you different trading systems using different currency pairs.

What is the Strategy Based On?

In a very simple system, you will know that my systems are characterized by that. The reason is that they tend to be the ones that last the longest and the most robust. You’d be amazed to see the simple systems that exist that have been producing good results for years and years.

First of all, what I’m going to show you next is a profitable, not perfect Forex trading system. The curves without falls or volatility are left to the martingales and gurus.

1.1 Criteria for entry

We will enter the market by purchasing in the CAD/JPY pair when there is an upward turn in the Accumulation Distribution indicator and the price opens below the simple moving average of 19 periods. We will do the opposite (we will enter shorts in CAD/JPY) when the AD spin is down and the price opens above the average. As I write this article we are short on this pair indeed.

1.2 Exit criteria

We will close the position we have taken provided one of these conditions is met:

1.2.1 Output per indicator

We leave the buying position when the Williams Percent Range indicator falls below the marked level (59, you can see in the chart above). We will also close our short position when it passes this level.

1.2.2 Exit by stop or profit

If the indicator has not already given us a sign of closure, we will do so when our operation reaches the loss limit of 60 pips (stop loss) or we have reached our profit target (take profit) of 220 pips. The interesting thing here is that a winning operation compensates us for more than three losing trades since when we achieve 220 pips we can lose three out of 60 and still not have lost money.

Statistics of the System

With the well-defined rules of our trading system, let’s see how it has behaved in recent years and what the main features are. Note that this system has not been optimized.

The stability in the balance line, as its name indicates, measures how the return curve behaves. Our goal is that it is as stable as possible and that there are no abrupt drops. The closer to 100 the better, so an 81.73 is good data. In addition, it is important to note that we have a sample of 300 trades so it is a significant sample. If I show you this strategy with 40 trades and it is winning, it can be a chance. Logic tells us that the larger the sample, the more reliable will be. Remember that we seek to minimize chance and bring statistics to our advantage.

It’s very important to know that you have up to 11 consecutive losing trades, but considering that the risk-to-profit ratio is 1:3, it is acceptable. One of my favorite parameters when choosing a trading strategy is the profit factor or profit factor. A PF above 1.5 is good. This ratio tells us how much our system earns when it pays compared to how much it loses when it loses. Simply put, our system on average earns more when it wins than it loses when it loses. And we’re very interested in this.

Another star point for me within a trading system is return/drawdown. Why? Because it is a yardstick to measure what has fallen the profit curve and that profit obtained. When you do real trading you don’t only care about the return, but you care about how to get that return and try to minimize these drops. A ratio of 7.48 is more than okay.

What Can We Expect from this Strategy?

Let’s see how this strategy behaves by comparing buying and short transactions. Not bad. Both when the CAD/JPY pair has maintained a trend and when the pair has steered without a clear direction the lengths and the shorts have remained stable. Now we see those falls as they are. There are no peaks too strong and they are also kept under control.

Is It a Forever Strategy?

This strategy is not the only strategy I apply and it will not last forever. It is a strategy of a portfolio of systems that I apply in an automated way in Forex. It is a portfolio that rotates with rules of connection and disconnection of systems depending on their behavior.

You must understand that there are trading systems whose statistical advantage disappears and that you must therefore stop trading. This is nothing else that stops being profitable because a certain pattern is no longer profitable. This happens on a day-to-day basis with some businesses, with trading also happening, for example, when a large number of traders exploit a method. The advantage disappears, therefore.

Instead of applying or learning the foolproof method of trading on Forex or any other asset, learn to measure what you are going to apply before, during, and after. If you can measure, you can improve, but above all, you can make informed decisions.

Is This the Best Strategy Ever?

The goal of this article is not to remove the arsenal. But it is a system that I have been applying in real life with good results. The important thing is that you understand that a simple strategy can work very well over time, that you need data to evaluate it and criteria to manage it. And that this is all just a work plan.

Categories
Beginners Forex Education Forex Assets

The Big Mac Index: How Much Does the USD Really Cost?

The real dollar rate can be defined using the cost of the Big Mac in a particular country. “Burgeconomics” is not an absolutely accurate indicator of monetary incoherence. But this index has been set as a global standard, is included in some economics manuals, and is the subject of academic research.

This Big Mac index was first considered by The Economist in 1967. So this burger cost 47 cents. After 20 years $1.60. Now a Big Mac costs $4.30. From here it follows that the dollar over 50 years has depreciated tenfold. Of course, this does not mean that in 50 years the dollar will depreciate another 10 times. Although, a certain trend is clearly visible.

How to know the real cost of the dollar using the Big Mac index?

The Big Mac index is normally used as means to informally determine purchasing power parity. With your help, I can calculate the real value of the dollar against the ruble. Why? McDonald’s uses a franchise with strict quality regulation of the production of the components of each of its dishes, for example, all the bread around the world are baked by the same company with the same ingredients and the same machinery, In addition, all the restaurants in the chain follow the same manufacturing process. In short, this means that the production of the Big Mac in each country uses a completely identical technology, respectively, the production/sales costs will be the same.

A Big Mac also contains enough food components (bread, cheese, meat, and vegetables) to be considered a universal prototype of the national economy. Well, Big Mac is the burger that’s on the menu at “McDonald’s” in every country. Well, don’t waste time looking for the prices of this burger on the official website, as the resources created and specialized will sweep away prices from around the world and be meticulously added to a table.

In 2018 in the US a Big Mac cost 5.51 dollars, and in Germany, it cost 3.99 euros. We divide 3.99 by 5.51, we get 0.72 euros, that is, how much a US dollar actually costs. Consequently, the real price in US dollars to euros is 0.72, based on the Big Mac index.

What does the dollar rate depend on?

Let’s analyze in this chapter whether macroeconomic indicators, Fed outlook, international risks affect the US currency rate. What influences the cost of this currency? Not long ago, witty people joked that the price of oil may fluctuate depending on whether the prince of Saudi Arabia coughs or not, but few will argue that the figure of the US president is now much more important than Riyadh’s blue blood.

The US president is the most authoritative person on Forex, however, the sensitivity of the market to his words in the first years of the presidency was associated with the element of surprise. Before Trump, rarely did any head of state intervene in the life of Forex, influencing the monetary policy regulated by central banks. Little by little, the market got used to it and began to turn a blind eye to Trump’s words about the dangers of a strong dollar. In fact, there’s a significant difference between what you say and what you do. Trump’s policy is to strengthen the green note as if he does not want to weaken it with words. In this sense, the growing popularity of the US president leads to a revaluation of the dollar.

From a theoretical point of view, the rate of the currency is influenced by the financial flows of trade and investment. The demand for foreign currency has been determined by the interest in products manufactured in this country. However, as the economy and public debt grew, stock and bond markets also increased. New issuers of securities appeared, whose demand led to a change in the exchange rate. Including the USD. Normally, at present, investment flows are more mobile or larger, but foreign trade should not be discounted when studying exchange rates.

When an investor makes the decision where to invest, in US shares or other shares, he judges based on the state of the economy. Overall, world GDP is believed to be growing faster than US GDP, as the former includes developing countries and China. For China, a growth of 6% is normal, for the US growth of 3% is something incredible. As the world economy expands faster than the US economy, money flows to emerging international markets. On the contrary, the acceleration of US GDP under the influence of fiscal reform or the Fed’s monetary expansion is a great opportunity to buy US shares and the dollar.

In this sense, such external stimuli as trade wars or coronavirus should be considered in on the direction the world economy will take and that of the US. The latter remains stable, the former, under the influence of a slowdown in China’s GDP that is beginning to decelerate. As a result, the dollar is strengthened even in the context of a drop in the rate of federal funds.

So, no matter how much Trump would like to weaken the dollar if his goal is to accelerate GDP to 3% and reach new historical highs of the S&P 500 or forget about devaluation. The excessive protectionism of the US president and his slogan “America first!” means achieving the goal at the expense of others. Trump is not satisfied with the US foreign trade deficit and is doing everything possible to reduce it. However, let us remember, improving trade flows is a direct path to the growth of the national currency rate!

Along with the stock market situation and the trade balance, Treasury bonds also influence the value of the dollar. Demand for them is driven by an interest in safe-haven assets, which increases in periods of confusion and uncertainty, and by the Fed’s monetary policy. It is no secret that the federal funding rate is now higher than its counterparts in other developed countries. Consequently, the return on US treasury bills is higher. They seem more preferable than European and Japanese values, and that helps transfer capital to the New World and strengthen the dollar.

Devaluation and Overvaluation at an Exchange Value

Currency volatility has a big influence on the economy, but most people don’t pay attention to it, as most transactions are done in the national currency. An ordinary person is interested in the exchange value during the trip, paying for goods, any purchased or financial transfers.

Small investors can be satisfied with the strength of the local currency as it reduces the costs of imported products and travel. But a substantially strong currency can sometimes hurt the financial sector in the long run. Industry becomes profitable, in the market, millions of people are left without work. Ordinary people may be dissatisfied with the local currency weakening, as tourism and imports become more expensive, but the devalued currency can give many benefits to the national economy.

The exchange value of a currency is the tool of a central bank, an important sign of monetary policy. So, directly or indirectly, a currency devaluation or overvaluation affects many variables. It will affect interest changes, returns on an investment portfolio, prices for goods and services, employee value. We will study the devaluation and overvaluation of some currencies in real examples.

In the monthly USD/JPY chart, it is clear that the yen is growing stronger against the US dollar. This trend may continue because the Big Mac index indicates the devaluation of the yen against the dollar. Values continue to fall in the coming months. The yen devalues to the US dollar by 36.58%, which is significant. It can only affect the economy of the Japanese country. But the reality is that Japan may be interested in this imbalance. The Japanese obviously want to sell their products, and artificially devalue the national currency.

You must remember that the national currency is strictly in Japan. We have been alert about how the Japanese yen grows or falls in price for no reason. The value of the yen remains difficult to predict. Also for the New Zealand/US dollar pair, the kiwi devalues and can grow strong against the US dollar. According to the Big Mac Index, it was devalued by 16.37%.

The value of the kiwi depends heavily on the crop cut in New Zealand, in prices for certain products and food. So the price could go up. Also, the pair could operate in the same direction for a long time, up and down. Visually, you see that price moves in the middle of your trading range.

The Euro also devalues against the dollar by 16.37%, so it can continue to raise the price. However, EUR/USD could rise to 1.23 and fall to 1.035. A price of $1.23 may also suggest that the euro is suffering a devaluation. And as we always say, the Forex market is always unpredictable and surprising.

If we listen to the Big Mac Index, the Australian dollar is devalued by 14.57%. AUD is relatively cheap but can change soon. It is clear from the AUD/USD chart is close to your local minimum. The price chart used to raise to 1.10 USD for an “Aussie”. Indeed, you must not wait for the same thing soon; it looks like the hike will follow.

The Australian economy and economic sector depend on the price of gold. For example, If the price of precious metals falls, Australia’s financial sector suffers. But the graphics of gold and AUD/USD is not completely the same. Australia exports gold, but this country also exports a lot of iron, food… High prices for these products can withstand the “Aussie”. Australia can make the Australian dollar low in value. The Canadian dollar is also devalued. If you study the Big Mac cost table, you will see that the “loonie” is 12.16% devalued. USD/CAD was operated at 1.60 and 1:1.

Will the Canadian dollar continue to rise? In reality, no person can safely claim, but the Big Mac index may be correct, indicating it. USD may fall against CAD. It is, of course, over the long term. The Swiss franc pair – the Japanese yen is the most demonstrative of the popular currency pair, characterized by its strength in one currency and the weakness of the other. The yen is falling (-36.58%), and the Swiss franc is the strongest (+27.2%) of all. Most likely, the yen will get stronger and the franc will go down. The value of the pair can go down. But at the very least, the Big Mac index suggests this.

The US dollar pair – the South African rand is illustrative. The Rand is clearly devalued (57.34%). However, it is actively on the rise in recent times. Rand could be even stronger, as this currency is difficult to predict. According to the monthly chart, it can be assumed that the current trend will continue. Necessarily, you require a lot of attention not only to the Big Mac index but to “how far” the price can go.

When the price goes too low, it grows more sharply. And the opposite way, when the price is too high, it could fall. Rand, like the “Aussie”, depends heavily on the price of gold. South Africa currently produces a lot of gold. The country’s financial sector and economy are heavily dependent on the price of gold. In addition to gold, South Africa produces a lot of platinum (the world’s largest producer), iron, cobalt… Certainly, we should take all this into account if trade this currency pair.

If you operate USD/ZAR you should also know that there can often be social unrest, attacks on the offices of gold-producing companies, and other setbacks. If there were any problems in South Africa, then the Big Mac Index will not be based on trading decisions. If investors withdraw their capital from the country, factories close, gold mines are blocked, then the national currency falls in value very quickly. The dollar can also devalue fast. It is not the gold standard. However, the price of gold also changes all the time.

If the United States Federal Reserve changes the interest rate, this will be the most important. And then, it won’t be important how a Big Mac is. The price for the burger will not be significant. For example, in 2008, the dollar dropped sharply when the interest rate dropped to 0-0.25%. In addition to the Swiss franc, there is an overvalued Norwegian krone by 11% and Swedish krona by 9.79%. These currencies have traditionally been overvalued. But, this fact must also be taken into account in trading. Over-valued currencies can fall in price, especially against devalued ones.

Big Mac: Both cheap and expensive

Why is Big Mac so expensive in Switzerland? First, because it’s an expensive job. A Swiss worker earns tens of times more than a worker in Egypt. The Big Mac index is also affected by other factors such as time. In Switzerland, it’s very cold for six months of the year, you have to heat buildings…

Costs are also expensive in Sweden and Finland. The cold climate is considered a difficult factor in these countries. It’s no surprise that a hamburger there is much more expensive than in other countries. It depends a lot on changes in inflation. For example, in Argentina in 2001, where there was a very violent crisis, a Big Mac was cheap because labor was very cheap, and prices for many products fell drastically if they were converted into foreign free currency.

You cannot estimate the total economic performance of a certain country, based on the Big Mac index alone, which should be taken into account as well. For example, Japan and Thailand are very close to each other, and according to the Big Mac index. However, the income of Thais and Japanese cannot even be compared. Thailand has cheap labour in its favour, and Japan benefits from the automation of many processes and the efficient use of labour. For example, to do some tasks, there are few people needed in Thailand. But the same task can be completed by a simple operator in Japan.

Why is hamburger so expensive in Canada? In Canada, in fact, many legumes are produced, oil… But certainly, the weather conditions in the country are extreme. If, for example, in Russia, there are some regions where tropical plants can grow, it is completely impossible in Canada. Heating is expensive, especially during the extreme cold of winter. The Labrador Current cools the country, being expensive for payers and employees tax.

However, the Big Mac index is of interest to traders from Western countries with strong currencies, rather than those from underdeveloped countries.

Conclusion

What conclusion should you draw regarding the Big Mac index when trading currency pairs? This index cannot be entirely accurate or a reference for action. But, the Big Mac index very often suggests an appropriate judgment in a certain currency if it is devalued or overvalued.

Categories
Forex Assets

A Comprehensive Guide to All Forms of Gold Trading

Investors will always try to diversify their investments in order to reduce their risk. Specifically seek the investments of safe haven that have a better when the rest of the market drops. Of these safe investments – treasury bills, Swiss francs, and others, investors think gold is the best. For this reason, you will see that investors often include gold in their portfolios. Now with COVID19, gold is the order of the day and has a lot of attention from investors

Gold as Merchandise

Like any other asset, the price of gold is determined by demand and supply. Most of the world’s gold comes from hard rock mining, but it can also be produced by alluvial mining methods or as a by-product of copper mining. China, Australia, and Russia are the largest gold producers in the world. Regarding demand, the main use of gold is jewelry production. It is also used in aerospace, medicine, dentistry, and electronics. Governments and central banks are gold buyers.

At present, the United States is the largest holder of gold, while Germany is second and the International Monetary Fund ( IMF) third. Private investors like you are also interested in buying gold and treat the purchase of gold as an investment. For this reason we have thought to make this guide.

Why are private investors investing in gold? Instead of keeping money in cash, investors can buy gold when they expect a recession, geopolitical uncertainty, inflation, or currency depreciation. Sometimes they keep it as insurance against the market crash. You can’t always predict unwanted events, so it makes sense to keep assets that do well as protection against a market crash.

Over the past 40 years, gold has recorded significant gains from 1979 to 1980 and from 2000 to 2011. It fought during the 1990s and after 2011. Fears of inflation and recession led to gold peaking in 1980, while several events caused gold to be traded higher after 1999. The 9/11 attacks and the war in Iraq kept the price high until 2003. The insurance purchase was behind the gold surge in the 2007 recession. It continued its upward trend as the market traded downwards, with economic uncertainty as to the main issue.

Problems in Europe, the weakening of the US dollar, and concerns about economic recovery kept the price of gold high until 2011. Do not think that gold behaves itself or always well. It has had difficulties during the 1990s due to GDP growth in the US, interest rate increases in 1995, and a strict fiscal policy. After 2011, the strength of the U.S. dollar and the U.S. economy damaged gold. The stock market broke a downward trend and became an upward trend and investors were not as interested in owning gold as insurance. So, now you know a little more about gold and why people can invest in it, let’s see how you can invest in gold

Investing in Physical Gold

If you want to expose yourself to gold, one way is to buy gold jewelry, gold coins, or gold bullion. Gold bullion is traded very close to the price of gold and may refer to gold bars or gold bullion coins.

Gold bars have no artistic value, which differentiates them from jewellery or coin. To buy gold bullion you must pay a premium on the price of gold that can be in a range of 3 to 10 percent. You will also need to use a vault or bank deposit box to store it. You can buy physical gold online, at a jewelry store, or at another gold store.

Before buying, make sure that the price is right, the gold is real and proven, and that you’re not paying a higher premium for collector coins if you’re just looking for pure gold. Be willing to move away if these rules are not possible to comply with, in particular, if it is an online store or a shop window of dubious repute.

A trusted online store with a 4.9 rating in the google store is Silver Gold Bull, which not only allows you to buy gold, but will also store it, and buy it back if you decide to sell it for a profit. When you buy gold, you need to store it properly. It is possible to store it at home, but security problems could arise in this case. If you prefer to do so buy and keep it at home, make sure you have a proper safe, and take steps to protect your property.

Buying Gold Futures

Futures contracts are standard contracts traded on organised exchanges. Allow an investor to sell or buy an underlying in a given time in the future and at the price of the futures contract. First, you need to open an account with a broker. My recommendation is to use Interactive brokers as it is the broker I use 20 years ago and has never been a problem.

The gold futures contract at the Chicago Mercantile Exchange covers 100 troy ounces (ZG), although there is also a future smaller Mini that has no physical delivery (QG). To operate it, it is necessary to deposit an initial margin, which is a minimum amount necessary to open a position. Every day your position will be marked to the market. This means that if the value goes in your direction, you will get a profit, but if it goes against you, you will lose money.

If your account falls below the maintenance margin, you will need to transfer money to your account to meet the securities required by the broker. Futures contracts are leveraged instruments. You only need the balance of your account to be equal to the initial margin, which is less than the value of the entire contract. A 100-ounce contract is currently worth about $170,000, and you only need an amount less than $10,000 to open a position.

Some brokers do not have the delivery option, so the contract is settled in cash when it expires. Maturity is also a standardized feature of the gold futures contract and investors can choose their time horizon based on standard maturity. The prices of subsequent maturity contracts may be higher than the spot price and early maturity futures. When this is the situation, we usually say that the financial market is in a quagmire.

In another situation, when the spot price or the price of early-maturity contracts is higher than the price of late-maturity futures contracts, we are behind schedule. If you find yourself buying gold at the time the market is in contango, you additionally will have to pay a premium for contracts later due.

Invest in Gold ETFs

If you’re not a fan of investing in gold futures, you can try gold ETFs. Instead of having a futures contract and paying attention to the maintenance margin, you can buy shares in ETFs and get gold exposure.

If this is the first time you’ve been able to invest in ETF before and want to start, you must understand its operation well. Once you choose a broker, just open an account and choose your preferred gold ETF. The most popular gold ETF is SPDR Gold Shares (NYSE: GLD) and costs 0.40 percent per year to own it. ETF follows the price of gold bullion.

Investing in Gold Mining Companies

An investment in gold mining companies offers gold exposure, but exposure is sometimes limited. These companies carry operational risks, which can break the correlation with the price of gold. Gold miners are at risk of default and their shares may be quoted lower in case of an operational problem with the company, regardless of the price of gold.

ETFs seem to be the best way to invest in gold. If you don’t like to own futures and control initial and maintenance margins, you can buy shares in an ETF and follow the price of gold bullion. GLD is a liquid instrument and does not have high transaction costs. Futures are sometimes difficult to handle, so ETFs can be the right move.

Invest in Gold CFDs

If you don’t want to open a futures account or don’t have that much capital, you can buy gold CFDs at a regulated broker. In these cases, the investment can be from about 1000 euros in a regulated broker. The fundamental aspect that you have to pay attention to is in the Swap, which is the daily cost that the broker will charge you for keeping a CFD from one day to the next.

Categories
Beginners Forex Education Forex Assets

Gold As Part of a Diversified Investment Portfolio

Today we’re gonna talk about what diversification means and gold as part of a diversified portfolio. Finally, we will analyze the gold, what has happened in recent months, and what we expect from it in the coming months.

If we want to define diversification we could do it as a way to invest in different assets with the aim of reducing portfolio risk. There are different theories and formulas, but the important thing is to understand that the assets in which you invest have to be totally or partially uncorrelated. Investing in BBVA and Telefónica at the level of decoupling is of little use. It obviously implies a small diversification (although only sectoral), but they are quite correlated assets. If the bag goes down or up, as the beta of the two is very similar, the two will go up and down. As we can assume, this is not the best way to reduce risk or volatility. The same would be extendable, for example, to the case of buying the American stock exchange: within being diversifying (geographically), we would be doing it with a highly correlated product.

If we want to define diversification we could do it as a way to invest in different assets with the aim of reducing portfolio risk. To make effective and real diversification we have to do it by investing in assets that have a correlation close to 0, both positive and negative. To diversify you can combine many assets, but there is a limit after which, even by increasing the number of assets in a portfolio, you do not reduce risk (It is called systemic risk).

Some theories say that this number varies between 8 and 12 assets, but depends a lot on whether they are separate assets, funds, or sectoral indices. To make effective and real diversification we have to do it by investing in assets that have a correlation close to 0. To build an efficient portfolio, we need to know the volatility (variance of the assets that make it up), and its correlations. Thus we can estimate the optimal diversification of a portfolio (also called an efficient border).

It is important to note that the correlations of these assets, which make up a portfolio, vary over time. For this reason, the composition of the portfolio has to be adjusted if we want to have optimal and efficient diversification.

One of the great virtues of the Seasonal Quant Multistrategy Sphere, FI is precisely that it is not correlated with any other asset as it develops a unique strategy based on the seasonalities of raw materials. For this reason, it can perfectly be part of the diversification of an efficient portfolio, more when it has really low volatility and therefore is suitable for the vast majority of investors.

Lately, there have been many comments from permanent portfolios, which are always on the market, but we think that in the case of gold this is not entirely true. You have to know how to choose the moment, as in many other investments, since gold can bring negative returns to the portfolio at certain times and even increase volatility. Let’s see it.

For starters, let’s compare the long-term behavior of gold with the SP500 index and 10-year American bonds (treasuries). We take the VOO (ETF of the SP500), the GLD (ETF of gold), and the TLT (ETF of long-term bonds). The comparison began in 1974 after the gold standard with Nixon ended in 1971. It coincides that it is the first year that has long-term bond data. “Heavy spending for the Vietnam War”

Gold has its moments, in 1974 it goes up 72%, while the SP500 goes down 26%. During the dot.com bubble gold rose by 21% (2000-2002) while the SP500 fell by 38% and in the last crisis 2008, the SP500 fell by 38% while gold only rose by 8%. In 1980 gold was quoted at 590/oz and in 2005 it was worth the same.

Combining an asset always with another asset with which it has a near zero or negative correlation does not help much if the asset in question is not of absolute return. And it has its times as bad as gold. I mean, you have to know the time to have it in your wallet.

Gold may be a safe haven currency, it even seems to beat inflation during the comparison period, but not having much more utility should not be added to a permanent portfolio as a long-term investment, because in many cases it has very negative returns and adds volatility to the portfolio. In addition, it often does not serve as coverage in bad times, as has been shown.

“If you look at the March data, we see that they have all dropped, gold, equity, and bonds. Something incredible. We call this total correlation.”

Let’s give an example, if we stop to observe in the March data, you see that they’ve all gone down, gold, equity, and bonds. That’s amazing. We call this total correlation. Assets that a priori should not move in tandem, do so and this destroys any portfolio. This is the reason why the management team of the Seasonal Sphere Quant Multistrategy, FI thinks that you have to have gold in your portfolio, but selectively and punctually. We have already taken a position and will continue to ponder it as long as external factors indicate that it is reasonable to have it because it can provide profitability and control of volatility.

What happened in the past months and what we expect from GOLD in the coming months? What happened in March to make everything correlate? To find out the best time to have gold in the portfolio we believe it is important to know what happened in March and the previous months with gold.

There are two main reasons for this March downturn. The first is in the futures market. The fact that speculators are strongly positioned long hands does not like it. The good thing about being all leveraged is that with a small move you clean up the market and this is precisely what happened. Strong hands shake the tree a little so that those who can’t keep warranties close (they’ll buy back in highs and help raise the price further when strong hands come off.).

And the cleaning of the market came:

We have seen the fastest decline in the equity market in years, even I think we can say the fastest in history (in days). Liquidity has been reduced even in the high-quality bond market and all accompanied by a rise in bestial volatility.

A rise in volatility leads to higher collateral margins for participants, that is, the money they need to take into account every day in order to keep their leveraged positions open. And as many operators lost in equities and fixed income the shortage of volume made them sell at worse prices, because many chose to sell what was still in profits and had liquidity. This dragged to the market at the time when everything went wrong. It rarely happens, but it does happen, so it’s important to diversify a portfolio with the right assets.

In addition, the market needed to be cleaned up so that something out of the ordinary could happen and the market could return to highs. We can observe that during the mass liquidations of March, more or less 100,000 contracts (100000x100x1720= about 17.2MM (nominal billion) have left the market, giving the green light to see new highs. In addition, there have been two more events, the Coronavirus (Covid-19) which is an event not expected by anyone (we have also seen how it has put the world economies against the wall) and of course, as expected, central banks all agree to mass-print money (more than ever) as a theoretically infallible remedy to exit the crisis. We will see in the future how the experiment ends.

With the current price of the future of gold over $1,720, a significant volume of open positions on call 2,500 this December, but also on call 3,000, and even on call 4,000. In addition, there is still a very strong interest for the call 3.500 and call 4.000 of June 2021. Therefore, and although we know that options positions are often part of a more complete portfolio, combined with futures or with options spreads, we conclude that there is a very strong bullish bet on gold by the market.

Categories
Beginners Forex Education Forex Assets

NASDAQ: What Forex Traders Need to Know

It is possible to invest in Nasdaq in a simple way, both in the general market (through an index) and in individual stocks. Just choose the financial instrument that best suits your needs and open an account with a broker. Nasdaq is the name of a financial market, usually associated with technology, but why? What advantages does this have? One of the most important questions is, how is it possible to invest in this market?

What is Nasdaq?

The term Nasdaq is an acronym. It corresponds to the National Association of Securities Dealers Automated Quotation (National Association of Securities Dealers Automated Quotation). It is a market; a stock exchange. The largest in the United States behind the NYSE (New York Stock Exchange). This market also has its own representative indices, and they also adopt the name Nasdaq (which we will see shortly). It is worth noting that the Nasdaq Stock Market does not have a physical location (such as the New York Stock Exchange parquet), but is based on a telecommunications network.

The birth of the Nasdaq, as a stock market, takes place when the Securities Exchange Commission (SEC), the US stock market regulator, asked the National Association of Securities Dealers (NASD) to regulate the OTC (Over The Counter) market in the ’60s.

To give us an idea, before the Nasdaq saw the light of day, in the United States, the stocks of companies could be bought and sold in three ways:

  • At the New York Stock Exchange (NYSE)
  • In the American Stock Exchange (AMEX)
  • Outside a stock exchange (OTC market; “over the counter”: agreements between two parties, outside an official market)

Buying and selling OTC stocks is not illegal, however, neither are all the guarantees of security, transparency, liquidity, etc. Therefore, the SEC called for a better organization. This led to the automation of the market (by the NASD), which has already been discussed and, thus, the NASDAQ was created in 1971. But there was a question that did not end up pleasing: it was still an OTC market and therefore a second category market. The companies listed in the same began in this way because they could not access the “real parquet”. In other words, his ambition was to go on the AMEX market and, as a climax, enter the NYSE (the largest stock exchange).

In order to have the opportunity to be listed on the stock exchange, different companies must meet a number of requirements. However, the conditions imposed by the NYSE are very strict and make it difficult for young companies to access. In this way, many companies started trading in this new market. These were mainly technology firms and, for this reason, the Nasdaq has always identified with technology. Its fully electronic operation also influenced the attractiveness of companies belonging to this sector.

But the National Association of Securities Dealers Automated Quotation (NASDAQ) was not willing to be a “second-class” market. Thus, in 1975, it developed its own listing rules and separated the stocks of stronger companies from the OTC. In 1982 the most powerful companies of the Nasdaq split up and created the Nasdaq National Market. Finally, in 1991 stock market regulators recognised the stocks of Nasdaq companies as equal to those listed in AMEX or NYSE.

Currently, this market is operated by the company Nasdaq Stock Market (later privatized). In addition, it is par excellence, the market where technology companies (electronics, biotechnology, telecommunications, computing) are listed. Companies such as Microsoft or Intel are listed on this Stock Exchange. On the other hand, its popularity came from the hand of the great Internet bubble, in the 90s.

We should look at all the listed companies, analyse them one by one and make an average of the movements they have experienced individually. In this way, we will have an idea of whether the market, in general terms, has behaved bullish or bearish. But there is a simpler way: take a set of the most representative stocks and, through an average (weighted, in most cases) of the share price, check their evolution. This is precisely a stock market index.

As we discussed earlier, investing in an index is like investing in the market as a whole. In this case, investing in a Nasdaq index is investing in a basket of securities composed of a number of more representative Nasdaq companies: Follow the evolution of an entire market.

Nasdaq 100: The Nasdaq 100 index was created on 31 January 1985 and is made up of the 100 largest technology companies listed in the Nasdaq Stock Market (actually there are 103, since 3 of the companies that make up the index issue two classes of stocks). It does not include stocks of financial companies (nor those dedicated to investment); for this reason, the Nasdaq 100 represents the technology sector well. The Nasdaq Stock Market is open to both US and foreign firms (since 1998). In this way, this index reflects the performance of the 100 largest companies in the technology industry in the world.

Nasdaq Composite: This index is composed of all companies listed in the Nasdaq market. In this “Electronic Stock Exchange” are traded securities of more than 3 thousand companies. It may include stocks of financial, investment and technology companies in general.

Nasdaq Biotechnology: Nasdaq Biotechnology is part of the pharmaceutical and biotechnology companies listed on the Nasdaq Stock Market (and only listed on this market), as well as other requirements).

Nasdaq Financial: includes all financial companies that have been excluded from the Nasdaq 100.

Why Invest In Nasdaq?

Not all stocks listed on the Nasdaq are purely technological. But this market has a strong orientation to that sector. In the Nasdaq 100 index, technology has a weight of 54%. In it, we can find the leading companies in this industry worldwide. The good evolution of technology firms has traditionally been associated with an expansive phase of the business cycle. However, because of the great social changes we are experiencing, technology is increasingly present in our lives.

Technology has a real application in any aspect of our day today. Just to mention a few examples:

  • Transportation (vehicles increasingly equipped in comfort and safety).
  • Telecommunications (social networks, new forms of leisure and information, B2C, B2B, 5G, etc.).
  • Health care (robotics, biotechnology, etc.).
  • Financial services (electronic banking, Fintech, Robo advisors, Blockchain and cryptocurrencies, etc.).
  • Computer science (home automation, cloud computing, artificial intelligence, big data, etc.).

Although some analysts and investors talk about the possibility that a bubble could be created by the growth experienced by this sector in recent years, The fact is that the profits registered by technology companies and the progress they can experience cause the value of this type of company to also be increased.

Many companies in this sector are in the top 10 of the largest companies in the world:

  • Apple
  • Microsoft
  • Amazon
  • Alphabet (Google)
  • Alibaba
  • Facebook

So, it’s very possible that we find solid values, rich in liquidity, and with a good balance sheet position in the technology sector.

Technology companies have also always been associated with volatile securities. This is partly true: the volatility of this sector, little by little, is being equated with that of more mature ones; they no longer have the risk potential of the 1990s and during the year 2000 (when the “dot com” bubble burst).

To sum up: this is an industry with growth potential. The disruption caused by technology is causing a change in this type of company. We can no longer talk about a high-risk sector as a whole; it has stable companies.

In any case, technological companies are characterized by the need for constant innovation, the quality of management is a factor that should be studied. These are high-growth values. Good management can make a difference (and turn a company into the new Facebook or Netflix). Just remember that “Resources must always be allocated in the most efficient manner!”

Categories
Forex Assets

How Much Is Google Worth? A Trader’s Guide to the Search Engine Giant

I will first comment on the balance sheet and its risks but I hope I will not go too far, as it is a company with few debts, with very strong financial health, and with quite limited risks in my opinion. After this, we will move on to its valuation by multiples, by discounting cash flows, and its valuation of the sum of the parts.

Balance Sheet

Regarding its financial health, it has a Current Ratio (remember that they are current assets/current liabilities) of 3.37 and a Quick Ratio of 3.35 that is the same but subtracting the inventory from the assets, although as we see this item is practically insignificant. Around 1.5 is usually a good ratio, in this case, we see how the weight of its assets far exceeds liabilities.

Profit and Loss

With respect to its consolidated income statement, in 2018 and 2019 it made profits in excess of $30 billion, although in 2017 it was quite lower, about $12 b. This is largely due to the provisioning of taxes for the sanction it had for monopolistic practices. After seeing the profitability and margins we will look at what are some of the risks of Alphabet.

Profitability and Margins

Except for the exceptional situation of Alphabet in 2017, the ROE is usually around 16%, obtaining more than 18% in the last 2 years. Something similar happens with the ROA, around 13%. While the ROIC tends to be most of the years between 30-40%. In the case of margins, they are not as high as in previous years, but they still have a gross margin of more than 55% and a net margin of more than 21%, which is very good.

Trading Risks

Of course, as with any investment, there are always risks, and these are some of the ones that the company itself comments on. If you think they’re missing something, leave it in the comments. 83% of sales come from advertising. If advertisers’ spending is reduced, or limitations appear when displaying ads or personalizing them, the business could suffer a lot.

Competitors

Disruption, interference, or failure of our information technology and communications systems could damage our ability to provide our products and services effectively, which could damage our reputation, financial condition, and operational results. The occurrence of a natural disaster, the closure of a facility, or other unforeseen problems in our data centers. 

  • Regulatory Risk. Antitrust, privacy, tax laws.
  • Privacy and data protection. Any scandal here would affect the company.

Rating by multiples of Alphabet

As we have already said, for a business of the magnitude and quality of Alphabet it is almost impossible to compare it with other competitors. This is because there is no other Alphabet that competes directly, instead, we have multiple competitors fighting for different business segments. Therefore, it is most likely reasonable to compare with Alphabet’s own historical multiples. Here I will focus only on two multiples that for me would be the most important in this case, such as P/FCF and EV/EBITDA.

Review of Google based on Price to Free Cash Flow (P/FCF)

Number of shares = 688.8 M

Median over the last 15 years 33.45

Price per share = 1206,57€

Market Cap = 831,085 M (price per share*number of shares)

Free Cash Flow (FCF) = 28.457 M

P/current FCF = 29,20 (Market Cap/FCF)

How much is Google worth according to its EV/EBITDA?

If we take the historical median of 15.89 as a reference and expect it to return to that level of EV/EBITDA we would have:

EV/51.506 = 15.89 –> EV = 15.89 * 51.506 = 818.430 M

Estimated EV = 818,430 M

EV per estimated share = €1,188.20

Dividing 818,430 M by the number of shares we would have an estimated EV per share of 1,188.20 €.

And what would be the safety margin in Google?

Safety margin = [ 1 – (Market price / Intrinsic value) ] * 100 [ 1 – (1055,78 / 1.188,20) ] * 100

Safety margin = 11.14 per cent

Valuation by Alphabet Cash Flow Discount:

We have an estimated EV per share of about $1,333 and an estimated price per share of $1,501.  This represents a safety margin of 20.80% and 19.62% respectively. In this case, we see how the margin has been increased with respect to the multiple valuation methods, although here only by increasing by 1% up or down the return we demand on this investment (Personal required rate of return) the valuation changes substantially.

Valuation by the sum of the parties:

I will take into account both profit and free cash flow and assign other multiples. In addition, I also include an estimate of the debt since it has historically been very small but in recent years it has experienced a growth that we should take into account. First, we’ll see how much Google is worth based on your cash flow, then we’ll add your cash and Waymo’s rating. Then we will deduct the debt and finally divide it by the number of shares. So we will have the estimated price of Google to 3 years seen.

Why change multiples?

Well, Google has historically quoted around 20-25 times benefits or FCF, but as we’ve seen before we get around 33 times compared to FCF and 28 times benefits.

Considering this, let’s leave it at 25-30 times FCF and 24-28 times benefits.

How much is Google’s 3-year cash flow seen based on its profits?

1) Expected growth rate between 10% and 15% over 3 years

Historically it has traded around 28 times the benefits. We will take a conservative range of between 24 – 28 times.

2) Your benefits in three years will be:

  • 34 B current at 10% for 3 years are 45b.
  • 34 B current at 15% for 3 years are 51b.

3) How much this will be worth in 3 years by applying multiples of 24 and 28 times:

  • 45B x 24 times/# of shares = 1,568 € per share or Market Cap of 1,080,000 M
  • 51B x 24 times/# of shares = €1,777 per share or Market Cap of 1,223,998 M
  • 45B x 28 times/# of shares = 1,829 € per share or Market Cap of 1,259,815 M
  • 51B x 28 times/# of shares = €2,073 per share or Market Cap of 1,427,882 M

How much is Google’s 3-year cash flow seen based on its Free Cash Flow?

1) Expected growth rate between 15% and 20% over 3 years.

Google’s FCF growth has been 17.5% in the last 10 years, 24% in the last 5, and 34% in the last 12 months. We remained in a conservative range of 15% – 20% FCF growth and multiple of 25-30 times.

2) FCF in three years will be:

  • 28 B current at 15% for 3 years are 42.5 B.
  • 28 B current at 20% for 3 years are 48 B.

3) How much this will be worth in 3 years by applying multiples of 25 and 30 times:

  • 42.5B x 25 times/# of shares = 1,542 € per share or Market Cap of 1,062,130 M
  • 48B x 25 times/# of shares = €1,760 per share or Market Cap of 1,212,288 M
  • 42.5B x 30 times/# of shares = 1,851 € per share or Market Cap of 1,274,969 M
  • 48B x 30 times/# of shares = 2,090 € per share or Market Cap of 1,439,592 M

Obviously not, everyone must make their own analysis and we have seen that by varying the valuation method we get different prices. I personally am not buying at this price, as I see it likely to buy at a better price with a higher safety margin.

Categories
Forex Assets

The Definitive Guide to Forex CFD Trading

Although it is a basic term within trading and forex, in this article I will explain what CFDs are and what they are not. I begin almost necessarily by telling you that CFD, as you know, corresponds to the acronym “Contract For Difference”, which translates into Spanish as “Contract For Differences”. It is a financial product in which the differences between the purchase price and the selling price of a financial asset are settled. When we talk about Forex specifically, about a pair of quoted currencies.

Yes, a CFD is a derivative instrument, or what is the same, it is issued on the price movements of an instrument listed in a market (referred to as the underlying asset), but without being able to physically purchase that asset. Only the benefit or loss of the transaction is charged or paid, but ownership of the asset is never acquired. CFDs have no maturity, the open position in the market can last as long as the trader deems necessary.

Index
  1. How CFDs are valued
  2. How to operate CFDs

2.1. Why an expert trader chooses to trade CFDs

  1. Why trade CFDs instead of shares
  2. Trading platforms to trade CFDs
  3. Characteristics of CFDs
  4. Trading strategies with CFDs

6.1. Risks of trading CFDs

6.2. Learn how to calculate the profits and losses of your CFDs

  1. Who can trade CFDs?
  2. Advantages and disadvantages of using CFDs
How CFDs are Valued

In case you are wondering how CFDs are valued, they are contracts with a broker who issues them, unlike for example the shares that are acquisitions of assets in the market. Typically, the broker offers two prices around the asset’s quotation, one for the purchase (which the trader is supposed to sell) and one for the sale (when the trader wants to buy); these prices are what you can see as “bid” and “ask” respectively.

In forex, standard contracts are called lots and are equivalent to 100000 units of the base currency. Although there are also mini-lots (10000 units) and even micro-lots (1000 units).

For example: if we buy 2 CFDs (2 lots) of the currency pair EUR/USD, it means that we are carrying out an operation of 200000 euros. If the pair is quoted at 1,1200, according to the ask price of our broker (one euro equals 1,1200 dollars), the value of our position would be 224,000 dollars.

How to Operate CFDs

To operate CFDs you only need to establish a contract with a broker that issues these financial products, opening an account with it, and providing an amount of initial capital. Generally, the whole process is done online. When opening an account, the broker usually provides all the tools necessary to trade CFDs, including the trading platform where market analysis is performed, purchase orders are issued and the capital contributed is managed.

Trading with CFDs is as easy as buying, launching a purchase order on the aforementioned trading platform when a price increase is expected. As well as selling when you expect a decline. CFDs are bought and sold as if they were the asset on which they are issued, with the advantage that it is not necessary to own them in order to sell them. It is possible to sell first and repurchase later to close our position (this operation is called “short investing”, “short position opening”, etc.).

To undo the operation, you just have to throw an order opposite to the opening one, even though the platform itself allows you to do it in a simpler way, simply by choosing the option “close position” (or similar).

Why Expert Traders Choose to Trade CFDs

A skilled trader knows how to handle financial markets (which doesn’t mean he always makes a profit), handles risk well, and is able to control his emotions. In this sense, trading through CFDs is an option if your goal is to use leverage. Trading with CFDs has a number of advantages and a number of risks that we will see below. Risks are controllable if you have the knowledge and a necessary methodology (an expert trader has these two characteristics). Once these two skills are achieved, trading CFDs can be an option to consider.

Trading and trading with CFDs requires:

  • Protect capital at all costs, managing the risk of each operation.
  • Think of trading CFDs as a business and not a hobby.
  • Create a strategy and follow it with absolute discipline.
  • Don’t overleverage yourself.
Why Trade CFDs Instead of Shares

When buying shares in a company, a part of the ownership of the company is acquired. In other words, we are shareholders and we are linked to the business of this company. However, we can only sell the shares if we have previously purchased them (unless they are requested on credit). Short transactions are therefore difficult: we can only have a profit if the shares are revalued. With CFDs this changes, it is possible to make money with upward and downward movements.

With the cash shares, we will not have leverage, we must disburse 100% of the purchase price of the same. This means that the volume of operations is limited to our capital in the account. In this case, the investments will require more maturation time, because they need more price travel to obtain an acceptable profit. Intraday trading, even short-term trading, becomes almost impossible unless a high amount of capital is available. Finally, when buying shares a physical purchase is made, you have ownership of them and this fact requires incurring commissions and additional costs.

Trading Platforms to Trade CFDs On

There are many trading platforms to carry out trading through CFDs. Generally, it is the broker himself who provides this tool to the trader when opening an account. There are brokers that have designed their own platform, others, on the contrary, offer it under a customer terminal, but it is not their property and can be used by various intermediaries. Some platforms you can find to trade with very popular CFDs are Metatrader 4 and 5, Visual Chart, Pro Real-Time.

Characteristics of CFDs

The main characteristics of CFDs are the great flexibility they provide, added to the leverage capacity. As I have told you before, are financial products with leverage, the trader does not need to deposit the entire value of the investment. Simply by providing a percentage of it as a guarantee to cover possible losses (margin required) it is possible to open a position with a much larger volume. The potential profit is increased because it is operated with the capital in excess of that actually available.

Liquidity is another of its characteristics, we can buy and sell at the desired time (the Forex market is always operating from Monday to Friday, 24/7) without worrying about the counterpart.

Trading Strategies for CFDs

A trading strategy is about maintaining rules, both for the analysis and for the execution of the trade. The strategy determines the purchase and sale decisions of CFDs, as well as the time, the asset, the volume of the transaction, the potential profit, maximum allowed loss, etc.

To establish a trading strategy with CFDs, the first thing we must decide is the tools we will use for our operations in the market:

Price action.

  • Trends: follow-up and rupture of these.
  • Use of technical indicators to determine market momentum or depletion.
  • Operate according to economic news and other key data.

In addition, the trader must define its style when trading (according to the time duration of the investments in CFDs):

  • Day trading
  • Swing trading
  • Position trading
Risks of Trading CFDs

The risk of trading CFDs comes precisely from the use of leverage. Trading with more than available capital means that each market fluctuation has a greater impact on the trader’s account, whether in favour or against.

An unfavorable operation, if you don’t have proper risk management, can damage your money. When the margin runs out, the broker will require a new contribution or close the position. Be careful because here you must already assume the corresponding loss.

The maximum leverage level for CFDs on the Forex market for major currency pairs and for retail traders under the ESMA regulation for European customers is 1:30 (which means providing a margin of 3.33% on the volume of the actual trade), in accordance with current regulations. So, in this way, the risk of CFDs is limited.

How to Calculate Profits and Losses

To calculate the profit or loss when trading with CFDs, the first thing that will be necessary is to take into account the costs of the transaction.

The main fees charged by CFDs brokers are:

Spread: the difference between sales and offer prices (mentioned above). They are usually a few points and are usually loaded at the time of opening a position. For this reason, trading with CFDs starts with a small loss.

Swap: also called “rollover” or “night premium”. This commission has as a concept the daily interest of the money that the broker lends us for leverage. It is a charge or credit to our account each day, depending on the difference in the interest rate of the two currencies of the pair in which you trade.

Once the costs are known, the factors to take into account to calculate our profit or loss from the position with CFDs are the following:

The contract size or volume of the position (in the base currency).

  • The opening price of the position.
  • The closing price of the position.
  • Gains or losses are determined: (Contract size*Closing price) – (Contract size*Opening price) – Commissions.

In Forex, the minimum price move is called “pip”. A pip is a variation in the fourth decimal place of the currency pair, except for the pairs involving the Japanese yen, which will be the second decimal place. The number of pips earned or lost by the value of each pip (depending on the volume of the position), less the commissions applied, results in the gain or loss.

Then we will have to convert profits or losses into the local currency at the exchange rate.

Who Can Trade CFDs?

Basically, any person with the ability to contract and who has available capital to invest is in perfect disposition to trade with CFDs. In other words, simply by being of age (and not being legally incapacitated) and contributing an amount as capital, it is possible to open an account with a CFD broker and start trading. Trading CFDs is within the reach of anyone because it is not necessary to have a large sum of money.

Advantages and Disadvantages

The advantages of operating with CFDs come from the characteristics of these products, as we have seen above:

-We will only have to deposit a part of our capital as a guarantee, being able to increase the amount of our trading operation.

-The liquidity of the profits obtained is immediate, we can withdraw the profits once obtained.

-They offer the possibility of short trading with the same ease of long trading. The trader can make profits even when the market drops.

-They are extremely agile, it is possible to perform operations of a few minutes duration. Thanks to CFDs and the leverage they offer the trader can take advantage of the slightest movement of the market.

-They require, in most cases, lower commissions than the sale of physical assets.

-They are available to anyone, it does not require much capital to trade with CFDs.

With regard to the disadvantages of:

-Leverage is the risk factor for CFDs, which can be both an advantage and a drawback at the same time. Comprehensive risk management is needed; for this reason, expert traders choose CFDs: they are masters in risk management.

-Although these products do not lack reliability and transparency, they are not quoted on an organised market.

-Daily interest payment is required due to the money borrowed by the broker in the leverage.

Categories
Forex Assets

The Most Competitive Advantages of Google

The value of the search engine lies in the fact that practically everyone uses it to browse the internet. This network effect also occurs in other products such as Youtube, Android, Google Play apps, etc.

In this sense, Alphabet’s strategy is based on creating the best service at no cost. And when it already has the largest market share, that’s when it already focuses on monetizing it. That’s why today it has services like Android (with almost 90% market share on smartphones) that are still not exploiting and that will most likely do in the future. Or for example also Google Maps, the best browser that has ousted the famous but outdated TomTom. These last two cases are examples of future revenue sources that we do not see their impact on the accounts today.

They also have a clear cost advantage, both for themselves and for customers who pay for their services. In the case of Alphabet, it is not a capital-intensive sector requiring huge investment and high fixed costs. This implies that if their income grows, expenditures do not grow in the same way, since they are capable of generating economies of scale.

In addition, their advertisers also allow them to get the most out of their money invested thanks to all the information they have stored about the behavior of their users. If someone can invest $10,000 in advertising, they probably prefer to do so by targeting their target customer to the maximum rather than investing that $10,000 in a newspaper ad with many more targeting limitations.

I have already mentioned the main competitive advantages but there may still be some more. If you notice this or see service within the Alphabet ecosystem that has some competitive advantage don’t hesitate to put it in the comments.

Alphabet Manager Team

To get into this topic you need to explain the three types of actions that are in Alphabet to actually check who is in charge.

Class A Stocks (GOOGL):

These stocks have the right to vote at shareholders’ meetings (1 vote for each share). Anyone can buy them.

Class B Stock (cannot be purchased):

These stocks have the right to vote at shareholders’ meetings (10 votes per share). Here Larry Page and Sergey Brin (the founders) own 84.3% of the class B stocks, allowing them to secure 51% of the voting rights. In other words, even if a single person were to hold 100% of the type A stocks, they would still have less voting power than the founders. 

Class C Stocks (GOOG):

These stocks do not have the right to vote at shareholders’ meetings. Anyone can buy them. Alphabet uses this class to create its stock options to reward workers. It also uses these kinds of actions to make its buybacks.

If it did not buy back stocks, this class would increasingly dilute shareholders. In recent years, despite large share buybacks, the trend was more diluted, with more stocks in circulation each year than the previous one. Although in 2019 there has been a very aggressive repurchase of stocks that has stopped this trend in its tracks by returning to levels before 2015 in terms of the number of stocks in circulation.

Next, I will focus on the founders, Larry Page and Sergey Brin, who although officially no longer have responsibility seats in the company in the end are still in charge. We could go deeper but the article is already getting too long.

To analyze the management team we can look mainly at three things:

  • Do you have skin in the game REAL?
  • Past results?
  • How have they allocated their resources?

Alphabet Managers

We already know that skin in the game means sticking your neck out, that is, that one way or another, the results of a company are tied to individual interests. Wow, the managers are gambling their rooms, too.

The real thing is, there may be traps here.

In smaller companies, perhaps we can see that the maximum responsible owns 30% of the company (or more) so we assume that it has skin in the game. Note that this manager can also have a portfolio of investments that include other companies and that 30% of that company corresponds to 1% of its total portfolio. Do not fool yourself because there is skin in the game, little.

Another important question is whether managers have spent money to acquire the stocks or simply earned them with stock options for their performance in their jobs. Better if we know that managers buy their stocks than if they “give them away”.              

Google’s Results

As Sergey Brin and Larry Page have been the founders and have remained in the company throughout this time, we can assume that a good part of these results are attributable to the management of both.

The results we know have been spectacular. They’ve turned Google into one of the largest companies in the world with a market capitalization of more than $700 billion, with more than 100,000 employees, with an annualised sales growth has been 20%, this growth has been maintained in the last 10 years and a free cash flow growth of 17% (24% in the last 5 years).

There are several businesses in which you have a dominant market share, great competitive advantages, and still with many assets that you are not exploiting and that could start to monetize soon.

How have they allocated their resources? Here we should look at what they do with all the money they earn. If they use it to pay off debt (they have very little). if they distribute dividends, if they invest in organic growth (in their own business), inorganic growth (acquisitions)… Alphabet doesn’t give out dividends, which I think is reasonable given that they are able to grow at rates close to 20%.

Acquisitions

One of the most famous was Youtube. It seemed an expensive price to pay $1.65 billion back in 2006… However, to this day Youtube is still the leading video portal on the web and only in 2019, they entered for advertising on Youtube $15b. From a perspective, the price paid doesn’t look bad.

Another example was when Google bought Android for $50 million in 2005. By 2016, it had already generated $22 billion in revenue. In addition to this, every year more than 1.5 billion smartphones are sold. Let’s assume that about 1.300 carry the Android operating system. If Google had charged manufacturers only $1, it would have $1.3b more in its accounts. If I had charged $5 it would mean $6.5b, and if I charged $10 it would be $13b more, that is, almost the same as what was entered in the Youtube advertising ($15b).

This may sound like milk stories, but it’s likely to end up happening, as the alternative for manufacturers would be to work to launch their own operating system, and this would definitely be more expensive than paying the premium that Google puts down for using Android. For all this, it is clear that the directors of Google will be wrong in some decisions, but it seems that to date the management of the company we can value it at least remarkably.

One Last (Important) Thing…

Now that we know the business of Alphabet, how it earns money, its competition, the quality of its management team, and its competitive advantages, we only need to see the most important…

How much is Google really worth and how much are we willing to pay for an Alphabet action? This will be discussed and discussed in a future article called… How much is Google worth?

Categories
Forex Assets

Little-Known Tips for Trading Commodities In Forex

Negotiating the realm of raw materials may be new to many of you, but in the end, doing so is very much like negotiating any other financial instrument. The first thing to decide is which broker you will use. There are CFD markets, futures markets, and a variety of options markets that can help you access commodity markets. To help you make this decision, just look at how much money you have available to negotiate.

Size Matters (When It Comes to Trading Raw Materials)

Size matters when it comes to raw materials. This is because of futures markets. Futures markets are defined contracts that give you the option to trade several raw materials. To place a transaction in the commodity market of your choice, you need to have the necessary amount of margin to open that position, just like in the Forex world. In this situation is where futures markets could be a little expensive for some people. While some raw materials are cheaper to trade than others, some raw materials require an initial margin of more than 5000 USD for a contract. Beyond that, standardized contracts mean there is only one tick value available. For example, if you sell crude oil, each tick is worth 12.50 USD. There are “mini contracts”, but they are usually not as liquid and are still very expensive for some traders.

This is where CFDs suppliers of raw materials come into play. These contracts allow you to negotiate less than one full contract, mainly because you are not actually operating in the futures market. You are negotiating a contract with your broker to pay or receive the difference between the opening price and the closing price. This is why your broker can offer the equivalent of 1 bale of wheat compared to the standard contract size, for example. In that sense, CFD brokers may be a good option to consider.

A final option may be to trade raw materials in the options markets, but lately, the options have been extraordinarily volatile and costly. Similarly, binary options have had a lot of bad press lately and, in general, can be extraordinarily dangerous because of the large amount of leverage they offer.

The Fundamental Factors Differ

Keep in mind that the fundamental factors in commodity markets can be quite different from the factors you are used to if you are a stock trader or foreign exchange trader. This is because these are real “things” and not necessarily about companies or economies. To take an example, several years ago there was a long series of floods along the Mississippi River and the surrounding area of the United States. This had a great effect on the price of wheat because of the floods they became a problem. The destruction of crops reduced the supply of wheat to the market, which naturally led to an increase in prices.

This is why so-called “soft” commodities in futures markets, which are usually products that grow on the ground, can be a little difficult for some traders to negotiate as weather patterns become very important. Usually, when a currency is traded, you don’t have to worry about the weather, unless there is some kind of anomaly like a tsunami in Japan. In general, climate rarely enters the equation for Forex traders. However, traders in agricultural raw materials trading in wheat, maize, soybeans, and many other products are totally dependent on weather reports.

Precious metals are also a completely different financial instrument, as they often react to interest rate expectations from the Federal Reserve. Similarly, the price of metals is directly affected by the strength of the dollar, as most of the larger precious metal markets are denominated in this currency. This is why it is very important that you have knowledge about how the US dollar has high volatility before trading in gold, silver, or other metals.

The Liquidity Varies

Another thing to consider when operating in commodity markets is the liquidity of the market where it is traded. The fact that your futures broker offers the wood markets does not mean that you should participate in them, as they are very illiquid and are usually used for hedging more than for anything else. This would not be the place for retail traders to participate. There is a contrast with the pair of EUR/USD and you can notice that there is a big difference between the opening and closing a position. Many retailers have been adversely affected by the lack of liquidity in a market they do not understand.

Stick With What’s Important

It’s really funny that I recommend this because I don’t think it’s the case in the currency markets, (although many traders will argue the opposite). This is because the commodity markets have variable liquidity and, if you are involved in a futures contract, that liquidity may hurt you, as the value of the tick may be extraordinarily large in some of these contracts. This is why typical retailers should trade assets such as crude oil, gold, silver, corn, wheat, soy, natural gas, etc. Participating in milk, wood or even palm oil may sound exotic and therefore intriguing, However, it’s an excellent way to lose money.

This does not mean that you cannot deal with these raw materials, but you only need to have the right account size, something that is within the reach of very few retailers. At the end of the day, it is better to stick to markets that are much more stable.

In Summary

Find a broker, one that hopefully is regulated by a strong market authority, or maybe use one that you already have and that offers CFDs markets. As a retail trader, it is much better to initially use the CFD markets, because you can trade penny-worth ticks, compared to those large positions that are required in some of the markets. Remember that technical analysis, to some extent, works the same in all markets. The more liquidity the market has, the more likely the analysis is to work. That is the beauty of some commodity markets like crude oil because they are highly technical in nature.

Fundamental analysis can also be important for the negotiation of raw materials, as mentioned above, and news can also be important. Agricultural markets obviously focus more on climate, while crude oil can focus more on the Middle East. Demand is also a determining factor in the prices of raw materials. Beyond that, I have discovered that commodity trading works in much the same way as foreign exchange trading and is an addition worth considering for your long-term trading plan.

Categories
Forex Assets

Why Are Digitized Gold and Silver Perfect for Diversification?

Today, people have more and more investment options, from classics like gold and silver to recent innovations like Bitcoin and other cryptocurrencies. But there is one type of asset that has stood the test of time: precious metals. Here’s why what may seem like an old-school outdated product is still very interesting from the point of view of a young digital native investor.

A Brief History of Gold and Silver

The civilization of the Incas referred to silver and gold as “sun sweat” and “moon tears”. In ancient Greek mythology, gold represented the glory of the immortals. And even historical figures like Sir Isaac Newton believed in the long-discredited pseudo-science of “alchemy,” which aimed to turn basic metals into gold. The history of gold as money dates back to around 550 B.C. and government-issued fiat coins, such as the US dollar, used to be directly linked to gold in a monetary system known as the gold standard. And let’s not forget the statues of the Academy Awards, the World Cup trophy, or the medals for first place in the Olympics. All bright, beautiful, solid gold.

In January 2019 the purchase of gold by central banks reached its peak of the last 50 years, mainly because countries like Russia are changing their reserves from US dollar to gold. At the present time, the world consumption of newly produced gold is around 50% in jewelry, 40% in investments, and 10% in the industry. With 440 tons per year, China is the world’s largest gold-producing country. In January 2019 the purchase of gold by central banks reached its peak of the last 50 years, mainly because countries like Russia are changing their reserves from US dollar to gold.

Silver, on the other hand, remains the second most popular precious metal just behind gold. It is also used for jewelry, as an investment asset, and as an industrial resource. Many investors appreciate silver as an investment, as it tends to be more volatile than gold due to its lower trading volume.

Inflation-Proof Investment and Portfolio Diversification

Analysts have long argued that gold acts as a hedge against inflation and protects investors against market volatility and unpredictability. A general rule is to have 5-10% gold exposure in the portfolio.

For younger investors with higher risk tolerance and higher return expectations, gold might look like a conservative investment. But it can complement and enhance an investor’s overall portfolio by balancing technology-oriented assets with a time-tested commodity.

Gold is both a creator of wealth and a keeper of wealth. As young investors, you have to keep your eyes on the finish line, probably several decades in the future. Since people now live and work longer, long-term investment strategies that include stabilizing asset classes are crucial.

Why Digitize Gold and silver?

Possessing physical gold and silver has always been desirable for many. There is something tangible about it. Its physical quality means that you can see it, feel it, weigh it and admire its beauty. From a golden calf, a golden fleece and gold crowns to streets paved with gold, this metal has constituted a fundamental element of our collective human history and its images have filtered even into our language (for example, “as good as gold”, “worth its weight in gold”, etc.). In a word, gold is timeless.

There are companies that offer the best of both worlds: Purchases and possess digitized physical gold or silver. But you can exchange it with the same convenience and user experience you’re used to with other digital assets.

But possessing physical gold or silver has its disadvantages. You need to visit a gold trader or at least order physical coins or gold bullion at your store. Then you have to take care of security on your own and keep it at home. In case someone comes in and steals it, you need proper insurance and also a special safe to cover it. An alternative is to keep it in a safe deposit box at the bank or on a gold trader, which means you have to move there and pay relatively high commissions for it.

Categories
Beginners Forex Education Forex Assets

Fundamentals of the British Pound

The British pound, whose use spans across more than 5000 years, is the oldest currency in the world. Originating from continental Europe under the Roman era, the official currency of the today’s United Kingdom was once also a unit of currency in Anglo-Saxon England, equivalent to 1 pound weight of silver, dating back to as early as 775 AD. Derived from the Latin word poundus which translates as weight, the name of the currency we use today is still in use. 

The symbol £ comes from an ornate L in Libra, whereas the ISO code under which it is recognized globally is GPB. Unlike other currencies, the GBP has endured such a vast portion of history and now tells a tale of how a currency once set the grounds for the future. In 928, the first King of England, Athelstan, adopted sterling as the first national currency, and one unit of the currency could actually buy off 15 heads of cattle. The name sterling, however, came to use only after the Norman Conquest, initially referring only to pennies and not pounds. This anterior name is of vague origin due to its connections to esterlin, a Norman word for little star, and lesterling, an Arab word meaning money

In the late 1600s, upon suffering naval defeat in the Battle of Beachy Head, King William III established the Bank of England to fund the war with France. As the first central bank ever created, the Bank of England and the British helped create laws and principles which are today considered essential for regulating currencies. In 1717, for the first time in history, the country defined the currency’s value in terms of gold rather than silver, and the gold price of £4.25 per fine ounce set by Sir Isaac Newton lasted throughout most of the following two hundred years. 

The country first adopted the gold standard in the 1800s, supporting the idea that the nation should back up its currency with an equivalent quantity of gold reserves. The United Kingdom briefly left the gold standard in 1914 to support itself during the war, yet the heavy borrowing led to high inflation that considerably devalued the pound. In 1925, Winston Churchill returned to the gold standard only to come off of it a few years later, in 1931, when the sterling once again underwent a significant drop. The 20th century gave birth to another nickname of the GDP, the cable, due to the creation of the first trans-Atlantic telecommunications cable used for stock exchanges between New York City and London. The term became part of today’s vernacular to the extent that the phrase what’s the quote on the cable is understood easily as the interest in knowing how many dollars are needed to buy pounds. 

Overall, the British pound holds so much history and truly embodies the qualities of an enduring currency. The British were the first to put together a stable government and currency, which remained a safe haven for hundreds of years. Nowadays, the GBP has lost its previous value and power as it stands approximately third in reserves, right behind the USD and the EUR. The 2016 Brexit led to one of the worst falls of the GBP in history and the attempts to foretell the future of this once great currency seem more challenging than ever before.

The Bank of England

Under the rule of King William and Queen Mary, upon the issuance of the 1694 Royal Charter, the Bank of England was founded in the hope of promoting stability and providing benefits to the people, which are still held as dominant values of the institution. As one of the longest central banks in its entire existence, created right after the Swedish Riksbank, the Bank of England (BoE) served as a model for other central banks around the world. Today the bank’s responsibilities include the issuance of banknotes, control of the country’s gold reserves, and setting the official interest rates. The BoE has a dual mandate consisting of two main objectives – monetary stability and economic stability. The former involves influencing interest rates so as to deliver the objectives of the Monetary Policy Committee (MPC), whereas the latter entails ensuring liquidity, together aimed at promoting growth and employment in the British economy. 

While the Bank of England bears the responsibility for printing money, it only includes the territory of the United Kingdom, while Ireland, which uses the EUR, is exempt from its authority. What is more, the BoE issues notes in both England and Wales, but Scotland and Northern Ireland can also do the same through several other banks. Coins are, however, manufactured by the Royal Mint, an export mint located in Llantrisant, South Wales. Since its opening by the Queen in 1968, the Royal Mint has been in charge of making and distributing the United Kingdom coins and supplying blanks and official medals. This government-owned institution now makes coins and medals for approximately 60 countries a year. 

Another important segment of the bank involves the Monetary Policy Committee (MPC) that consists of nine members – the Governor, the three Deputy Governors for Monetary Policy, Financial Stability and Markets and Banking, the Chief Economist, and four external members appointed directly by the Chancellor. These members are selected based on their expert knowledge of economics and monetary policy in order to decide on the best monetary policy action for the Bank of England to keep inflation low and stable. As of March 16, 2020, Andrew Bailey is the Governor, replacing Mark Carney. The new Governor was said to be the favorite choice in a number of media due to his extensive experience in the field of banking and, in particular, previous responsibilities and successes at the Bank of England. 

Some say that the BoE has been the main pillar of support of the United Kingdom during the past crises. The country’s economy is believed to fall into crisis approximately every 70 years and some past events, such as the Great Fire of London or the aftermath of the tea hegemony collapse, can support this viewpoint. It appears that every time the economy collapses the Bank of England steps in to provide support and safeguard the country and the currency against complete destruction. The Bank of England now has another task of helping the UK’s economy withstand the outcomes of Brexit-related decisions, which will be discussed later in the text, as one of the strongest factors impacting the country in the past few years.

UK Economic Reports

  • GDP Report

The GDP reports come out in three stages: the initial, the actual, and the final. Similar to the US GDP reports, the preliminary estimate is the most relevant piece of information as it first produces insight into the country’s economy. At the same time, this initial GDP report is also the least accurate, which is why the data is then revised in the following two reports. The current data shows how GDP is estimated to have fallen by a record of 20.4% in Quarter 2 (April to June), which was the second quarterly decline in a row after falling by 2.2% in the first quarter (January to March) this year. Despite the poor performance in the second quarter, the UK’s economy did see some improvement in June upon the easing of governmental decisions on lockdown (see the chart below). Currently seen as the worst in all G-7 states, the country’s GDP is estimated to fall by 8.3% in 2020, with a 6% annual growth rate anticipated in 2021. The UK’s economy is believed to rely heavily on social outdoor activities and the implications of the pandemic and related decisions can already be felt, as seen from the latest GDP report.

  • Claimant Count Change

Claimant Count Change is a monthly report that provides information on the employment changes upon measuring the number of unemployed people in the UK during the reported month. It is interesting to note how the Claimant Count Change averaged 3.70 thousand between 1971 and 2020, reaching an all-time high of 858.10 thousand in April of this year. The last report issued on August 11, 2020, signaled weakness in the labor market, with the number of people claiming unemployment benefits having gone up by 94.4 thousand to 2.7 million in the previous month.

  • Inflation/Monetary Policy Reports

The quarterly Inflation Reports comprise the Monetary Policy Committee’s economic analyses and inflation forecasts that are further utilized in making interest rate decisions. As of November 2019, the Inflation Report is called the Monetary Policy Report, yet its purpose has remained the same. The last Monetary Policy Report that came out on August 6, 2020, reported the impact of the COVID-19 pandemic on reducing jobs and incomes in the country. The report includes information on the assistance provided by the Bank of England to UK citizens. Moreover, the Monetary Policy Report states where the economy is in comparison to the overall monetary policy of the BoE. The Bank of England has already put effort into returning inflation to the 2% target which aligns with its 1989—2020 average of 2.53%. Inflation is considered as one of the key indicators used in trading in the spot forex market. Traders are generally advised to keep informed in order to understand the situation in the country at the time for trading.

  • Retail Sales

The Retail Sales report is an in-depth analysis of the latest macroeconomic and consumer trends affecting the UK retail industry. The last report issued in June 2020 indicated a 13.9% retail sales increase, which marks the second monthly increase in a row, resulting from the early economy recovery stages from the effects of the pandemic. Quite interestingly, while the United Kingdom’s retail sales averaged 0.23% between 1996 and 2020, they reached their all-time high of 13.90% in June 2020 and a record low of -18% in April of the same year. The next release of the report will be issued on August 21, which should give more information on whether the previous two-month increases will continue, further maintaining total sales to the pre-pandemic levels.

  • Manufacturing Report

Deemed the most vital indicator for the UK manufacturing industry, the Manufacturing Report reveals the manufacturers’ contribution to the country’s regions with regards to past 12-month output, jobs, investment, and business confidence and export. Over the last year, the UK has been largely affected by the attempts to leave the European Union and the impact of the COVID-19 pandemic, which have caused prolonged industry volatility. UK manufacturing production’s 1969—2020 average of 0.42% was exceeded by far in April of this year with an all-time low of -28.40%. The last statistics in June indicate a fall of 14.6% in comparison to the previous year, but the forecasts seem to be more positive for the following 12-month period.

The Most Traded Pairs

  • GBP/USD

GDP/USD or the cable is probably the most frequent currency pair traded that, like EUR/GBP, has a lot of volume with an estimated 15% of the total daily volume of forex transactions. As it comprises two of the most traded currencies in the world, the focus of attention is often pointed towards this particular cross. This week’s economic calendar is rather quiet and the chart below reveals a continuation of a bullish pattern. Nonetheless, with the Brexit talks ever-present, the pair could overall entail slightly more volatility than usual.

  • GBP/EUR

These two major currencies rank as one of the top eight most frequently traded currencies in the world. From the perspective of daily forex volume, the EUR is second only to the USD, with a market share of 39.1%, whereas the GBP ranks fourth with a 12.9% market share. This currency pair is said to be significantly less volatile than other EUR- or GBP-based crosses due to the economic closeness and interdependence between them. Nonetheless, the (ongoing) changes in monetary policy between the central banks of the UK and Europe can make this pair highly sensitive. 

  • GBP/JPY

The GBP/JPY currency pair is said to be quite a volatile pair. As a low yielding currency, the JPY is commonly used as a funding currency of trade. Therefore, since the GBP belongs to one of the biggest economies in EUT, this particular pair can reveal the state of the global economy. It also reveals risk-off moves in the market resulting in the development of strong trends exceeding thousands of pips.

  • GBP/CHF

The lower volatility of the pair is said to originate from the economic and geographic proximity of the two nations with both the GBP and CHF used as reserve currencies around the globe. This pair along with the ones mentioned above fall under the more liquid group of pairs, whereas outside this particular set, one can find some more exotic crosses.

  • GPB/AUD

This currency pair reveals a lot of big moves that signal a much lower value of 100 pips than in pairs such as NZD.JPY for example, where 100 pips would equal a 1.3% move. In this currency pair, however, the same number of pips would turn out to be only a 0.5% move up or down. The percentage return will demonstrate the amount that a trader can expect to get. A number of GBP crosses typically entail many pip moves and, whenever the GBP is traded, smaller position sizes are to be expected owing to the fact that the base currency is as high. 

Interest Rates

The GBP is generally believed to be doing better than the USD or JPY similar to other risk-on European currencies. Compared to other central banks, the Bank of England’s current 0.10% does reveal it to be one of the lower interest rates on the spectrum. At the same time, the current interest rate of the United Kingdom poses as a record low in the 1971—2020 average of 7.36%.

Trade Deficit

Like the US, the UK imports more than it exports which leads to large trade deficits with foreign countries.  In April of 2020, the total trade deficit of goods and services, without non-monetary gold and other precious metals, dropped down to 7.4 billion GBP in the past 12 months, with imports falling by 34.6 billion GBP and exports falling by 7.8 billion GBP. The total trade deficit for March 2020 was revised up by £2.7 billion to £4.0 billion, driven by a £2.2 billion downwards revision to services imports. These revisions also include the impact of the adjustments of GDP balancing applied to component series (including trade) to improve the alignment of the quarterly GDP position. The overall changes in the trade of the United Kingdom are presented in the image below and were certainly impacted by the strained relations with the EU and the overall state of the global trade under COVID-19.

Economic Activity

In order to understand the general state of the economy of the United Kingdom, one should look into the previously discussed GDP reports as well as FTSE (Financial Times Stock Exchange). FTSE 100 is the index of the 100 companies listed on the London Stock Exchange that will generate insight into the UK’s stock market. The chart below is an example of how the set of indices can provide market participants with information on the performance of the UK equity market. The current situation seems to have improved since the major drop in March of this year, but the likelihood of the return to the pre-pandemic state is still questionable.

Brexit

When Britain voted to leave the European Union in 2016, its currency plunged on world markets and 2020 still offers no actual resolution. The UK has officially rejected the notion of extending the transition period until December 31, 2020. After the video conference between UK PM Boris Johnson, European Commission President Ursula von der Leyen, and European Council President Charles Michel, both the UK and the EU came to terms with having more negotiations in the summer months so as to come to an agreement ahead of the EU summit on October of the same year. With both sides showing a willingness to mitigate the tension, the EUR/GBP currency pair seems to be caught in between the risk sentiment and Brexit. GBP improves along with the improvement of risk sentiment, yet the lack of Brexit progress drags the currency in the other direction.

The various currency pair charts above reveal the progression of the GDP across the years. It appears that the UK’s official currency has suffered quite a lot in the past few years. Upon the 2016 referendum, the GBP fell 8% against the USD and 6% against the EUR. The initial hopes of a weaker currency to increase exports and raise demand for the UK goods/services did come through to a certain degree, but the trade deficit is still very much present. The exports have been increased by the weaker GBP and the unexpected increase in import prices has led to a reduction in pay and, therefore, a drop in consumer demand. Some predictions of the future of the British pound are quite gloomy as some economists believe that the GBP could drop to the 1.10—1.19 USD range should the UK leave the EU without a deal.

Furthermore, without the trade agreement, the economy could shrink by 8%, which would lead to an employment crisis. The overall implications of the unresolved relationship challenges between the UK and the EU are already vivid; for example, after the Brexit referendum, the Dow Jones decreased 600 points, removing $2 trillion from the global markets. A sharp increase in the USD versus a weakened GBP and EUR could obstruct US exports, causing difficulty in the US manufacturing sector, already encumbered by the trade war with China. Apart from the US, the JPY was also feared to experience a major surge in value due to investors’ tendency to flock to domestic currency.

The past December election in the UK was believed to be able to bring some relief, yet 2020 witnessed more negotiations and equally unresolved questions. The possibility of coming to a mutually beneficial deal (termed soft-Brexit in the media) may help the GBP surge in the following months. The currency market is expected to remain unpredictable until the resolution of current matters and the economy was publicly described as high risk by Governor Andrew Bailey himself. The long-term consequences of the UK leaving the EU are largely unknown, very much like the realization of the Brexit supporters’ hopes of economic growth and the pound’s appreciation.

The UK appears to be putting extra efforts in maintaining and preserving the economy, especially with the support of 300 billion GBP of quantitative easing. Combined with the COVID-19 pandemic, the UK’s Brexit struggles seem to be magnified despite the country’s attempts to keep the economy under control.

2007 Financial Crisis

The British economy was said to have been booming with UK tourists visiting the US and the financial sector enjoying the golden days before the financial crisis of 2007. The GBP soared from 2002’s 1.40 up to 2.10 USD in October of 2007, when it decreased by 35% to 1.40 USD at the beginning of 2009. The United Kingdom is believed to have been affected by the crisis more than other countries due to several factors: without a big manufacturing base, the economy depended on financial services, real estate, and retail sales for development. The growth was not based on strong grounds and it heavily relied on credit borrowing/lending.

The bubble burst in 2007 and once the housing prices dropped and credit sources dried up, the economy of the United Kingdom was left in dire straits. The impact of the 2007 crisis would remain long-felt with numerous consequences. The moment the big banks understood what was happening, bank-to-bank lending was reduced immediately.

The number of financial institutions that would still borrow discovered that the interbank lending interest rate doubled and the credit ensuring costs increased as well. Once the lending ceased, the effects were already felt across all sectors and especially in the housing industry. The FTSE 100 dropped by 5.5% in January 2008, which was perceived as the greatest loss since the crash of 2001. Soon people found it difficult to pay mortgages, resulting in fewer retail sales. Cutbacks in housing and retail sales were followed by a number of redundancies and unemployment was staggeringly high.

All of the events further aggravated the already weekend UK economy. With such a vast number of people unemployed, there was a decrease in tax revenue and the downturn continued with the fourth consecutive quarterly drop of GDP at the end of 2008.
In the hope of jump-starting the economy, the UK government reduced the VAT rate, but the effects of the crises were already too severe. The 31.3% FTSE decrease in 2009 was the biggest annual drop since 1984 and the economy just kept shrinking. The financial crisis caused a global recession with many assuming that it resulted from the recklessness of bankers.

The UK’s GDP fell more during the 1930s’ Great Depression and the GBP overall experienced elevated volatility during the entire period of the crisis. The GBP/USD hit a 26-year high in 2007 and the pound kept revealing difficulties in equities and the banking industry. Soon after, in January of 2009, the GBP market hit a 24-year low against the USD, repeating a similar scenario to the one with the EUR in 2008.

Conclusion

With the virus spreading across China in December and January, most UK businesses seemed to be preoccupied with Brexit. The ramifications of these external factors are yet to be seen, but one may see the current GBP struggles as part of its long-lived pattern. The Bank of England has once again stepped in to help the troubled economy and the benefits of those steps are already noticeable. The pound has indeed lost its safety position, placed somewhat in the middle. The currency tends to appreciate more during an economic expansion, so we have yet to see some major moves as the UK’s economy further stabilizes. 

The negative impact of Brexit on the GBP has been extensively documented over the past years, but considering the current selloff, one cannot but recall a previous episode of intense Sterling selling: the financial crisis. Investors seem to be fearful of the GBP difficulties and history seems to be repeating. The UK’s deficit is masked by a secure flow of investor capital, which in turn maintains the value of GBP above where it would be if it only reflected imports/exports. The pound largely struggled towards the beginning of the month of August, with the number of virus-inflicted patients rising across the country. 

The global economy also went through a difficult period, but the GBP experienced some bigger moves against the USD, returning to 1.30. Looking throughout August, the final resolution of Brexit is still far ahead and the expectations of a new trade deal between the UK and the EU keep the tension up.  Aside from the Brexit-related challenges, the virus pandemic also affected the currency market, making it even more unpredictable. August is witnessing the release of several important reports (GBP already came out a few days ago) and traders should pay attention to market volatility and adjust position sizing accordingly. At 1.31 USD, the GBP stands firm ahead of new Brexit negotiations.

Policymakers are said to be meeting soon to discuss the relationship between London’s financial sector and the EU market. The past weekend economy was predicted to be soon seeing a rapid recovery from the impact of the virus on consumer spending. Last, the British pound is estimated to be trading at 1.30 by the end of this quarter and at 1.28 in the upcoming 12 months.

Categories
Beginners Forex Education Forex Assets

Fundamentals of the United States Dollar (USD)

The safe-haven currency, the United States dollar, known under the ISO symbol of USD or nicknames such as dollar and greenback, has enjoyed a prestigious position as the leading global currency for many years now. Although now the most traded currency worldwide, the USD only took over the throne from the GBP in the late 1800s, that is the early 1900s, which compared with the country’s inception on July 4, 1776, is in fact a rather short period. The USD has experienced times of crisis in the past, and especially now, amid the COVID-19 pandemic, the questions regarding the currency’s strength arise. Surrounded by a plethora of news, which keeps coming out daily, and the US institutions issuing statements in lieu of the current state of affairs, the USD once again defends its long-held unique status among the world currencies.

History of USD 

Before the late 1800s, the British conquest of half of the world helped establish their dominance, rendering the GBP the strongest currency for a period spanning a couple of hundred years. The recognition of the new standard, that is the view of the USD as the new currency of value, resulted primarily from the country’s strong economy and functioning government. Consequently, this new market became also the biggest market in the world with the USD growing to be the most desired currency worldwide.

Now bearing the title of the world’s reserve currency, the USD is the currency of choice whenever foreign governments desire to hold onto their money. As they prefer not to keep these funds in their own currencies, they rely on such diversification mostly due to the need to increase the level of safety. The need for such an approach is most prominent in a small country with an unstable government experiencing numerous ups and downs. If a country keeps all the wealth in their own currency, they risk endangering their financial stability in times of instability or crises, which is why other countries’ safe currencies are employed.

History keeps records of such cases where a country put practically all their eggs into one basket, in a manner of speaking, leaving the country in utter chaos. The notorious example of Zimbabwe, which kept printing more money to the point where it became entirely worthless, should serve as a 30-year-old example of why countries prefer to keep their reserves in more stable currencies such as the USD. The United States’ currency is the standard nowadays which is why many countries across the globe prefer this currency over the others.

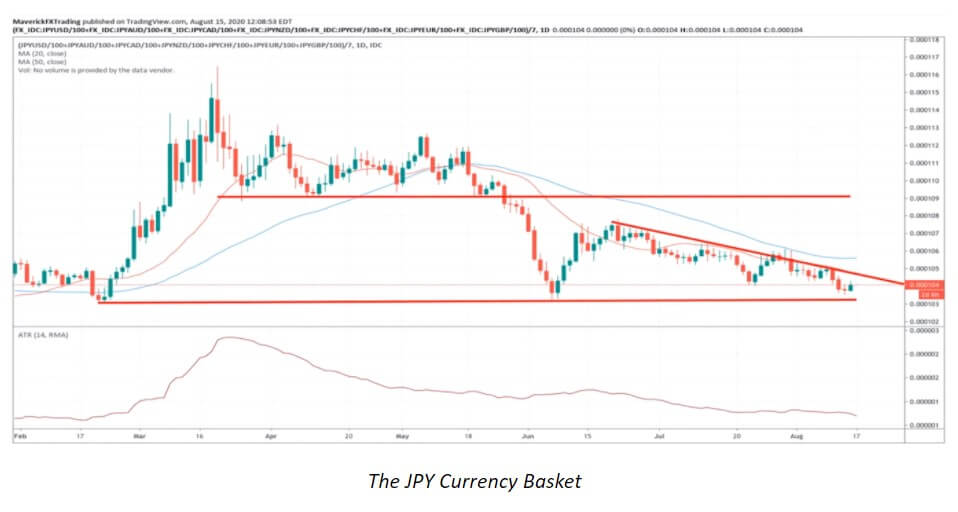
The many stories discussing, for example, China buying the US government’s debt are actually the stories of how foreign money is invested in the USD. Even the currency’s value decline due to China’s massive spending involving hundreds of billions of dollars upon their preparations for the Olympics could not shake the USD’s long-term stability. Amid the booming of the world economy, feeling afraid of how this prolonged decline of the USD could impact their reserves, other countries finally decided against keeping their wealth in this currency. The news started to circulate, the tension just kept building up, and the financial collapse hit in the middle of these speculations. Nonetheless, all other currencies except for the USD and JPY fell in value. The event proves the point that the USD is an exceptional currency with the best track record and a strong economy to back it up.

Each time other countries, aside from the United States, have some additional reserves, they often choose to buy the USD, which is generally bullish for this currency. However, whenever countries undergo challenging periods, they may typically decide to sell a portion of their USD holdings which has a negative impact on the currency. Generally looking at the connection between the USD and other currencies, most currencies have historically been pegged to the dollar at some point, especially around WWII and after.

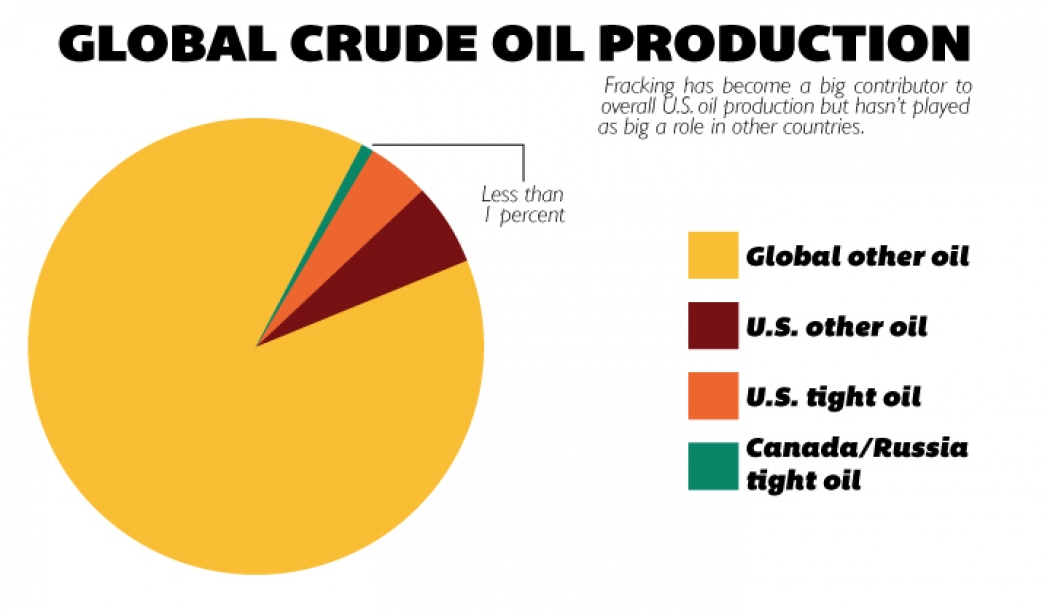
Another important fact concerning the USD is that almost all commodities are generally traded in this currency. Should you, therefore, wish to purchase oil, you would have to do it in the USD. In case you have some other currency at your disposal, such as the EUR, you would then exchange it into the USD to proceed with the purchase. This connection is really significant which is why this topic will be thoroughly discussed later in the text.

With regard to US institutions governing the matters vis-à-vis the USD, the US Treasury Department, which is part of the US government, bears the responsibility for the supply of the money, while the Federal Open Market Committee (FOMC), a partly government agency, handles the related policies. These are two main bodies that control the money in the United States and whose responsibilities will be further discussed in another section below.

The Gold Standard

The US government was the first one to leave the gold standard back in the 1930s, which basically refers to the idea that a country had to have a hard asset to back up the money it wanted to print. Prior to the onset of the new dollar era, the United States would print the gold, silver, and bronze dollars. Back in the days where this monetary system was followed, the value of the dollar derived from the commodity, not the government. This further means that the same quantity of gold had an equal price across different countries, so the money had equal value worldwide regardless of the printing design.

With the shift toward the use of paper money in the late 1600s, the US government still followed the same principle of hard assets providing the money’s value, which gave birth to the above-mentioned gold and silver notes. While these old notes are still available for online purchase nowadays, we cannot now go into any bank and exchange such a gold note of 100 dollars for the equal worth of gold as was possible before. The price of the USD was, hence, entirely attached to the price of the hard assets, and this is how worthless paper actually acquired the value of real gold and silver.

The previously mentioned FOMC was formed in 1933 when some of the United States’ best bankers gathered in private at which point the country decided upon letting go of the rule that prohibited countries from printing as much money as they wanted. Although this country was the first to move towards another monetary policy, which caused great turmoil around the world, all other countries moved along with applying the same changes. By the late 60s, the entire world had already adopted the same strategy.

The new system implied that countries no longer had to store all the gold and the silver, i.e. the hard assets, in order for them to be able to print money, called the money supply. The money supply is basically the total amount of one country’s money in circulation. This however does not only refer to the printed money as only 6% of the entire USD has been printed on bills. The remainder actually pertains to digital numbers, such as the money in an individual’s bank account. The phenomenon is similar to that of cryptocurrencies, and some companies may even allow you to exchange these numbers in a ledger for the USD. As money is generally digital, if the bank does have enough money at the time of the desired withdrawal, you will not be able to take out the money, or the bills, that you requested.

The US Agencies 

As discussed before, the US Treasury is tasked with deciding on how much money is going to be printed, controlling the money supply. The FOMC, on the other hand, is responsible for monetary policy, which further implies that they control interest rates, bailouts, and other important segments related to the country’s finances.

The United States comprises 12 sections governed by 12 different bank presidents charged with submitting individual reports concerning their districts. The reports are shared and discussed upon meeting with other committee members going through the information prior to making a vote. The voting is conducted so that it allows only five regional bank presidents to get a vote, rotating the votes in a manner that prevents the past year’s vote from coming up again. Out of the 12 members, the 7 remaining ones actually come from the FOMC. They alternate meetings between six and eight weeks apart, and the head of the committee that is the Chair of the Federal Reserve (the Fed) has the tie-breaking vote. 

FOMC Procedures

The current Chair of the Federal Reserve of the United States is Jerome Powell, who spent most of his time in the Banking Industry. Due to his banking background, he differs from the previous scholars and economists who used to perform this function in the past. The current Chair’s aforementioned experiences make him appear to truly understand more about banks than the previously chosen individuals, who are appointed every four-six years. 

Every other meeting involves the Chair holding a press conference, where he reads a prepared statement and conducts the Q&A session. In these meetings, the Chairs would typically share a lot of important information, which has historically been likely to usurp the market’s stability. The market would suddenly become quite volatile and traders would react to these events. The former Chair of the Federal Reserve of the United States, Alan Greenspan, was famous for the statement about the market he gave in the 90s that resulted in quite a turmoil. The market went down by 10% the same day only to go up and double after that, making the market even more unstable. These figures appear to exercise more control in their public statements nowadays, although these events have been said to still have an effect on traders and the market.

Key US Reports

The key documents providing the greatest insight into the state of the USD and related matters include the following five reports: GDP, employment, producer and consumer price index, retail sales, and trade deficit reports. 

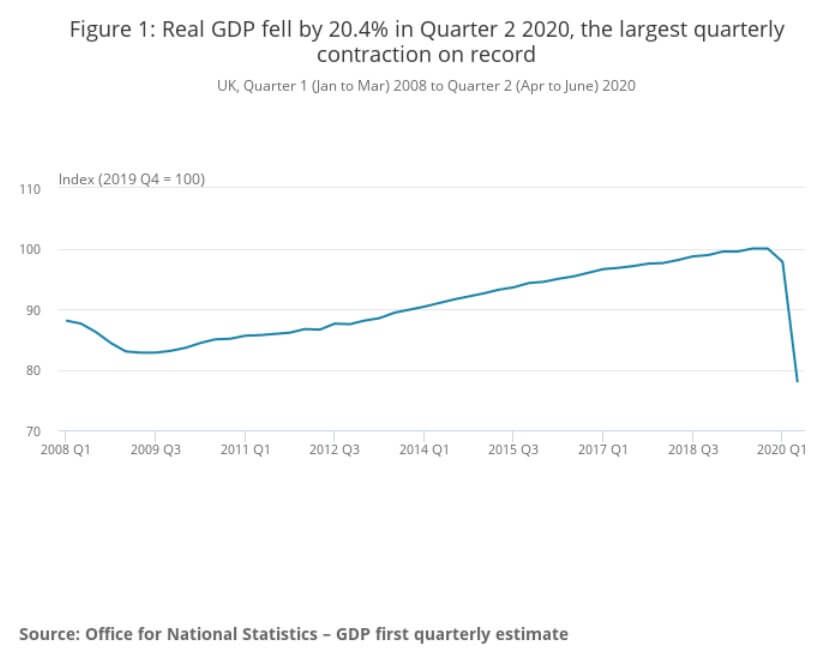
The GDP or the Gross Domestic Product report provides information on this important economic indicator that signals the condition of the overall economy of the United States. Providing insight into the country’s productivity, the quarterly report is said to have a particular impact on traders and their decision-making. The United States, in fact, issues three such GDP reports: the initial report that comes out approximately three weeks upon the end of the quarter (e.g. if the quarter ends toward the second part of the month, the initial report will probably come out around the 20th of the following month); the second report issued a month later that will contain some actual numbers based on the revision of the previous data; and, the final number that comes out three months upon the quarter ending. Among the three, the least attention will be directed towards the final reports, which appear to only hold relevance for the record books, whereas the first one will generate the most interest. As the initial report of the quarter, it gives important clues to traders, which is why, for example, every January 20, April 20, July 20, etc. will be important dates that should be part of the traders’ calendars. 

Non-farm Payroll measures employment or the number of people employed in the previous month and many traders rely on this information due to its relevance. The report typically comes out the first Friday each month and entails an extremely important indicator of consumer spending. Should the Friday fall on the first of the month, the issuance will be postponed to the following Friday of the month. When the results exceed expectations or predictions, they are considered to be positive (bullish) for the USD, while the opposite scenario is considered as negative (bearish) for the currency in question. Some currency traders claim that the Non-farm Payroll report is one of the best reports to trade.

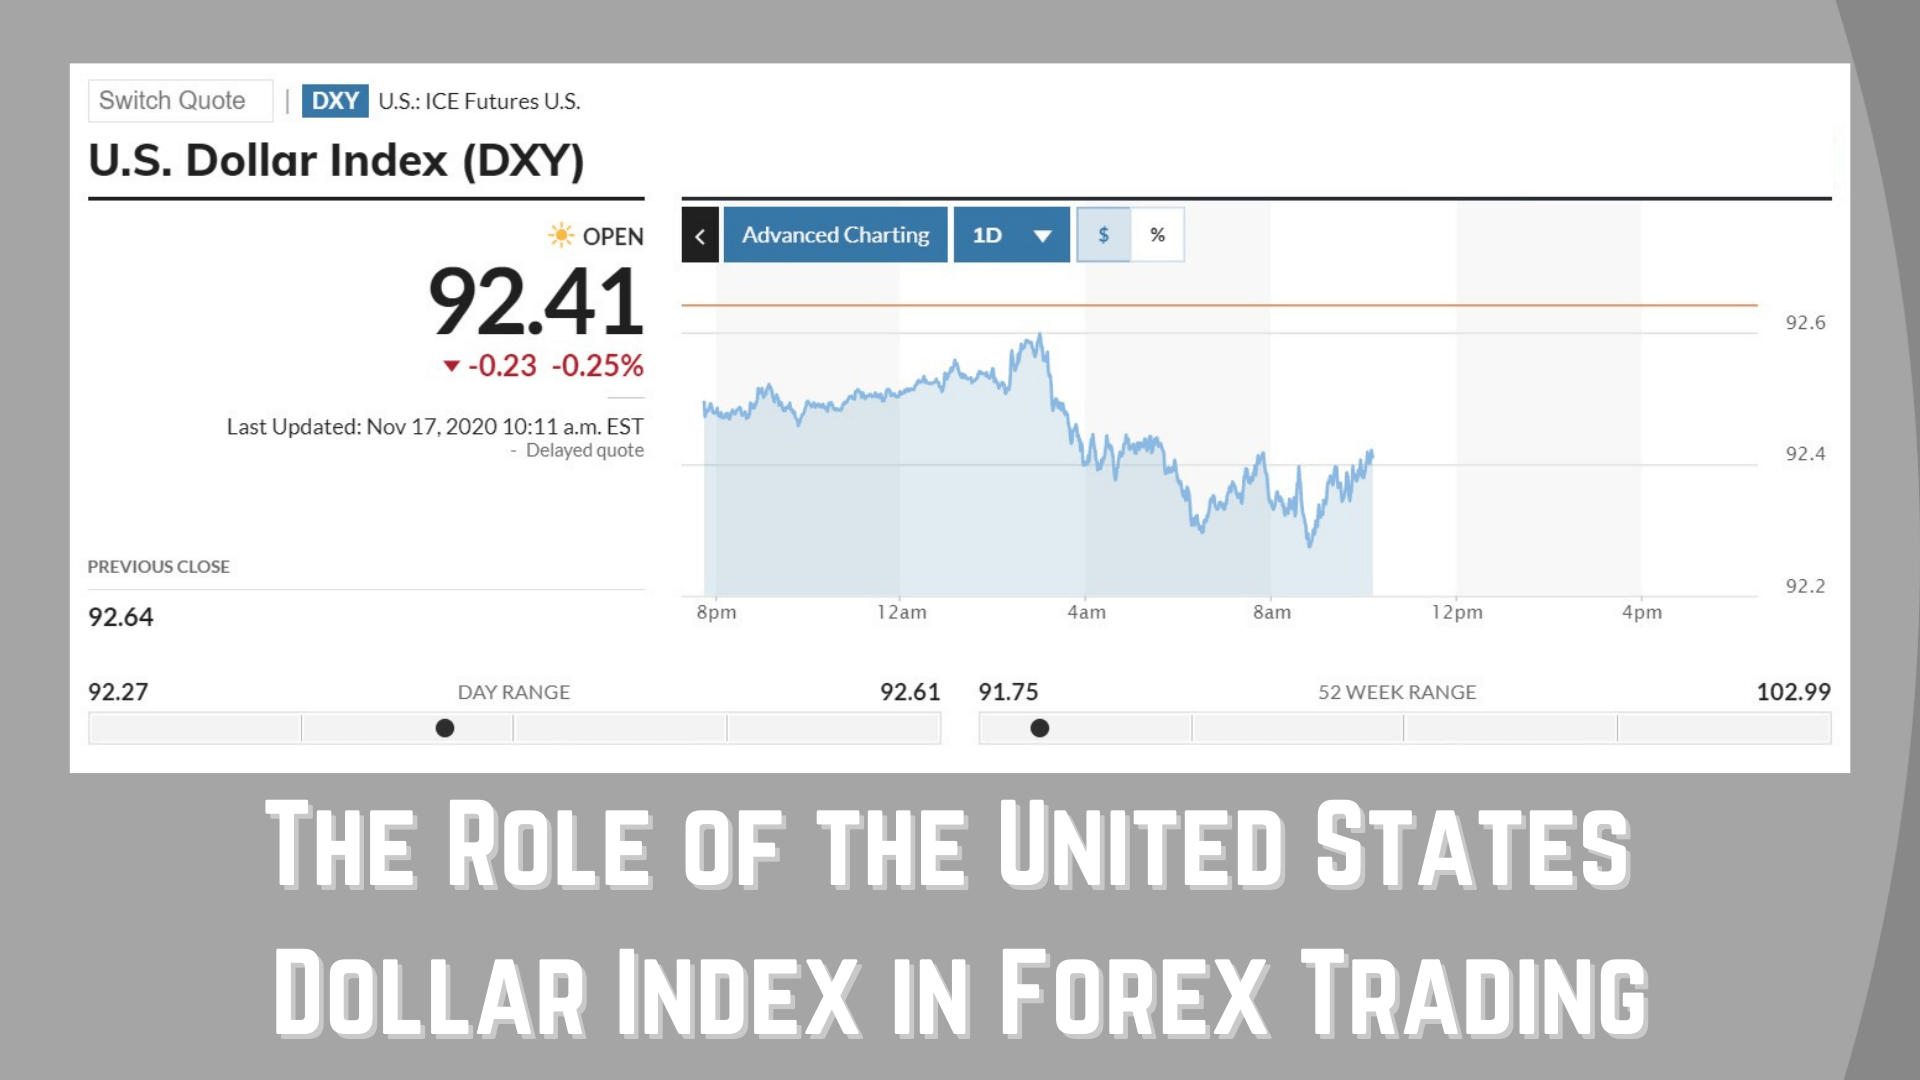
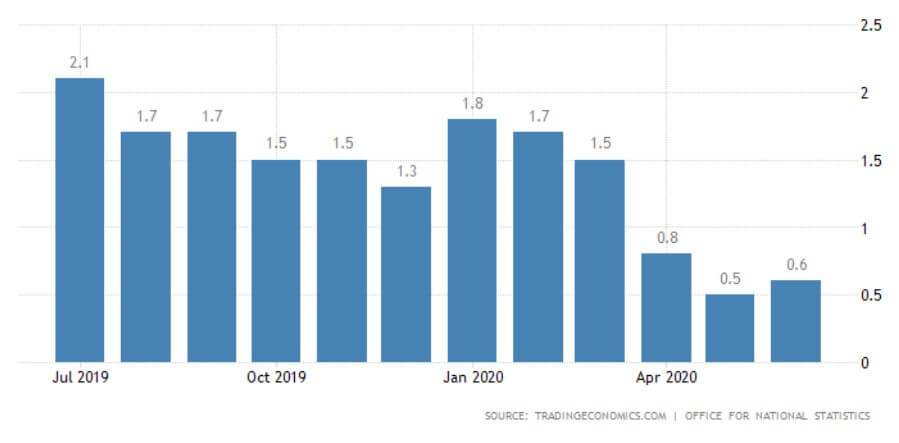
The monthly producer and consumer price index (PPI and CPI) are important indicators measuring the economy’s performance. PPI is an important piece of data that signals future expected inflation, any positive change in this index entails the rise of prices as well as the possibility to save money and earn interest. The PPI is said to have little effect on the USD per se, but its correlation with the CPI is found to be extremely important by some astute forex traders. The CPI, unlike the PPI, provides insight into current growth and inflation levels. What traders can generate from this information is an understanding of the impact of inflation on the USD. For example, the first half of 2018 recorded a rise in inflation which correlated with the increase in the US Dollar Index (DXY).

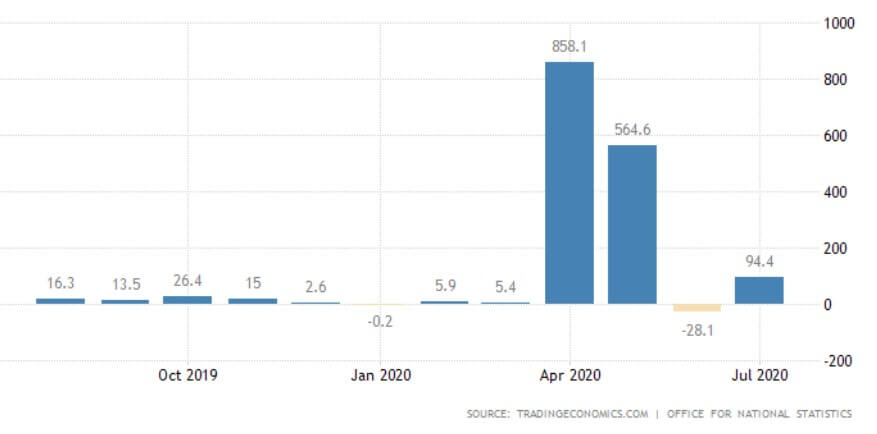
The retail sales report notes the changes in sales as an important indicator of consumer spending, which is said to account for approximately 70% of economic growth in general. Traders keen on trading the news find this information important, especially in the light of the recent pandemic. Similar to the Non-farm Payroll report, a positive retail sales reading generally proves to be bullish for the USD, whereas a low reading is seen as bearish.

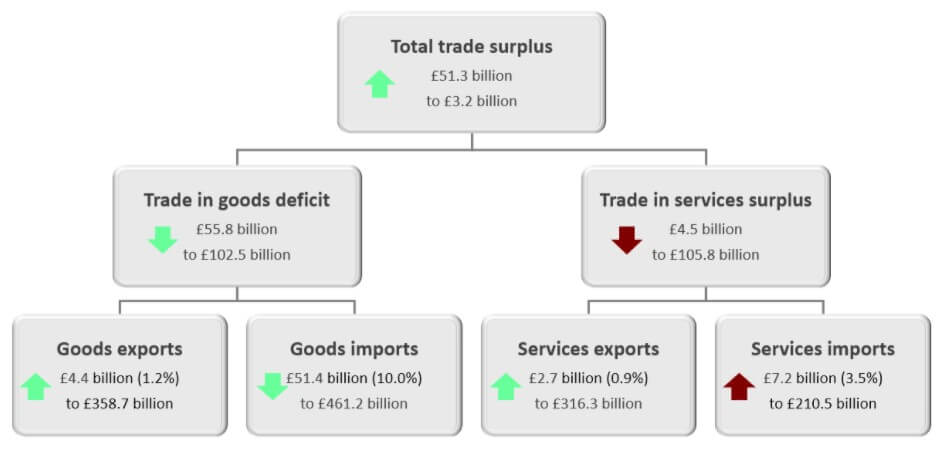
The trade deficit, the last report, is considered important due to the fact that during such deficits, the USD is generally noted to weaken. As currencies are susceptible to change because of a number of factors (e.g. economic growth, interest rates, inflation, and government policies), trade deficit should be perceived as one of the determinants. Generally, the trade deficit is considered to have a negative impact on the USD although the currency’s appreciation could stem from other reasons.

Major Currency Pairs

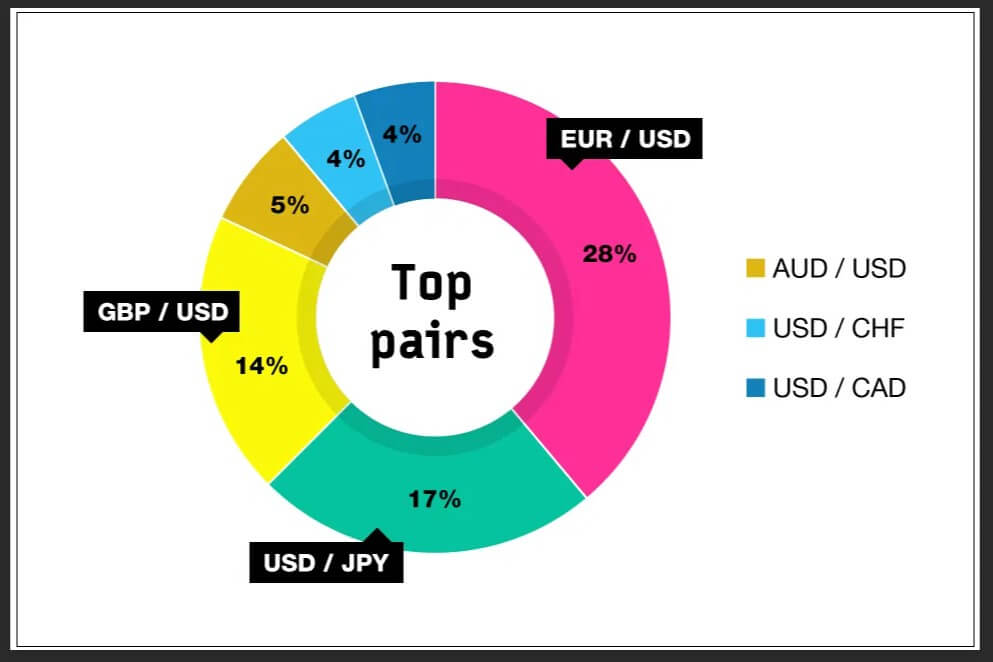
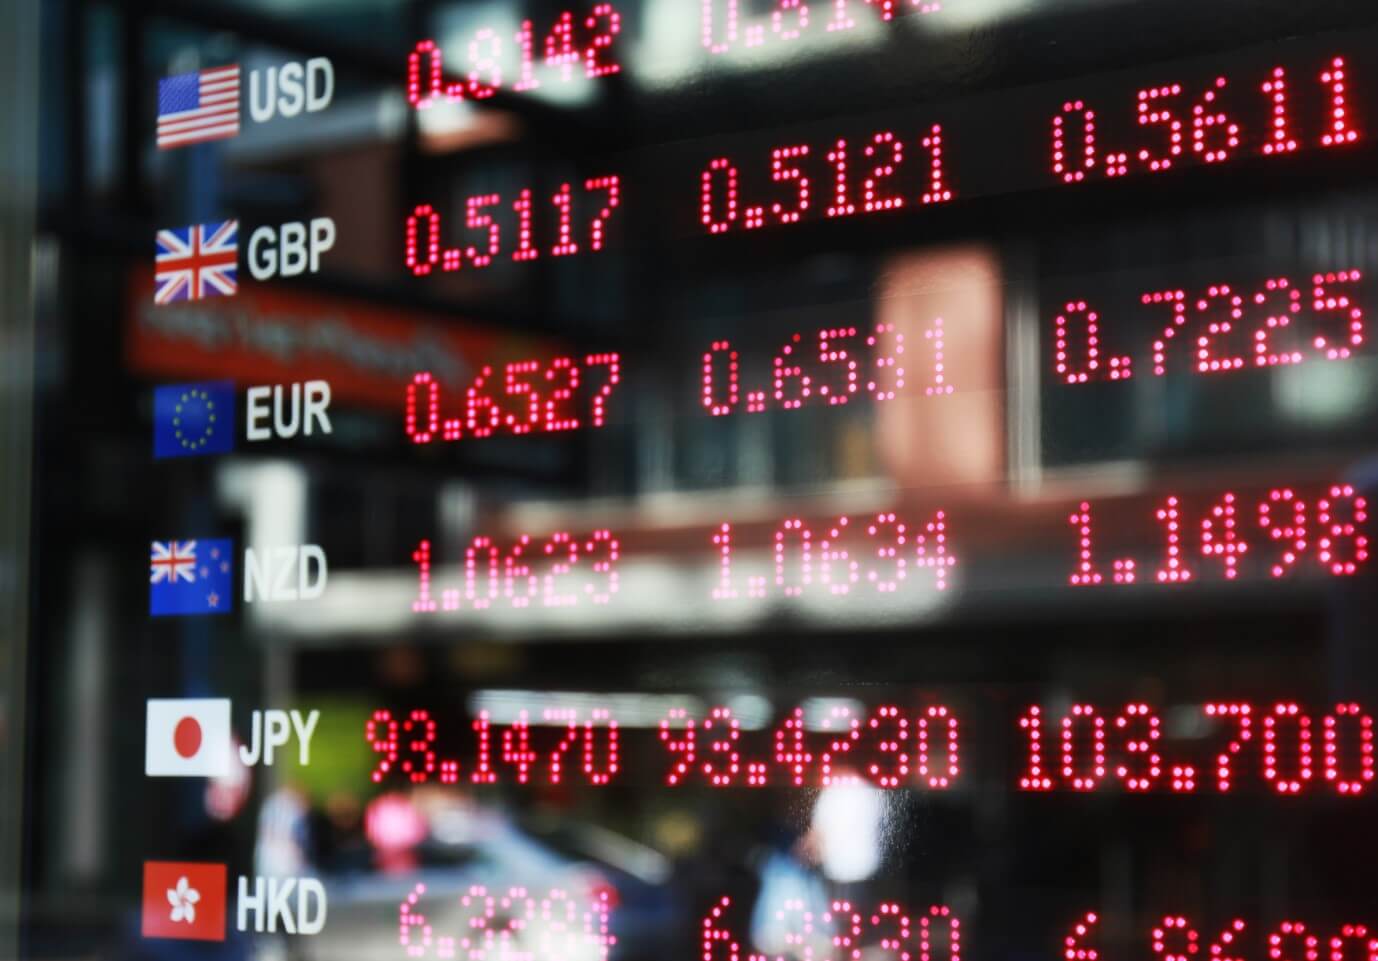
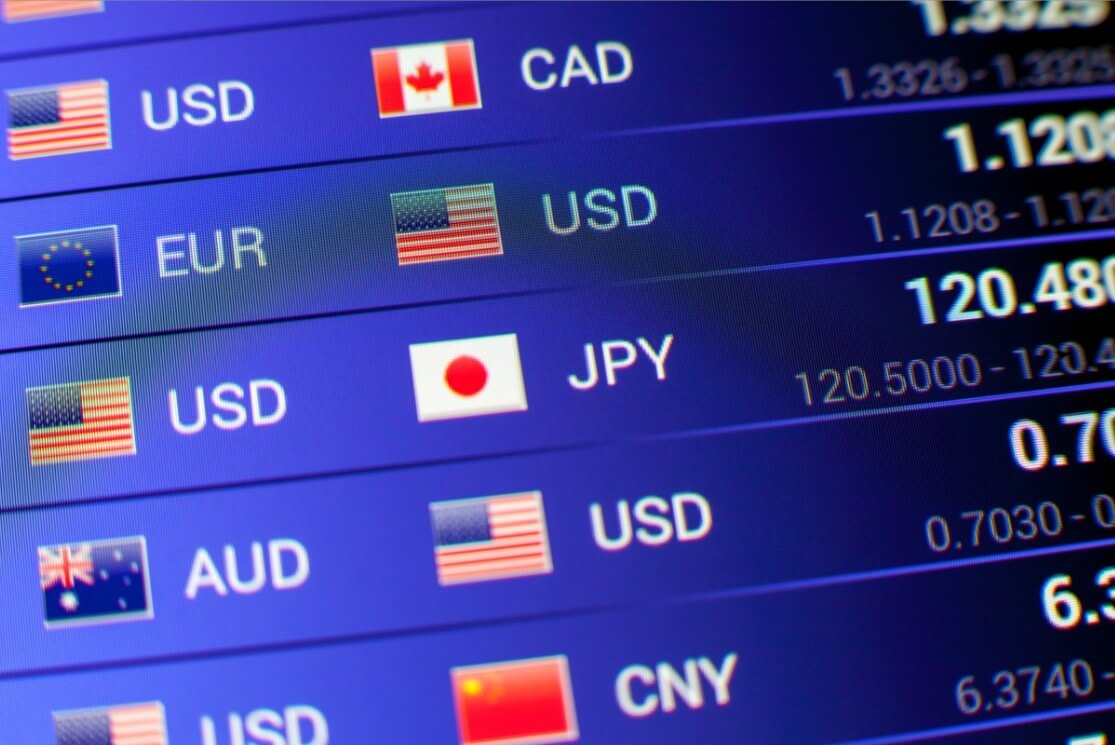
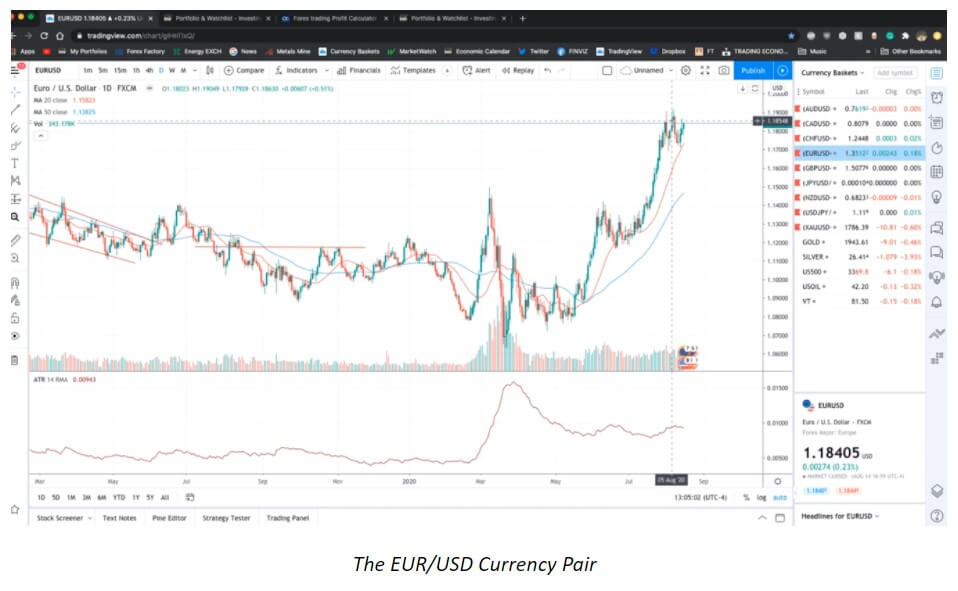
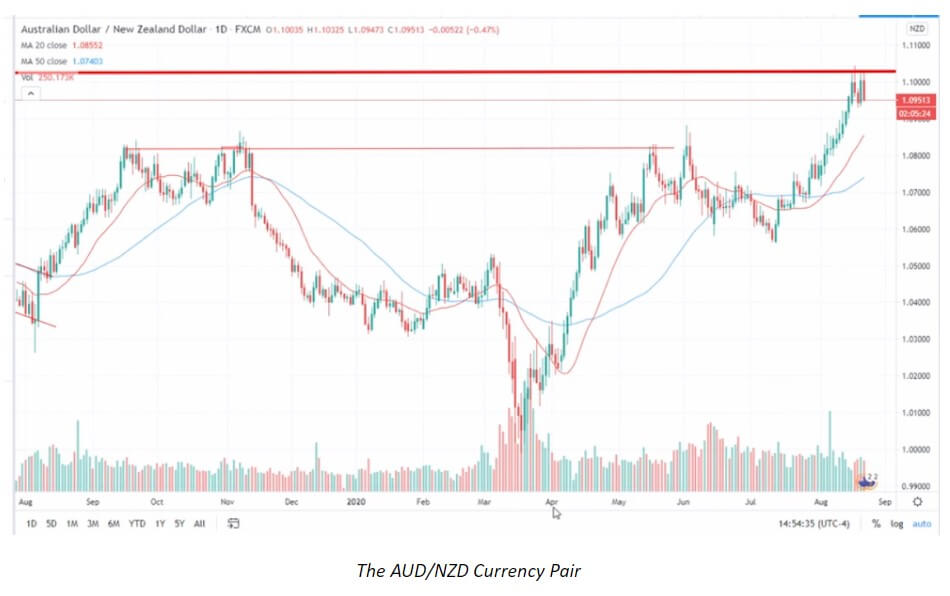
The following seven currency pairs are said to have the greatest volume: EUR/USD, USD/JPY, GBP/USD, USD/CHF, USD/CAD, AUD/USD, and NZD/USD. The EUR/USD pair is said to hold 37% of all trading volume in the world. While this number can oscillate up and down, this currency pair is in fact the most liquid pair among the seven major ones and is generally considered one of the safer pairs to trade. Traders who are invested in trading big news events are the ones that should be particularly drawn towards the most liquid currency pairs since these entail tighter spreads and less slippage. What is more, traders interested in trading the Non-farm Payrolls report are advised to give this currency pair a try because, while it cannot grant 100% success, it does alleviate some of the challenges concerning trading currencies. 

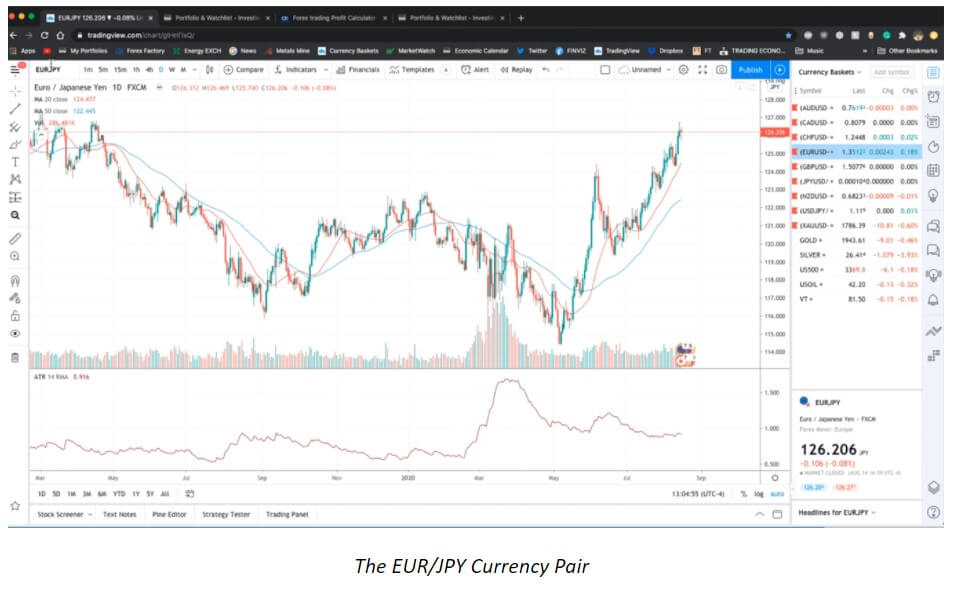
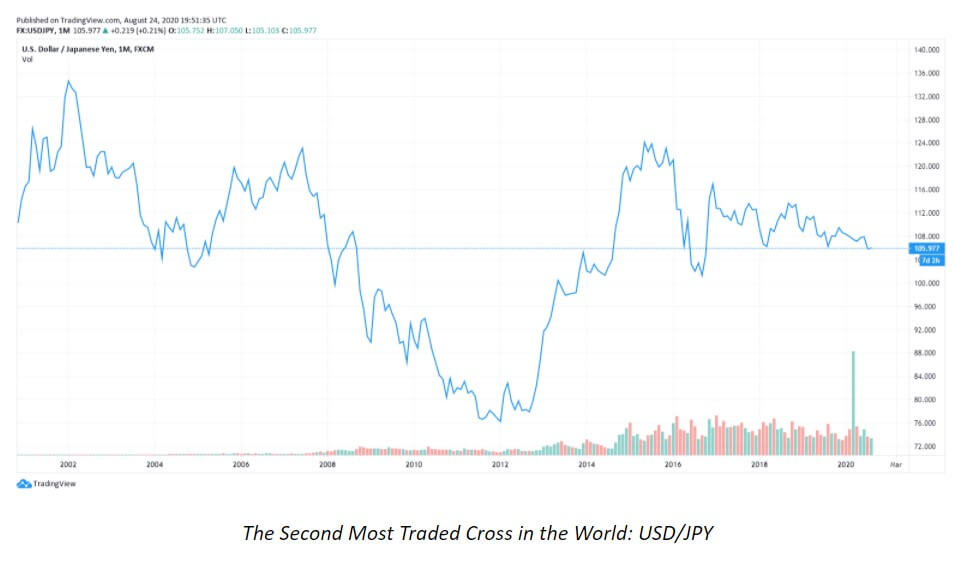
With a total of 10% of the entire trading volume, USD/JPY accompanies the previously discussed currency pair to hold almost half of the world’s trading, making these two a focus of many traders’ attention. As the USD is the most popular currency in the world, every trade involving this currency should entail great trading volume even with pairs such as NZD/USD.

USD/Gold Correlation

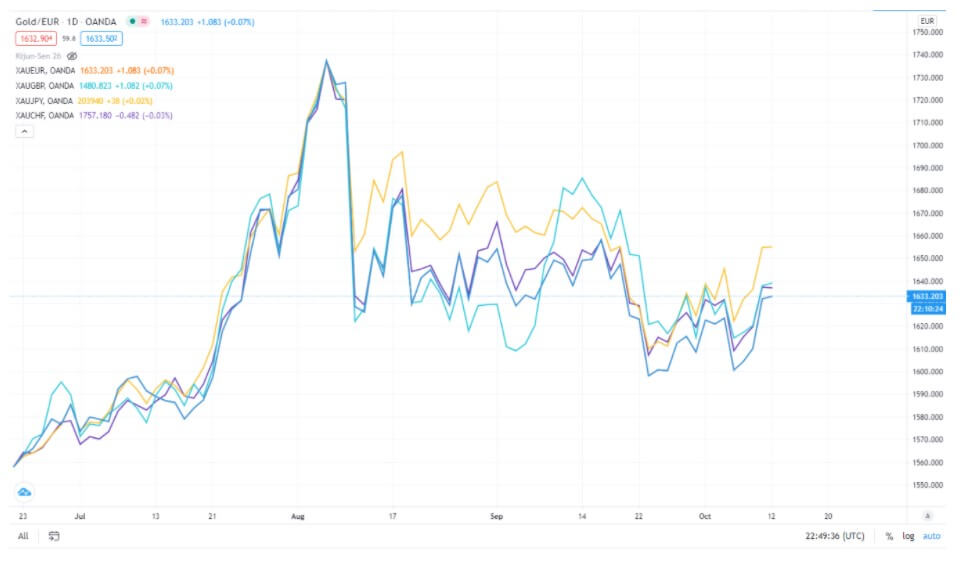
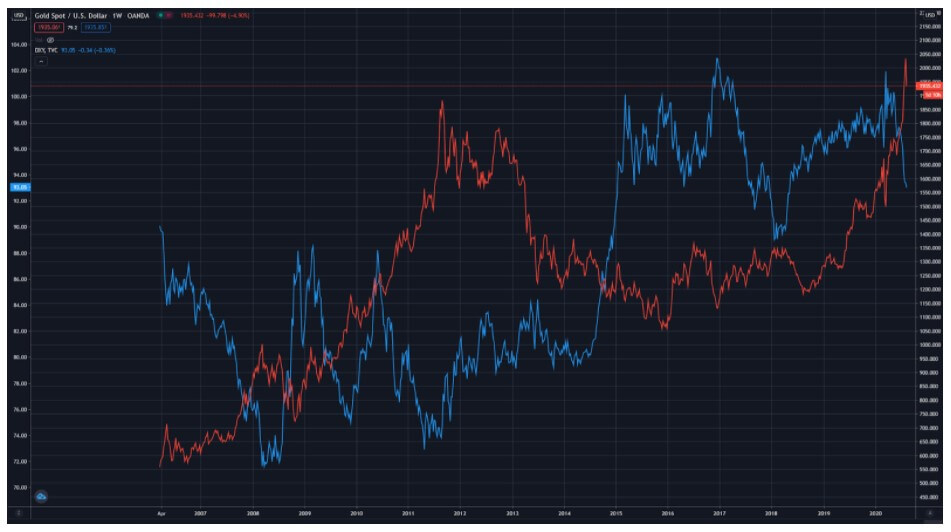
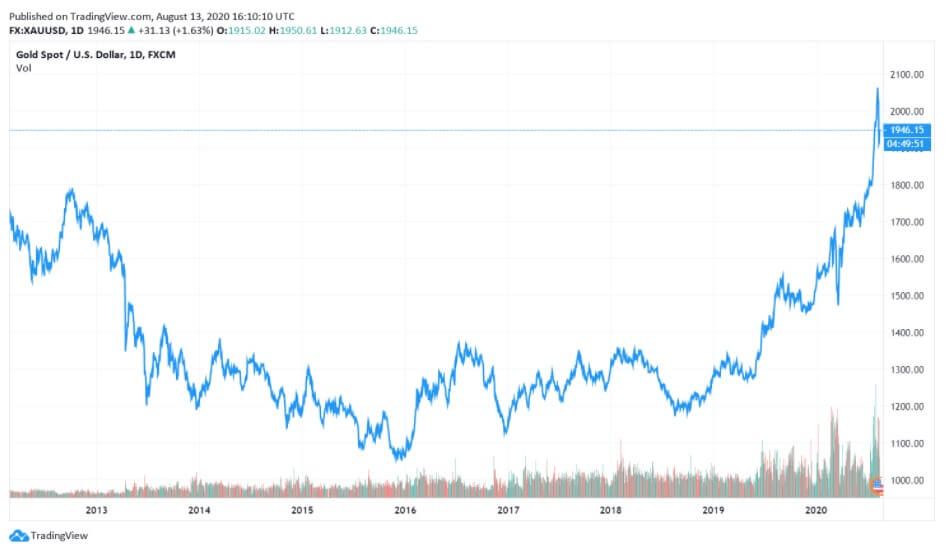
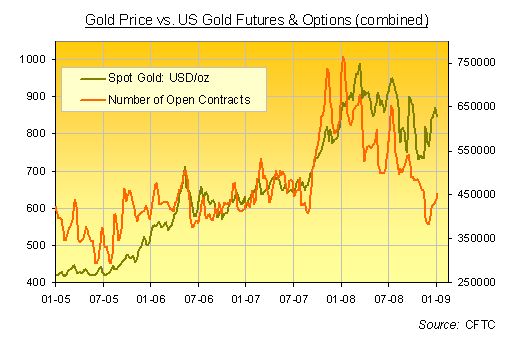
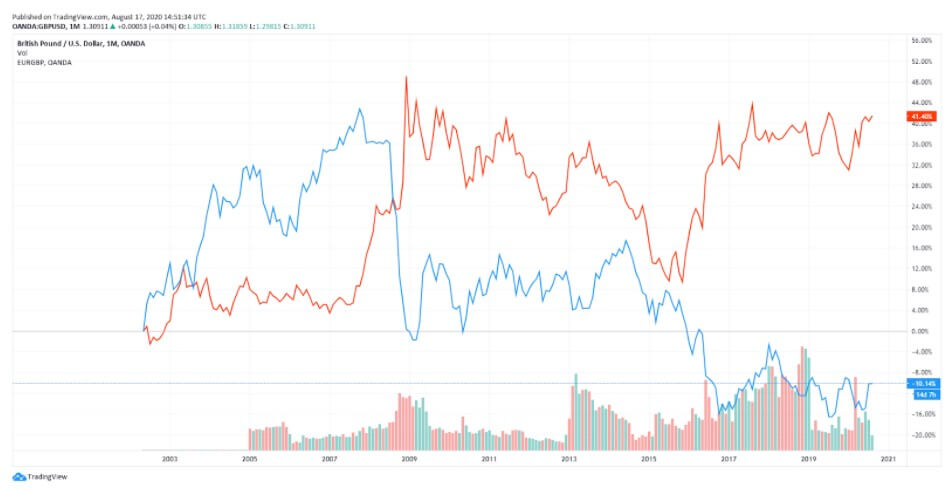
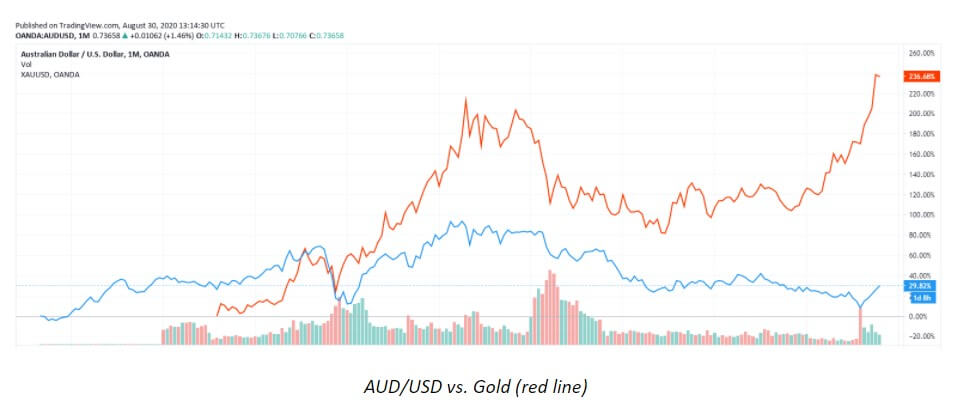
The negative correlation between the USD and gold is considered as one of the most important topics regarding this currency. These correlations can at times increase or decrease in strength, but from the perspective of history, the USD has an 80% negative correlation with the price of gold. This further implies that once the price of the USD appreciates, the gold’s price should plummet, and vice versa, which can be seen from the chart below (spot gold is red while DXY is blue). Although at one point both prices started moving in the same direction, these occurrences are very short-lived because the standard negative USD-gold correlation is of a long-term nature and eventually everything goes back to its place. The strongest correlation, and the most prominent one, is the one that the USD has with the price of gold. It is an indicator that as soon as the price of one goes up, the price of the other will start moving in the opposite direction. Naturally, traders can find exceptions and this cannot be perceived as a guarantee, but this correlation has been present for many years.

Trading USD

As one of the most liquid currencies worldwide, the USD allows for traders peace of mind when trading the related currency pairs. The only exception to this rule is when trading big news events or if traders are expecting some important move in the market. The USD is generally perceived as the safest currency to trend with the tightest spreads and the least amount of slippage, although some traders avoid it due to the big banks’ attention, involvement, and impact on this currency and, hence, traders.

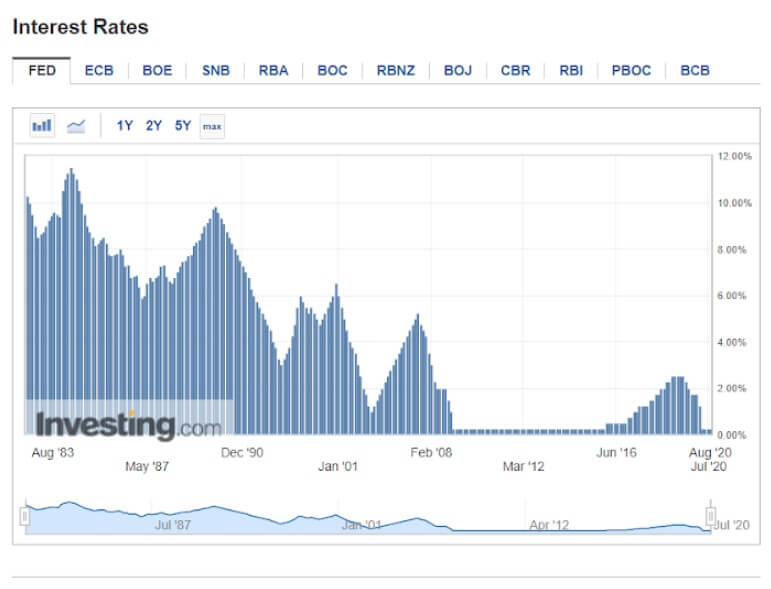
Upon the economic crisis of 2008, the FOMC was the first central bank to raise interest rates, and years passed until others started to do the same. The USD is certainly not the currency with the highest interest rates in the world at the moment, but we have witnessed how they kept soaring at a dramatic pace at a few points in the past. The reason why this happens lies in the central bankers’ desire to keep inflation under control. Therefore, whenever the economy is improving, the interest rates are increasing.

The currency market implies the flight to safety on one hand and the flight to risk on the other, which is why we have money flowing either in or out of the country. Therefore we can conclude that the reason behind the FOMC’s aggressive rise in interest rates is the strength of the US economy. As it is the largest economy in the world, it does impact the rest of the world. Hence, when the US economy is doing well, so are the other countries.

Whenever money is on the lookout for investment, it will direct itself towards risk, which entails locations such as China, Vietnam, and South America, heading towards the places where the greatest return on money can be found. The FOMC kept increasing the interest rates, but this did not always entail a strong US dollar since the rest of the world was in fact doing better at the time. Inflation was kept under control since 2008 and the world seemed stable until the onset of the COVID-19 pandemic.

An important fact regarding the USD concerns trade deficits owing to the fact that the United States imports increasingly more than it exports, in particular with countries such as China and Japan. These trade deficits are a long-term negative for the currency because the individuals living in the United States and buying foreign goods keep seeding the money out of the country, and it is these other countries where this money is reinvested. The opposite scenario, where the United States could do more exports and the money would come into the country, as a result, would create a trade surplus. The country’s age-old tendency has been one of the popular topics highlighted by US politicians as a long-term negative on the currency.

Economic activities always affect the USD price, so if the United States is undergoing a challenging period unlike other countries, the US economy can be expected to keep struggling. On the contrary, should the rest of the world be experiencing economic struggles, the US economy would probably be doing well. Nevertheless, in order to trade the USD successfully, traders are always advised to do extensive research and monitor the external factors surrounding the currency market. 

Impact of COVID-19

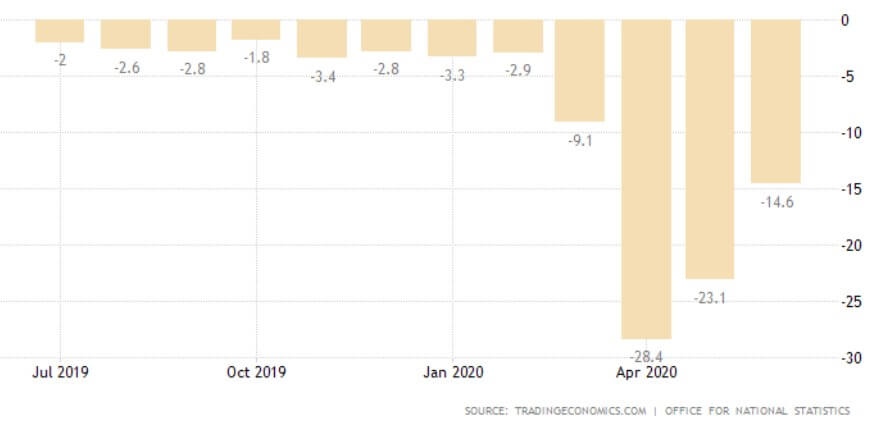
The pandemic has taken the entire world by surprise, also shaking the United States economy, leaving 22 million Americans unemployed. The worldwide economic shock has revealed a silver lining for the USD as it has led to a number of investors selling riskier assets (e.g. stocks and bonds) and taking cash as a form of safety. The currencies which were highly exposed to global trade suffered depreciation as they typically sell-off in the face of economic deterioration, but the US dollar again emerged as the currency of choice in times of crisis. As investors always flee to safe-haven currencies in such unpredictable times and as the COVID-19 pandemic is driving the global economy into recession, the demand for the USD rose to the extent that the US Federal Reserve has to set up new swap lines in order to be able to lend money to the central banks of other currencies. The USD is currently seen as the strongest currency probably due to the country’s stable and safe economy. However, such strong demand can even exacerbate the current situation which pushed the Federal Reserve to protect the currency from shortages. 

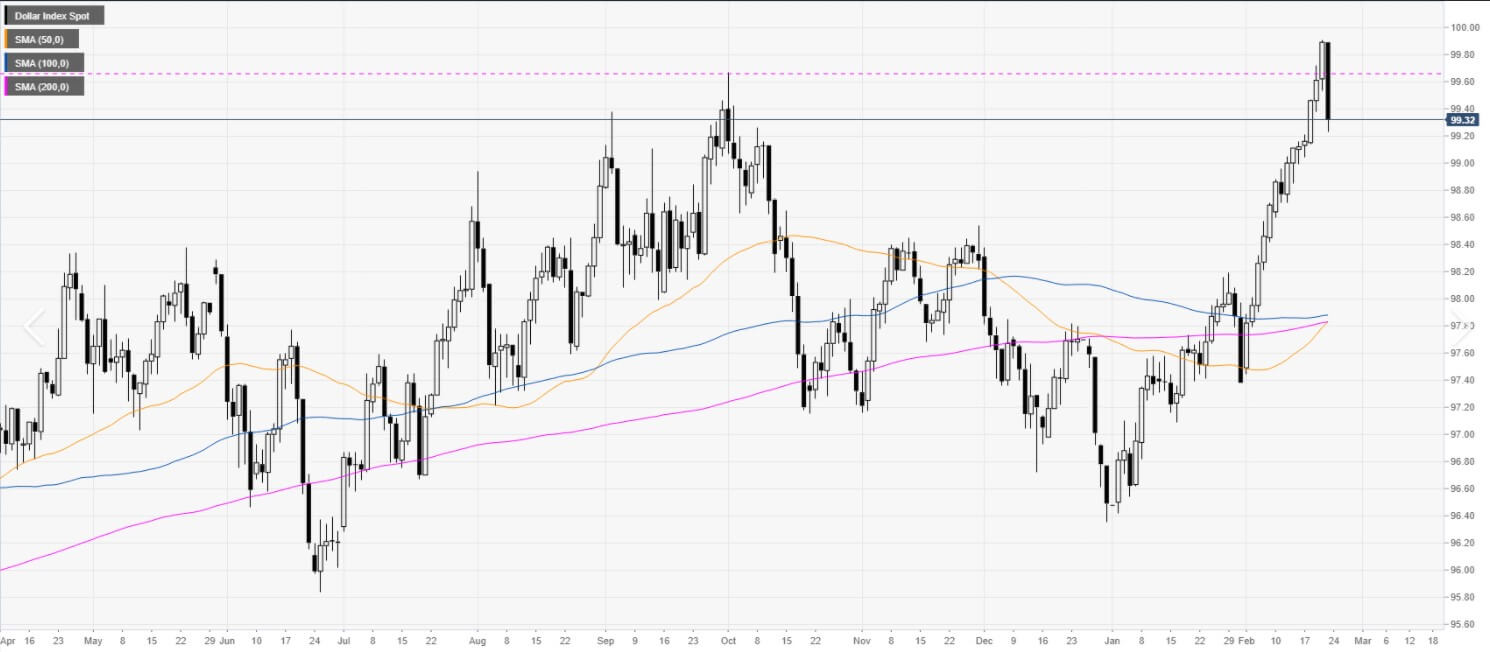
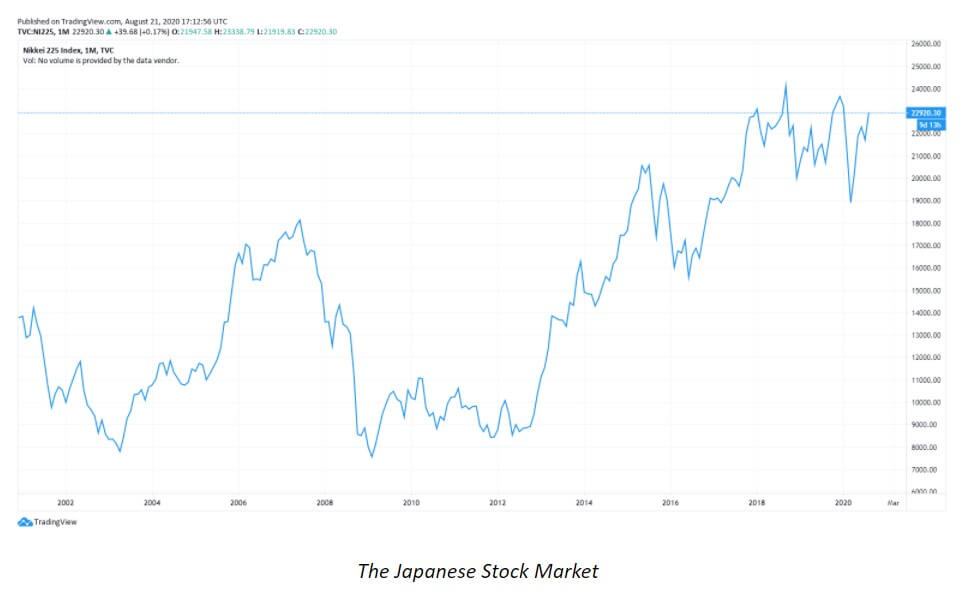
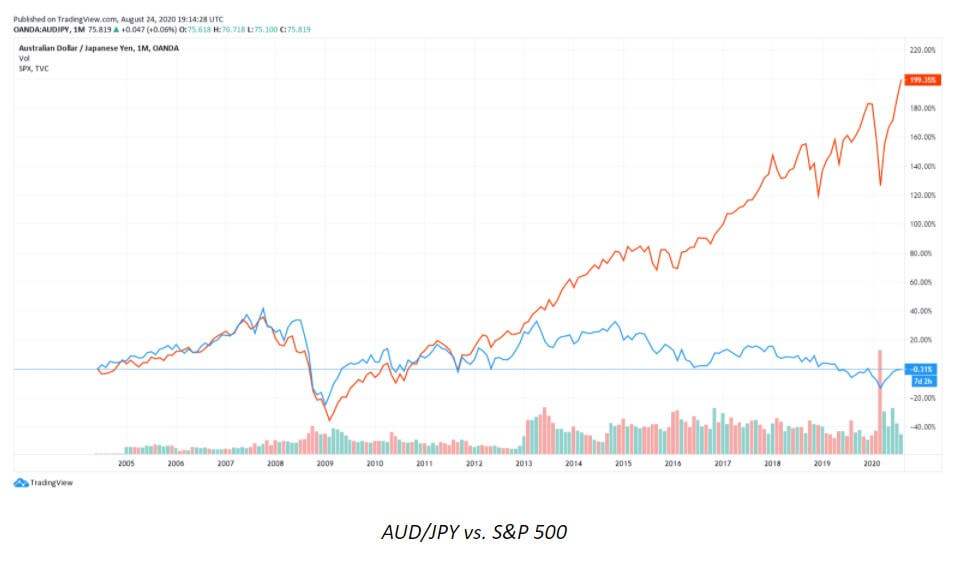
Although the USD did not appreciate more than in 2007, the currency’s index value did approach near record highs. So far, the USD has slightly leveled, still maintaining an edge similar to many major currencies (e.g. EUR or JPY). Nonetheless, the current preference of the USD and its strength seem to be calling for an increase in international collaboration. Now, as the Federal Reserve is yet again pumping the currency into the world market, the trend may have serious implications for other economies. For example, after the 2008 crisis, the cost of export created by a soaring JPY left Japan worse off than some countries directly affected by the financial tumult, starting with the United States itself.

Business owners across the world understand that should the pandemic continue, they will require significant capital reserves to withstand the blows of the economic contraction. The spread of the virus certainly motivated some large currency moves as well and, although similar tendencies have been recorded in the past, the pandemic does make this situation one of a kind. The quick-paced forex dynamics and capital outflows from emerging markets appear to be much more prominent.

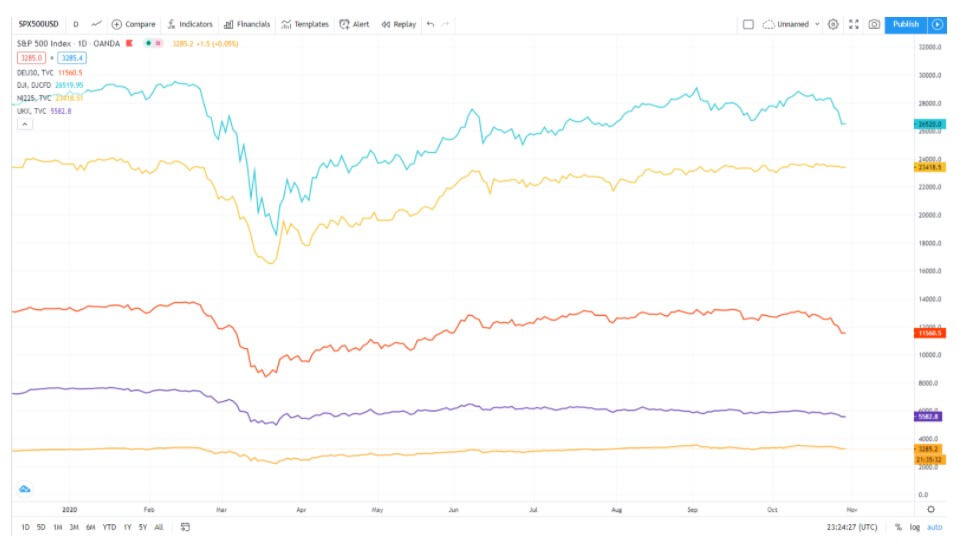
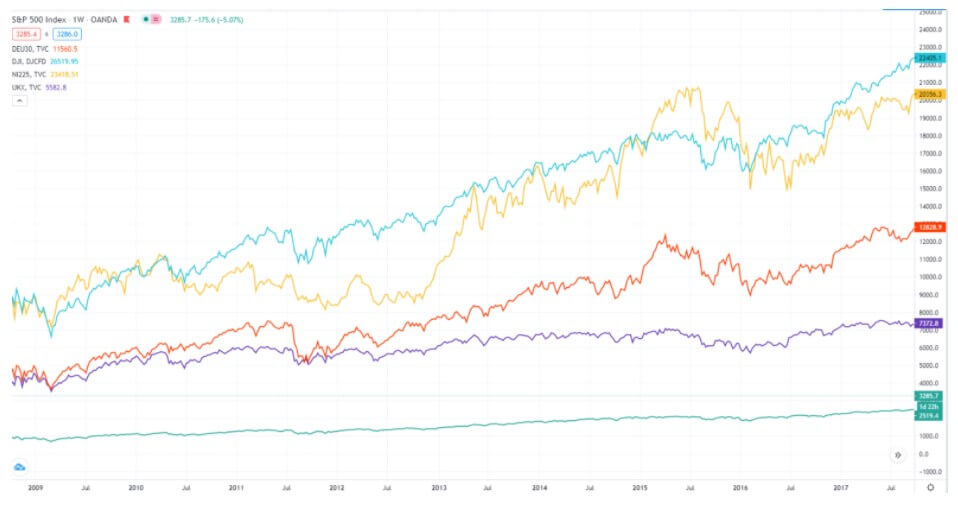
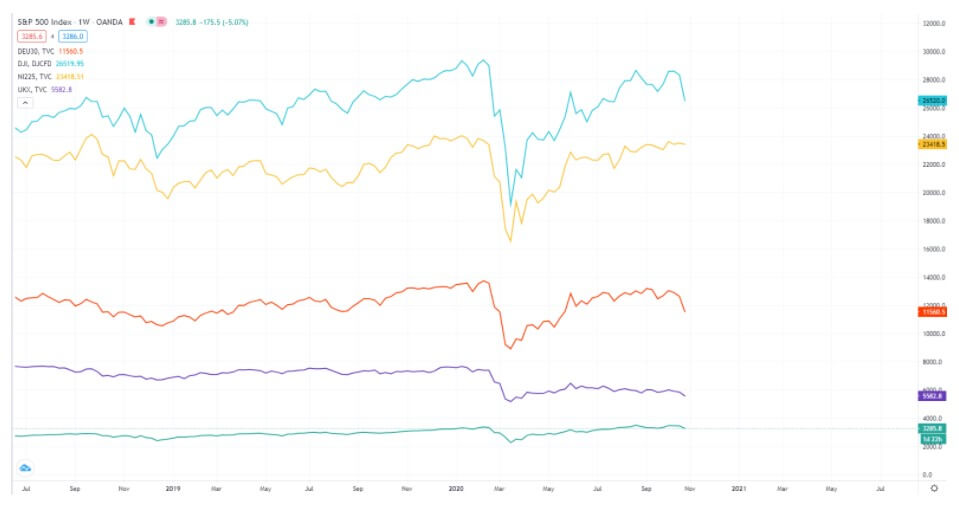
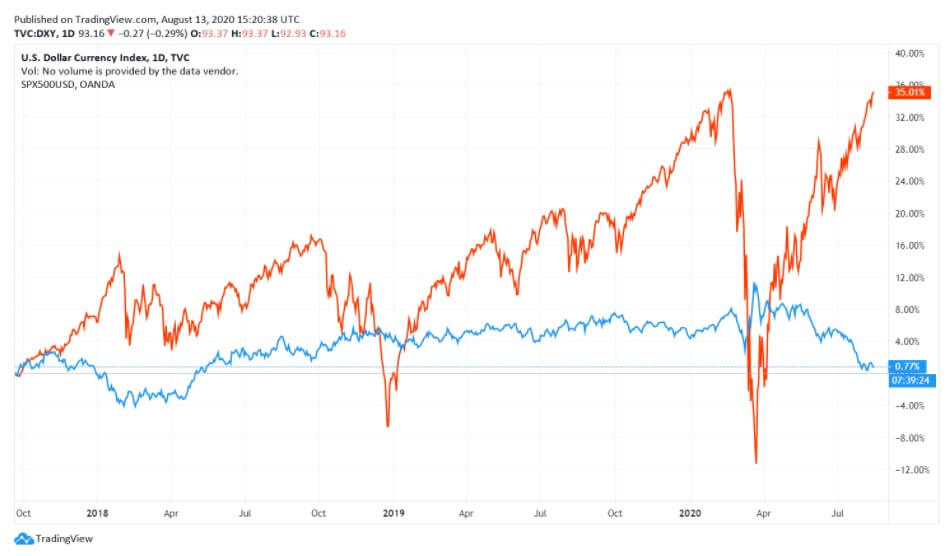
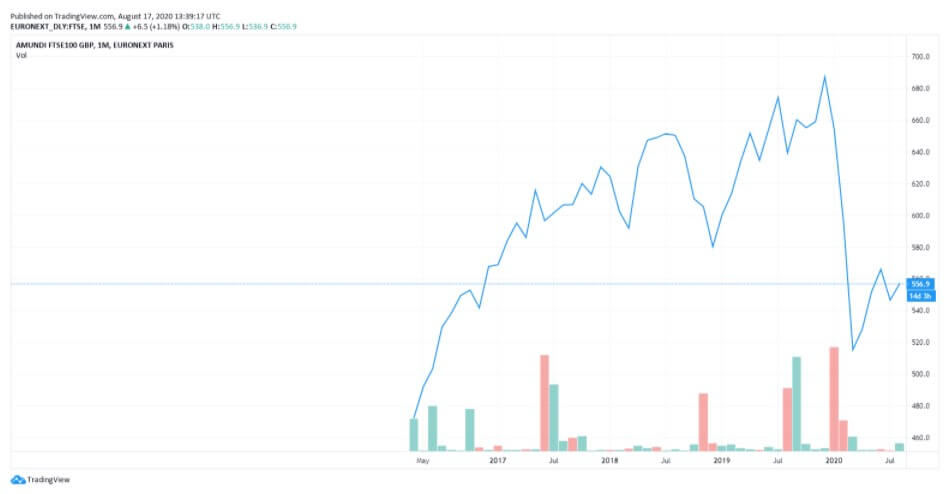
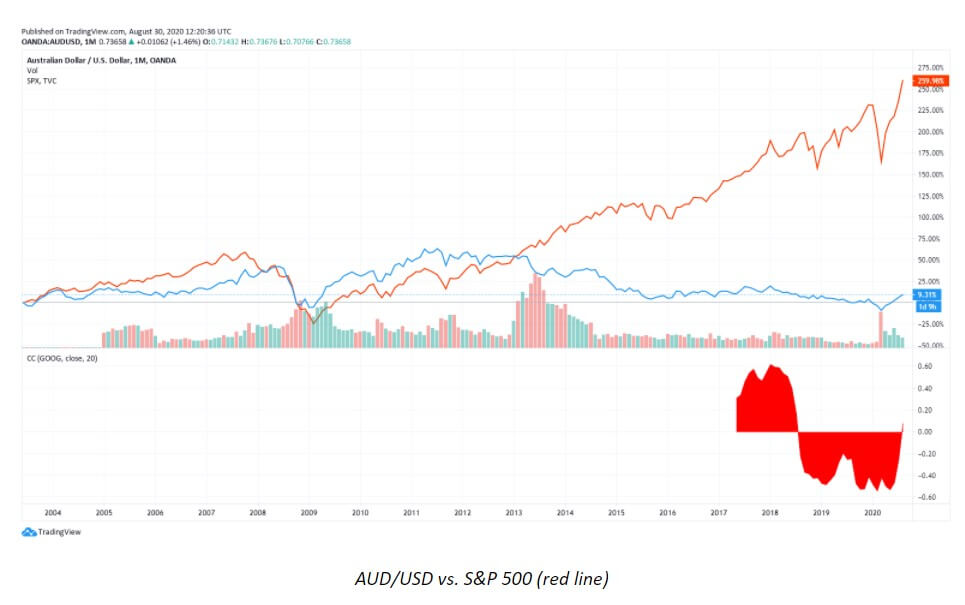
The state of equities at the moment is certainly interesting as we can see from the chart below. The same contrasting behavior between DXY and SPX500 was noticeable before as well as during the financial crash of 2007. March was another time in history when a significant drop in equities was quite prominent only to go up recently.

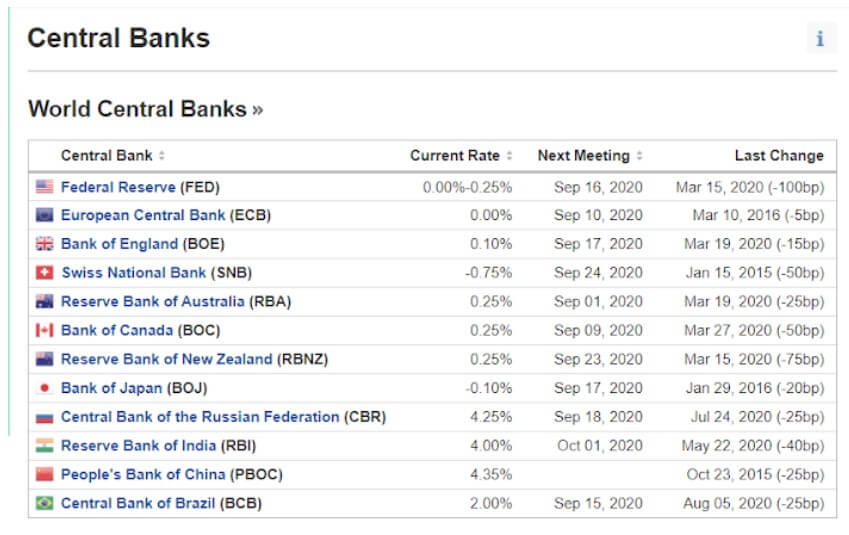
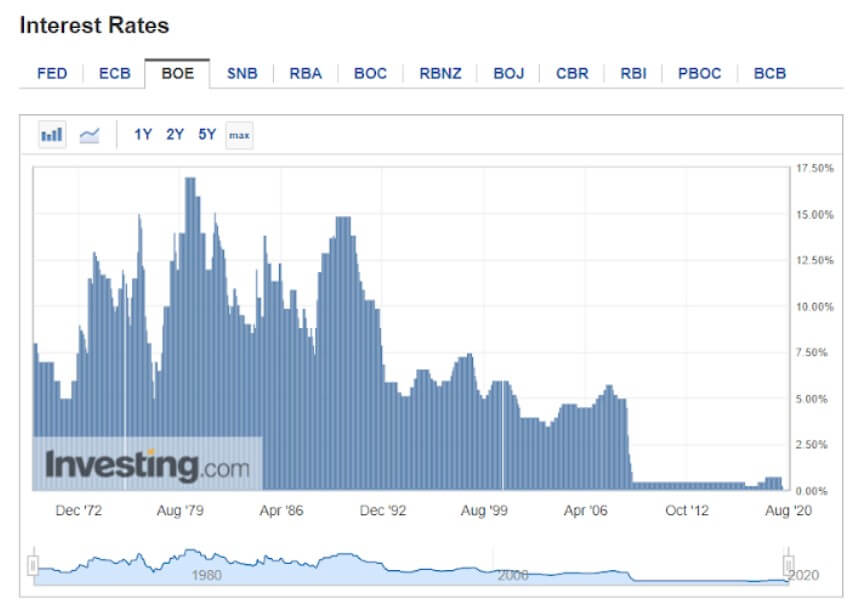
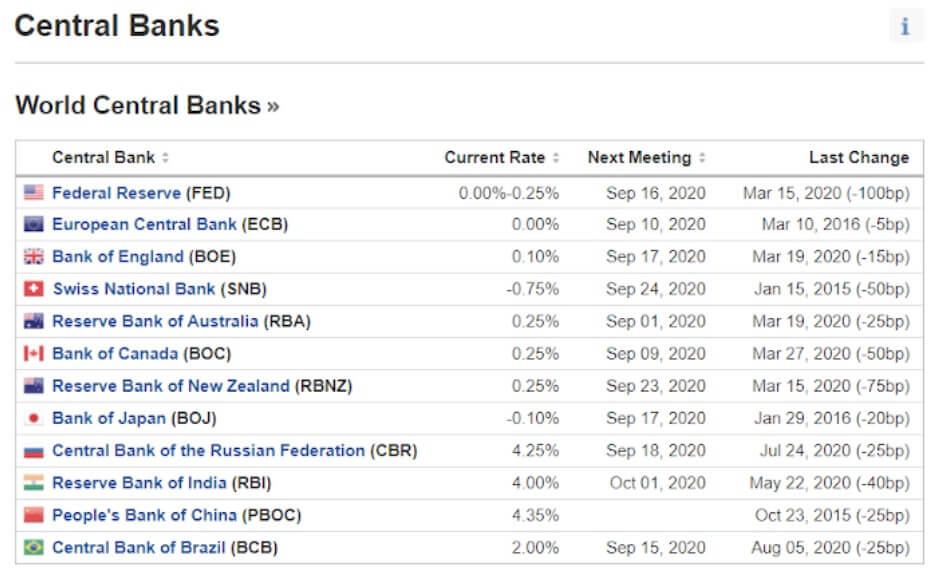
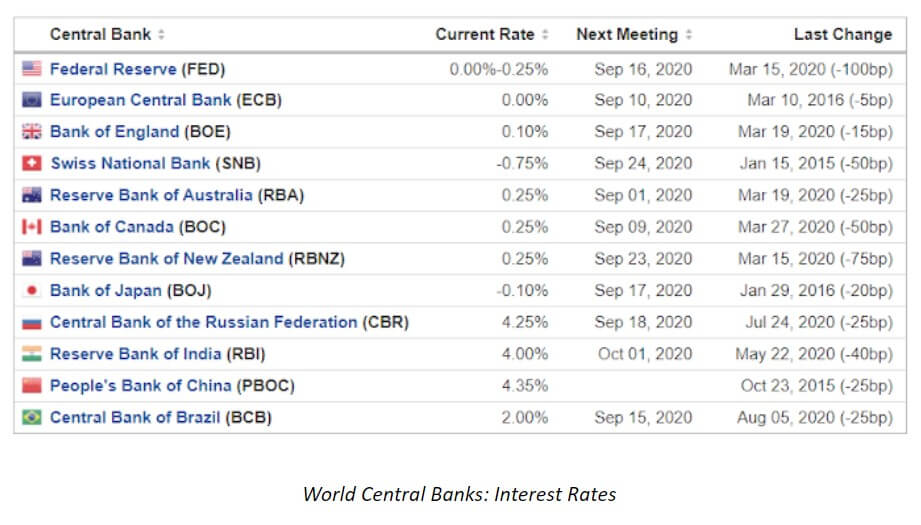
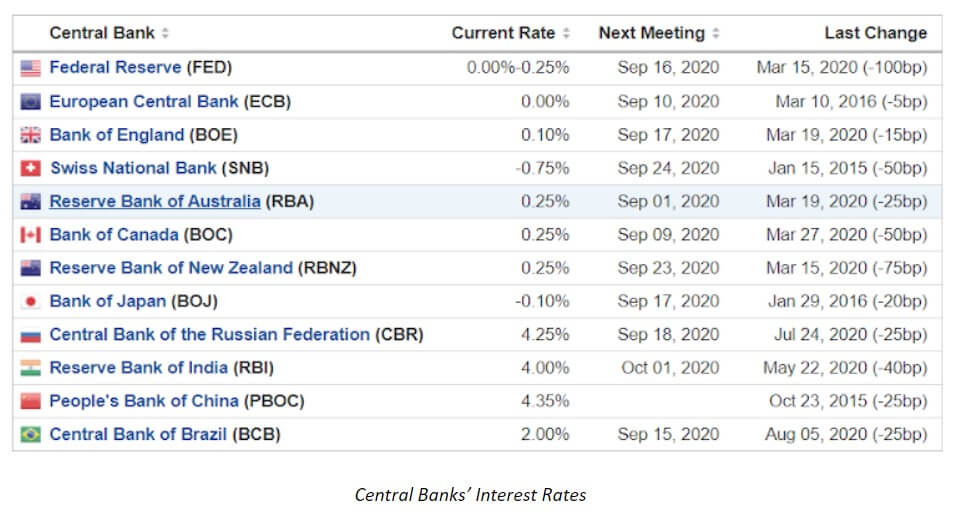
Interest rates in the United States of America have leveled after the brief increase in the past year and as of March equal 0.25%, unlike the values proposed by some other central banks of the world. The current interest rate is practically the same as it was in the post-crisis period of 2008, where it maintained the same 0.25% until the beginning of 2015. Interest rates across the world mimic the same decline as that of the FOMC. However, some other central banks, e.g. the Central Bank of the Russian Federation (CBR) and People’s Bank of China (PBOC) keep their interest rates above 4%.

China’s and Russia’s attitude towards the USD has kept economy-related media and various markets’ participants quite entertained in the past few years, especially in relation to gold and surrounding events. The so-called de-dollarization appears to be backed up by previous political altercations between China and Russia on one hand and the United States on the other. These long-term geopolitical rivals were found in the middle of a currency war where the two countries appear to be fighting against the global hegemony of the USD. 

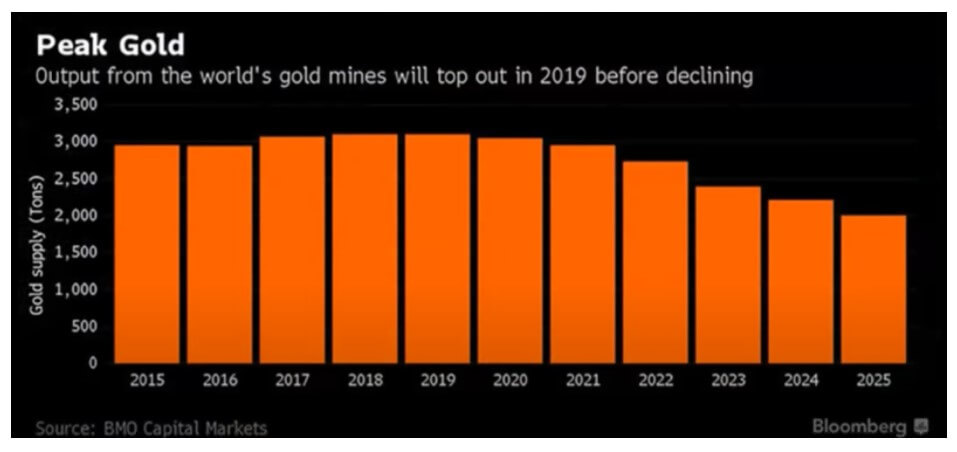
Despite countries leaving the gold rule, this pre-pandemic gold spree appeared strange in this digital era. However, the central bank of Russia suspended buying of gold on the domestic market which has been explained by the attempt to strengthen the local currency aligning with lower oil prices and the spread of COVID-19. Quite interestingly, Russia is claimed to have exported more gold than gas in the second quarter of the current year for the first time in approximately the past 30 years. Analysts explain the entire situation as a mechanism that stops Russia’s purchases of foreign currency and gold when the prices of oil fall below $42 a barrel. With gold prices reaching all-time highs beginning of August 2020, many major Chinese banks have already taken measures to stop customers from purchasing gold and other precious metal-related products through them.

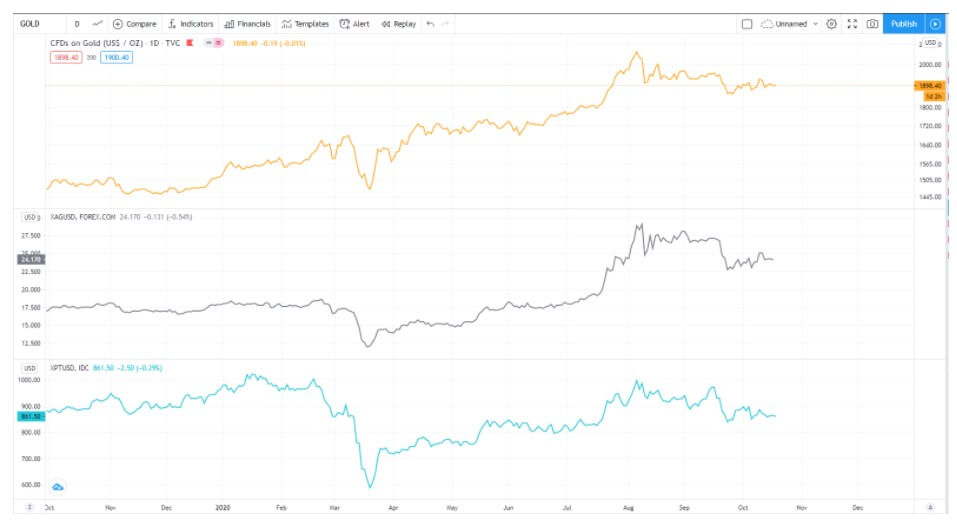
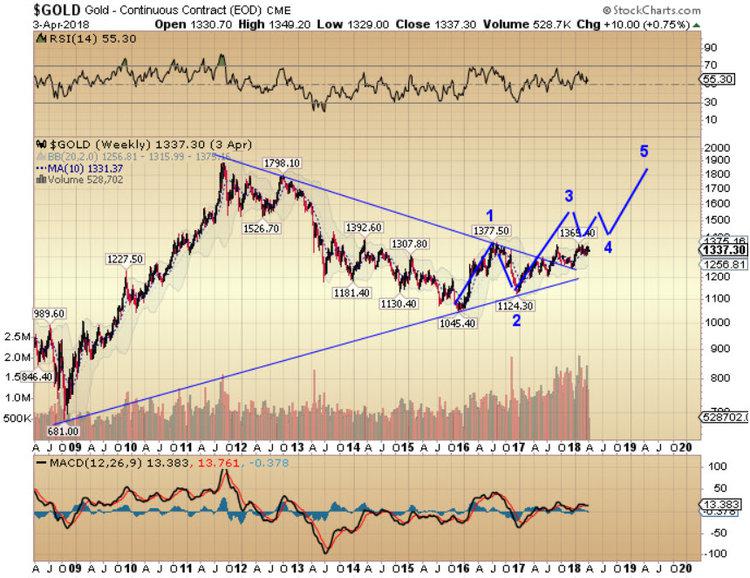
Gold prices have gone up and down in the past, so the increase from the beginning of 2020 can be attributed to the onset of the COVID-19 pandemic as well as part of its natural longer upward trend. The current price exceeds that of the financial crisis of 2007 by far and the precious metals appear to be moving even higher, supporting the expectations of the US inflation increase. 

The FOMC maintains a positive outlook on the future, assessing the May employment rise in a number of sectors, employees’ return to work, and the reopening of many businesses. Some analysts even look back at the times of the previous financial crisis where many feared inflation, highlighting the importance of preserving a more enthusiastic perspective of the future of the USD and the US market.

The USD has once again been proved to be the reserve currency of most countries across the world with more than $1.8 trillion of Federal Reserve notes in circulation. This de facto global currency appears to be positioned well for future trades despite the severity of the global viral threat. The United States’ official currency is currently largely outside the country’s borders, yet it may be difficult to foresee any other currency taking over the USD prominence in the near future.
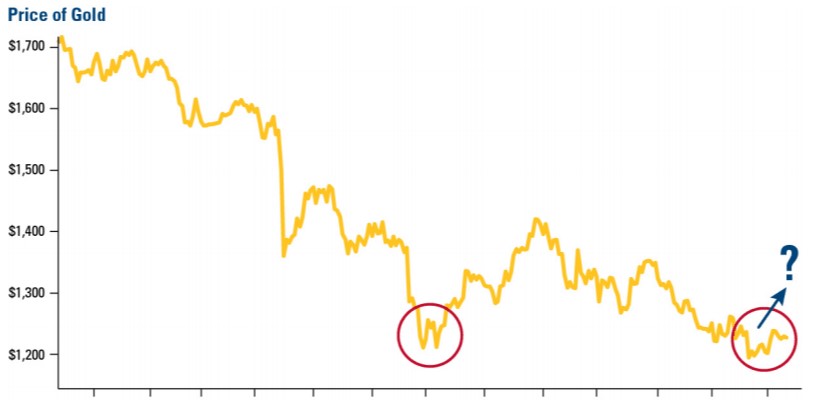
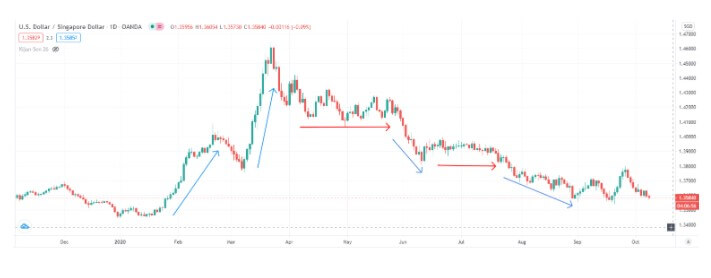
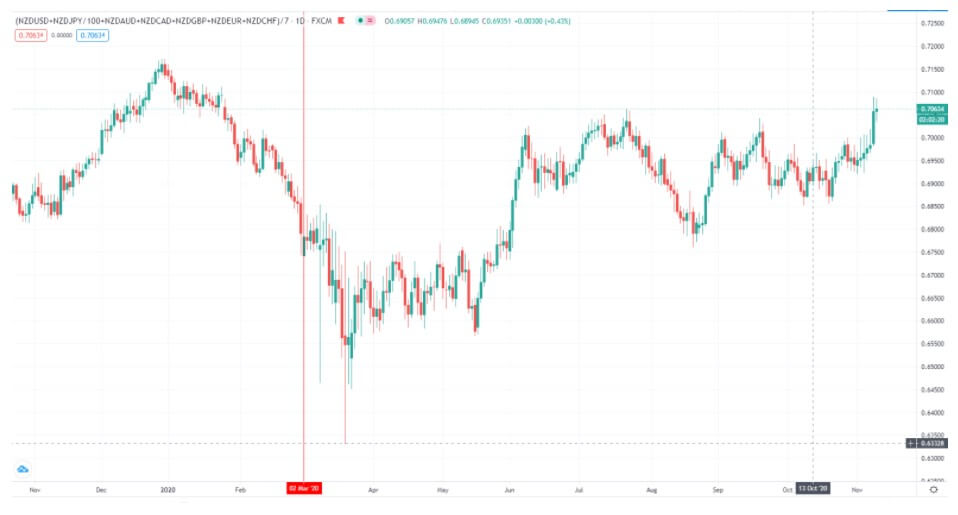
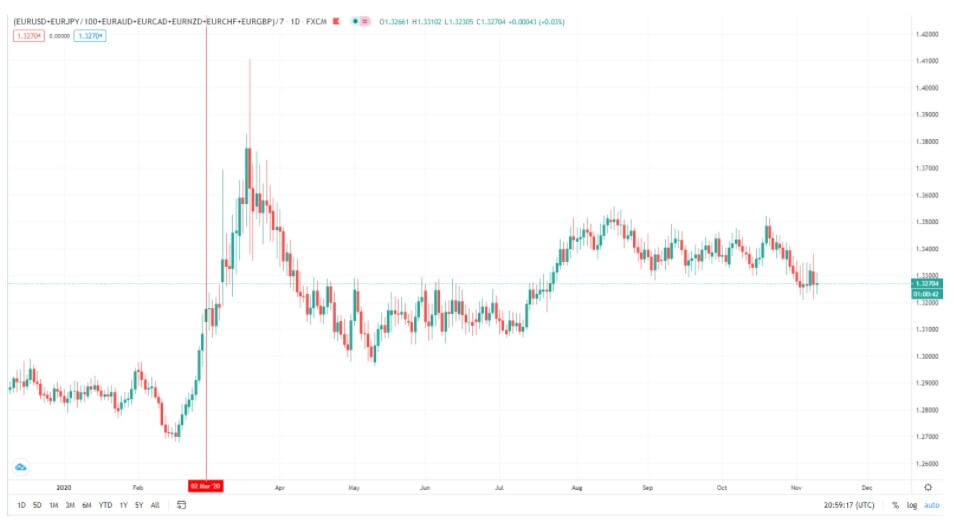
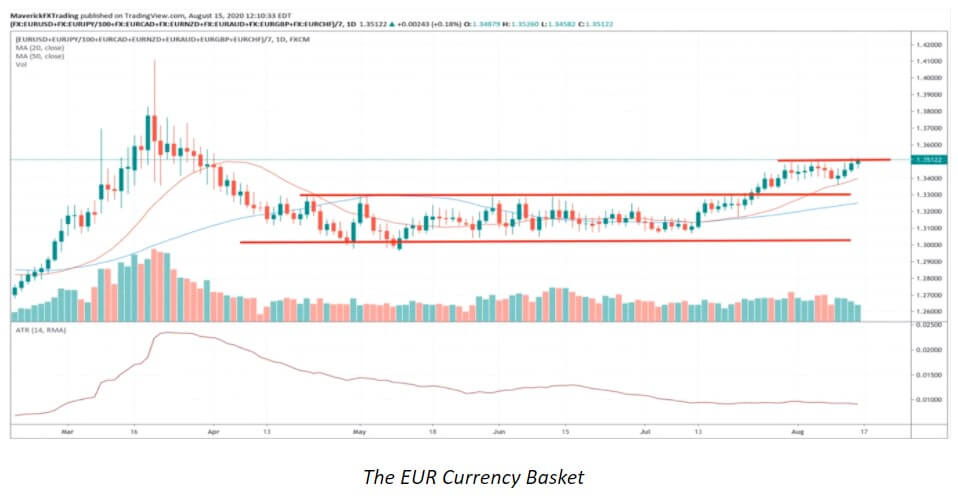
Categories
Beginners Forex Education Forex Assets

The Fundamentals of the Euro (EUR)

The euro (symbol: €/code: EUR) is said to be used by approximately 341 million individuals each day, thus making it the second most-used currency in the world. The currency’s name was formally adopted in 1995 in Madrid upon then President of the European Commission, Jacques Santer, receiving a letter by Belgian Esperantist Germain Pirlot offering the suggestion. Like other currencies, the EUR used to be a commodity currency before becoming a fiat currency in the 1900s.

The idea of creating the EUR commenced in 1992 when certain documents were signed to initiate the process. Years passed and in 1998 a number of countries officially decided to gather around the same currency and adopt the EUR. Before this happened, each European country used a different currency: Germany – German Mark, France – French Franc, Italy – Italian Lira, Span – Peso, etc. These old currency notes were after 1998 exchanged over the new currency we now know under the name euro. This change allowed for easier migrations, travels, and commerce within the continent where an hour or two can get you from one country to several others.

Having a central currency helped the member states overcome and bypass many of the barriers that had previously existed. The EUR unites 19 of the 27 European Union member states in a monetary union called the eurozone or euro area. Many countries in the European territory have decided against using the currency, such as the majority of the Scandinavian countries and the United Kingdom, among others. The following Euro area member countries use the EUR: Austria, Belgium, Cyprus, Estonia, Finland, France, Germany, Greece, Ireland, Italy, Latvia, Lithuania, Luxembourg, Malta, the Netherlands, Portugal, Slovakia, Slovenia, and Spain.

Some countries are part of the EU but have yet to meet certain conditions to be able to adopt the EUR: Bulgaria, Croatia, the Czech Republic, Hungary, Poland, Romania, and Sweden. The following European microstates also use this currency: the British Overseas Territory of Akrotiri and Dhekelia, Montenegro, and Kosovo. The EUR is used outside Europe as well, in special territories of EU members, further complemented by other currencies pegged to the EUR. Countries can join the euro area through fulfilling convergence criteria that are binding economic and legal conditions stipulated by the 1992 Maastricht Treaty. The European Commission and the European Central Bank together decide on a country’s candidacy preparedness to adopt the EUR.

After the publishing of the reports stating their joint conclusion, the ECOFIN Council can rectify this decision upon consulting with the European Parliament and Heads of State, formally allowing the adoption process to start. A country’s readiness for euro adoption, the preparedness for the eurozone accession, or the member status may still not grant the full benefits of being a part of such monetary union due to the existence of certain individual financial irresponsibility which causes other countries to suffer. History has shown us how the more responsible member states had to step in in order to help the other struggling countries, and the period between 2008 and 2010 truly pointed to some concern whether the EUR could endure any longer. Greece, Spain, Ireland, and Italy, for example, were debated upon with regards to the question of keeping the membership status or discontinuing the use of the EUR.

Cyprus is another example of a country that would have collapsed a long time ago were it not for the European Central Bank’s approval of emergency funding. The future still has several questions to find answers to – can so many countries with different cultures, ethics, history, economies, and overall individual differences maintain this union, and can the currency survive the continual struggles it undergoes? While the future alone holds these answers, the idea behind so many countries united under the same currency still prevails even in the EUR banknotes ranging in denomination from €5 to €500. The seven colorful bills, Austrian artist Robert Kalina’s work of art, do not display famous national figures but feature Europe’s map, the EU’s flag, and arches, bridges, gateways, and windows, symbolizing the unity of Europe.

European Central Bank (ECB)

European Central Bank (ECB) is one of the seven institutions of the European Union and the governing body responsible for the 19 EU countries which have adopted the EUR. Headquartered in Frankfurt, Germany, the ECB employs more than 3,500 individuals coming from different parts of Europe and collaborates with the national central banks within the euro area (Eurosystem). Unlike the government of the United States, which in contrast only needs to consider its personal interests, the ECB must create monetary policies in a way that would best benefit all countries connected by the EUR. Although directly governed by European law, this institution resembles a corporation due to its structure of three decision-making bodies: the Governing Council, the Executive Board, and the General Counsel.

The ECB is a single-mandate institution tasked with setting the interest rates for the eurozone, managing the eurozone’s foreign currency reserves, ensuring the supervision of financial markets and institutions and the functioning of the payment system, authorizing eurozone countries’ production of the EUR banknotes, monitoring price trends, and most importantly assessing price stability (inflation). Unlike other central banks, the ECB is not responsible for promoting employment or growth; however, this approach appears to be slowly changing, realizing the need to foster economic development. With regards to decision-making, the main body within the ECB responsible for this task is the Governing Council and all decisions are based on the majority of the votes of the body’s members. It consists of the six members of the Executive Board, accompanied by the governors of the national central banks of the 19 eurozone countries.

The Governing Council typically meets twice a month at the premises of the ECB, yet the monetary policy will be announced in only one of these meetings. The current President of the ECB, Christine Lagarde, who was born in Paris, France, has been performing this task since November 2019. The ECB President, who has the tie-breaking vote, bears a variety of responsibilities: heading the executive board, governing different bodies within the ECB, and representing the bank abroad.

Key Economic Reports

Eurozone’s economic reports differ greatly from the ones of other countries outside Europe. Australia, for example, creates a report that only concerns the country in question. When it comes to the Eurosystem, there are as many reports as there are member countries. Nonetheless, only the reports of France and Germany are said to be of importance for forex traders, as the former holds 40% and the latter holds 20% of the eurozone’s GDP, making the two countries 60% holders of the entire GDP of the Eurosystem. Therefore, due to the previously mentioned percentage, the occurrences within Germany and France should carry more meaning than those in smaller countries.

The main reports traders should be concerned with are then the GDP and employment reports of France and Germany. Moreover, apart from these independent reports, traders should also look into the Eurozone’s employment reports, providing information for the entire Eurosystem. Last, French, German, and eurozone inflation reports (CPI and PPI), are also vitally important as the ECB’s main goal is to combat inflation and its monetary policy will cover all territories governed by the EUR. As the eurozone tends to be growing, the reports in question will cover more and more territories, and traders should keep up with the relevant information in order to be on top of the events pertaining to the EUR.

The Most Traded Pairs

The most traded pairs involving the EUR are EUR/USD, EUR/JPY, EUR/CHF, EUR/GBP, EUR/CAD, and EUR/AUD. As the most traded pair in the world, EUR/USD 36% of all trading volume in the world, which is almost half of all transactions worldwide. As traders interested in news events primarily define liquidity, such great interest in this currency pair probably originates from the fact that it has the most liquidity. The second currency pair in line, EUR/JPY, is said to have the most liquidity, alike EUR/CHF which rounds up the three most traded currency pairs that overall do the most business. The other crosses, EUR/CAD and EUR/AUD appear to be quite popular in the currency market due to their overall good movement and predictable patterns, but the liquidity is not as good as with the first three pairs. Unlike EUR/USD, EUR/JPY, and EUR/CHF, these two currency pairs are increasingly more prone to slippage and volatility. Finally, EUR/GBP is believed to be less volatile than other EUR- or GBP-based crosses owing to the economic closeness and mutual dependence, but changes in the currencies’ respective central banks’ monetary policies could render this pair highly sensitive.

EUR Correlations

  • EUR/GBP

A vast quantity of trade the United Kingdom does is with Europe and vice versa, which is what brought on this prominent correlation in the first place in addition to the two both belonging to the eurozone. Despite them using two different currencies, we can with almost absolute certainty predict that if Europe is struggling at a specific point in time, the UK will most likely follow. In the past few years, this correlation has been impacted by various events that took place across Europe. The 2007/2008 financial crisis affected the entire world, but the UK managed to quickly take action to preserve its economy and currency. The UK’s official currency did plummet and the British economy was on the path of collapsing when in late 2008 the GBP reached its all-time low of €1.02. However, they considered revising their monetary policy and offering quantitative easing which eventually helped the country stabilize the economy.

Europe, on the other hand, took more time to come to terms with what had happened and, in the first two years after the crisis had occurred, Europe created the laws that would later prevent them from enacting bailout plans. Changes had to be made and soon after, between 2013 and 2015, Europe would face the emergence of great debt problems in Portugal, Greece, Spain, and Italy. With the announcement of Brexit in June 2016, the GBP suffered the greatest one-day fall of 6.02% against the EUR. Before the COVID-19 pandemic, the GBP was slowly getting back on its feet, but the current ongoing viral threat and the expectation of a new trade deal between the EU and the UK still make the EUR/GBP imitate the strained relationship between the two. The currency pair even went from its worst (1 EUR equaled 0.8301 GBP in February 2020) to its best exchange rate (1 EUR equaled 0.9427 GBP in March 2020) in one month. 

  • EUR/CHF

The correlations between the two currencies have been said to near 100% in particular due to the Swiss policies that have tied the CHF to the EUR. In the times of the EUR crisis, when the currency was plummeting, a great amount of money was directed to Switzerland. The Swiss banks are said to be some of the strongest ones in Europe and their neutral government was believed to be extremely stable, which is why many decided to send their euros in that direction. Owing to this great sell the EUR-buy the CHF movement was reflected in the currency pairs huge moves. At the peak of the crises, the pair would move from 1.40 to 1.05 in a matter of a few months. The moment this happened, the Swiss National Bank (SNB) decided to take action, particularly because their currency was that strong at the time. They put a peg at 1.20 and the chart moved 1500 pips up in approximately one hour. The correlation is still quite high and this generally indicates that the currency pair in question is not the best pair to trade. The EUR/CHF is currently believed not to be the pair from which traders can earn the most because if the EUR moves up, so will the CHF and vice versa. These simultaneous moves will often be of the same amounts and the opportunities to make money are thus limited with this currency pair. Instead of trading this pair, some professional traders believe that one should simply choose to trade other EUR-based pairs due to the greater liquidity of the currency.

Trading the EUR

Country Stability

The JPY and the USD are believed to be the safe-haven currencies, yet the USD may at times exhibit some unfavorable behavior. Traders would in such cases naturally divert to the other currencies with the greatest liquidity, i.e. the JPY and the EUR. The USD generally performs well in times of crisis, while in times of economic prosperity these currency pairs such as AUD/USD or USD/JPY seem to be too small liquidity pools. Naturally, the EUR is a favored alternative due to its high liquidity.

Interest Rates

The interest rates within the eurozone averaged 1.84 percent between 1998 until 2020, with an all-time high of 4.75% reached in October 2000 and a record low of 0% in March of 2016. Currently, the ECB’s interest rate is still set at 0%, last confirmed in July this year. The EUR is typically expected to be in the middle compared to other central banks’ rates (available below) and according to some econometric models the Euro area’s interest rate is projected to trend around 0.00 percent in 2021 as well.

Inflation

The topic of inflation is the European Central Bank’s most important aspect and is, thus, an extremely important indicator to which traders should be attentive when looking into Europe’s reports. Each European country has its individual CPI and PPI, but the same of the eurozone is also extremely important and informative. If inflation is below 2%, the ECB is likely to ease the monetary policy, while the approach may change towards the other end of the spectrum should it exceed 3.5%. 

Trade Deficits

Unlike the GBP or the USD, the EUR generally does not suffer from trade deficits, as this has traditionally not been a cause of concern in trading with foreign countries with regard to this currency.

Economic Activity

In terms of the overall economic activity within the Eurosystem, traders should look into GDP reports discussed earlier in the text and, in particular, Germany as the largest European economy and the biggest driver.

Market Analysis

Currently, we are witnessing a decline in overall market volatility with an impactful momentum building up across the markets. As the market keeps moving up, the volatility appears to be further declining. The pattern we are witnessing now, forming towards the end of the chart below, shows how the price broke out and pulled back only to change direction upwards. The EUR crosses rarely appear to be short of such interesting patterns and they seem to be preferred to the upside.

The EUR crosses seem to be developing really well and the EUR/NZD chart, for example, reveals some moving average crosses towards the end of the chart (see all charts below). The EUR/AUD pair also demonstrates this positive development, although we could potentially see a turn of events should the AUD weaken. The EUR/JPY is revealing a momentum taking place, especially when assessing a wider time frame. The EUR/USD activity is unfolding slowly and should it break at some point soon, the price could potentially exceed 1.20. Generally looking at the EUR basket, there seems to be a great possibility for a breakout very soon.

The market has not been showing a great deal of action in the previous few weeks, thus not pushing traders to enter new trades each day. As the final week of August is about to complete the month, we are looking into September expecting more volatility to break the previous consolation and calm periods. Traders interested in trading news events may need to patiently wait out this quiet period, awaiting new rounds of important reports to come out. The EUR currency pairs are doing well during this period, as it seems from the charts above. Nonetheless, for the time being, it is quite difficult to completely interpret the long-term effects the COVID-19 is going to have on the currency.

The EUR has already undergone crises in the past and yet it has lived to become an even stronger currency. The monetary policy of the ECB seems to be slowly adapting and Europe appears to be working hard to promote the currency and ensure its autonomy. The EUR has never challenged the USD and the EUR’s share in international is significantly lower. Still, the media shows an interest in the development of the EUR in these times of crisis, highlighting the belief that the currency’s potential has not been fully reached on a global scale. The EUR has certainly struggled in the past, in particular when the stronger countries had to step in and provide assistance to the weaker ones.

Despite the global viral threat and the history of this unusual currency, the ECB maintains a positive outlook with regard to the EUR, hoping to further promote the currency through a series of vital steps as well as fiscal and monetary policy changes. Currently, we are looking into the future where the EUR is directed towards stabilizing the monetary union, increasing the currency’s influence, and granting more benefits to the eurozone’s member states.

Categories
Forex Assets

The Fundamentals of the Japanese Yen (JPY)

In terms of popularity, the Japanese yen (sign: ¥, code: JPY; meaning: circle, round object) ranks third among the eight most traded currencies in the world, only preceded by the USD and the EUR. This currency forms some of the most traded crosses as well, such as the USD/JPY currency pair that holds an 11% volume of all trades worldwide. As such, the JPY is also one of the most liquid currencies and enjoys the status of a reserved currency in many countries around the globe.  

Created in the late 19th century by the Meiji dynasty, the currency was part of the government’s goal of unifying Japan and modernizing the country’s economy. From the historical perspective, the JPY is not as old as the GBP, yet it has also undergone some tumultuous periods to this day. In particular, during the time of the Second World War, the Japanese official currency lost its value, which resembles what Germany had experienced in World War I. After the war ended, the YPY was pegged to the USD in the reconstruction period, as many European currencies before the EUR were (except for the GBP). Most currencies have at some point in history been tied to the USD especially because the fiat money’s worth is only of its perceived value since there are no hard assets to back it up. 

Therefore, due to the post-war state of the JPY, the ability to exchange Japanese money for the USD generated some stability to the currency, which is what all other currencies pegged to the USD aimed for. At the time 360 JPY was enough to buy only 1 USD, yet it still transformed the JPY’s instability into a more stable state, which is probably why this fixed relation between the two currencies lasted for approximately 28 years. Upon the US leaving the gold standard in 1973, the JPY was left to trade freely. This led to the Japanese economy booming in the 80s and early 90s, which not only recovered but also became the top manufacturing country on the planet. Since 2009, yen coins of 1, 5, 10, 50, 100, and 500 have been used, whereas there are currently 1,000, 2,000, 5,000, and 10,000 yen notes in circulation.

Bank of Japan

The central bank, called the Bank of Japan, has governed the currency since 1882. The bank consists of 30 members, whereas its Monetary Policy Board numbers 9 members who are responsible for managing interest rates. The governor represents the bank in public and has the tie-breaking vote. The current Governor, Mr. Haruhiko Kuroda, was appointed in 2013, replacing a conservative predecessor, Mr. Masaaki Shirakawa. The previous governor’s rule was marked by great dissatisfaction among the citizens due to the general lack of action, quantitative easing, and ideas to improve the economy and the currency since the 90s’ downturn. In the early 1990s, the Japanese stock market, Nikkei (or Nikkei 225) was 41,000 JPY. This bubble burst down to approximately 6—7000 JPY, and the market traded between 7 and 10 thousand JPY for more than 20 years after. Only after 2013 did Nikkei start to consistently exceed these values to now stand at a much higher level of above 20 thousand JPY (see the chart below) pointing towards tangible economic growth brought upon by the new plan. When the current (31st) governor was appointed, he was promised to bring about a change and propel the Japanese economy away from the several-decade-long sleep.

The investment of trillions of Japanese yen into the country’s economy, finally setting off inflation, jump-started the currency and the growth. The chart below also reflects how the financial crisis of 2007/2008 affected the Japanese market when a number of countries were running toward safe-haven currencies such as the JPY, which will be further discussed later in the text. Now, in the midst of the global pandemic, the Bank of Japan again took action to safeguard against the impact of the COVID-19 on the country and its economy. As of March, when we could see some larger drops not only in Japan but in other countries across the globe as well, the Japanese central bank enhanced monetary easing, implementing several measures to stabilize the economy. These measures have proved to be successful so far, with the country’s financial system maintaining the overall stability and functioning of financial institutions. Under the circumstances, the highest increase in the last 30 years was registered for bank lending in May, along with a significant increase in CP and corporate bond issuances as well as a decrease in the tension in financial markets.

Carry Trade

Between 2002 and 2007, the world experienced tremendous changes in economies, such as the one brought up by the expansion of the internet. Then in 2001, the S&P 500 value dropped by approximately 22% and the world economies seemed slightly unstable for a while. After 2004 and until 2007, there was a great boom in the economy, supported by massive moves in real estate as well as exorbitant prices of oil and gasoline. The JPY, however, weakened during the same time, making Japan the sole country unable to reflect the overall growth. Everyone seemed to be more interested in taking risks and, at the same time, great expansion was noticeable in Canada, Australia, and New Zealand due to their production of resources such as gold, silver, and copper, whose prices then started to increase.

The trade between China and Australia was also a good example of how the exchange of the commodities connected two economies: Australian mining supported the Chinese infrastructure investments before the Olympics. During that time, the price of some commodities, e.g. copper, doubled and inflation was particularly high in countries such as Australia, whose central bank increased interest rates to almost 10%. Japan, however, whose economy was stagnant at the time, had its interest rates at 0.5%. This led to investors displaying the tendency to borrow low-yielding currencies and sell high-yielding ones, which only weakened the former. Currency pairs such as the AUD/JPY cross were interesting not for the sake of trading, but for the benefit of the swap.

Since one currency’s rate is 10% and one goes short on the currency that pays 0.5%, the swap rate would actually be 8% for the year with fees removed, which is an amazing return. As many found this to be a great opportunity, the massive interest in this pair caused the AUD to appreciate, and so did the CAD and the NZD, whereas the JPY’s value decreased and kept going down as a result. Once this entire bubble burst, the stock market did crash, but currencies suffered even more with an unbelievable AUD/JPY 55% plunge over a few months. Many JPY-based pairs reflected massive drops at the time which largely contrasted the previous growth.

The years between 2004 and 2007 seemed to be focused on building and, finally, 1 trillion USD was estimated to have been staked only in short yen carry trades. Many say that such movements in the currency market were unprecedented when traders were able to get around 500 pips In AUD/JPY trades in a single day. Carry trades are not single currency phenomena as they occur when there is a high-yielding currency and a low-yielding one, leading to trades lasting longer than expected because of mass interest in such pairs.

Key Economic Reports

Japanese economic reports seem to have had little impact on the movement of the country’s official currency in the past and there generally appears to be little interest in the economic numbers of Japan. While the US’s economic reports end up affecting all currencies, some other countries, e.g. Australia, do not have such a comprehensive, widespread influence. As opposed to Australia, however, Japan’s reports barely even influence its own currency. Even the Bank of Japan’s Outlook Reports and the meetings they hold in April and October prove to have little effect on the JPY.

Despite the fact that the currency does not undergo massive or meaningful changes upon the release of these documents, traders should still be educated on some basic economic numbers that might have some impact on the currency. Some of the common reports that might concern forex traders are GDP, Retail Sales, Tankan Manufacturing Survey, and core CPI. Among these, the Tankan Manufacturing Survey, which is essentially a quarterly survey revealing the manufacturing strength of the Japanese companies, may be the most important document of all. In July this year, due to the COVID-19 pandemic, the report reflected the biggest low since the last quarter of 2009 when, for example, we could see this plunge in the currencies market as well (see the two charts above and below).

The Most Traded Pairs

The most-traded JPY crosses are the following: USD/JPY, EUR/JPY, GBP/JPY, CHF/ JPY, AUD/ JPY, NZD/JPY, and CAD/JPY. The USD/JPY currency pair equals 11% of all currency trades across the world, preceded by the 37% volume of the USD/EUR cross. JPY crosses, unlike the USD/based pairs, for example, are specific in that the JPY is always the recessive currency, which implies that once paired, all other currencies are against the JPY. This allows traders to easily assess relative strength and weakness in all JPY crosses, which is often much more difficult with other currency pairs that do not involve the JPY. Just by looking at the currency pairs listed in the first sentence of this paragraph, we can immediately tell that the GBP/JPY is the strongest pair, whereas the AUD/JPY is the weakest, due to the other two currencies’ relation to the JPY.

How to Trade the JPY

The JPY is primarily seen as one of the safe-haven currencies due to its stable, exporting economy backed up by the possession of major reserves and trade surplus. Some other countries, such as the US and the UK, still seem to be battling trade deficit difficulties despite having strong (or stronger) currencies than Japan. The fact that Japan has more exports than imports influences its economy and brings more money into the country, preserving the status of the JPY as one of the favored reserve currencies. This stability of the country is believed to make the JPY withstand economic stress even better than the USD for example. Japanese interest rates have historically been some of the lowest ones in comparison to other central banks, currently standing at -0.10%. An interesting fact about the Japanese currency concerns the fact that inflation has never truly been a major challenge for Japan, whereas deflation has. As discussed above, the extensive exportation has led to a massive trade surplus, and even the current Governor’s goal was to surpass this issue and raise inflation to at least 2%. 

Current Events

This currency has been moving downwards for a while now although it has not broken down yet. Some professional traders suggest that, should there be stimulation from the equities market in the form of a push upwards, the JPY could respond with a descending movement. The currency has been subject to volatility in previous weeks and a number of JPY-based crosses have come near major technical levels, putting longer-term trends at risk. Nonetheless, few actual breaks have been made with ranges remaining mostly intact. Should volatility still arise, traders may easily witness some price swings. 

Just prior to the onset of the coronavirus pandemic, the Japanese economy experienced in 2019 the biggest plunge since the second quarter of 2014 of 6.3%. Following this biggest GDP contraction in more than five years, the previously discussed Tankan survey revealed the first drop into the negative after many years. The volatility peaked in March, yet has slowly drifted lower since in particular to the world central banks’ decision to inject great amounts of liquidity into the financial system. Geopolitical tensions and a slow global economic recovery may still affect the JPY in the following months. The country’s neighbor’s strained trade relation with the US may lead to a sustained risk aversion period, driving the JPY higher against other major currencies.

In order to help with the impact of the virus, the Japanese government put into effect a massive stimulus plan, amounting to the value of 20% of the nation’s economic output. With the estimated 60% debt issuance in 2020, the Bank of Japan may need to increase its purchases of Japanese Government Bonds due to a lack of global demand so as to be able to keep implementing yield curve control effectively. The interest rates are still way under the mandated 2%, yet the accommodative approach of the Japanese government and Bank of Japan may help the JPY withstand periods of volatility in the future and stop the currency from declining. Whenever there was any instability in the past, traders naturally diverted to the currencies with the greatest liquidity such as the JPY, which appears to still have the potential to keep the safe-haven status.

Categories
Forex Assets

Fundamentals of the Australian Dollar (AUD) and the New Zealand Dollar (NZD)

The two currencies, the Australian Dollar and the New Zealand Dollar are quite highly correlated, which is why this article will deal with them both at the same time. Here, we’ll cover their historical backgrounds, economic impacts, correlation, recent market activity, and much more. 

Historical Background

Australia was populated by the British in an attempt to alleviate the overcrowded capacity of British prisons and grow the British Empire. The new colony grew to the extent that they created their own government in the end. The Australian Dollar, which is also known under the ISO symbol of AUD, is one of the top 10 currencies in the world. When compared to the country’s size, as well as that of its population and economy, the official currency of Australia is truly impressively ranked among other world currencies. This currency replaced the Australian pound in 1966 and is now considered a proxy for some vital strategies in the currency market. As opposed to the EUR/USD or USD/JPY crosses, which entail a number of goods and services trades that get intertwined with currency trades, the AUD’s privileged position mostly stems from forex trading alone.

Apart from the name and the symbol, the currency is nowadays also referred to as $A, $AU, or Aussie. Similar to the AUD, the New Zealand Dollar (ISO symbol: NZD) is one of the most traded currencies worldwide, which is again an interesting fact considering the quantity of goods and services exchange between New Zealand and the rest of the world. Another manner in which the NZD resembles the AUD is the impact of forex trading on currency strength. The other terms the NZD is also known by are NZ dollar, kiwi, or $NZ.

Most Traded Pairs

The most traded pairs are the two currencies against other major currencies, in particular against the USD, JPY, EUR, and GBP. Most liquidity of these two currencies and their most common pairs is generated from trading. Compared to the EUR/CHF cross, which is influenced by the goods and services (money) exchange between Europe and Switzerland, the liquidity in AUD and NZD pairs is an important difference. Currency pairs such as AUD/CAD or NZD/CHF involve very few trades of goods and services, so the money exchange mostly comes from traders, who are also not so great in numbers when it comes to these crosses.

Whenever liquidity is low, traders are faced with wide spreads and increased volatility especially with regard to news events. News announcements greatly impact the currency market’s trades of NZD and AUD, which is why crosses such as AUD/CHF and NZD/CHF are considered dangerous around the time any news comes out. Therefore, the most important question in terms of trading these two currencies is liquidity, which is why professional traders mostly focus on the crosses including the USD, JPY, EUR, and GBP.

Central Banks

Before the establishment of Australia’s central bank, the Reserve Bank of Australia (RBA), in 1960, the country relied on the Commonwealth Bank of Australia to issue the currency for the country. This task was moved away from the private bank into the government, which is responsible for the monetary policy at present. The RBA numbers nine employees who are all appointed by the government. The current Chair of the RBA is Mr. Philip Lowe, who took over the position from Mr. Glenn Stevens in 2016. The RBA holds 11 meetings per year on the first Tuesday of the month (all except January) when traders can expect announcements will be issued. The bank has a trifold mandate, with the stability of the currency, i.e. price stability and fighting inflation, being their primary goal. Their second aim is to maintain employment across the country, whereas the last one is the economic prosperity and welfare of people in Australia.

Unlike the ECB, whose mandate is more singular (inflation), the mandate of the RBA is quite wide. This comprehensive list of goals and tasks enables them to be rather flexible with regard to monetary policy. Australia and New Zealand are generally likely to show similarities in terms of economic policy. New Zealand’s central bank, the Reserve Bank of New Zealand (RBNZ), was established in 1934. The RBNZ comprises 10 members/governors who meet eight times a year. As of 2016, Professor Neil Quigley has been working at the position of Chair of the bank. The bank has a single mandate – price stability, yet unlike the ECB, the RBNZ seems to be more flexible. 

Economies

Australia, the 10th largest economy in the world, is strong in mining and agriculture, which make more than half of the country’s exports. Australia is a major commodities (iron, gold, etc.) exporter to Asian countries. Australia’s largest trading partner is China, which is an important fact for the currency market traders. The Chinese yuan (CNY) is, like the Indian rupee (INR), not allowed outside the country, which is why Australia and New Zealand are the means to get to this currency. This is why there is so much volume in these currencies despite the fact that they are not the largest economies in the world. Traders interested in the AUD are always advised to think of the strength of mining in Australia, commodity prices, and China. New Zealand’s economy is slightly behind Australia, ranked 16th in the world. Their economy is mostly focused on agriculture, which is why the country largely exports food and textile. New Zealand’s largest trading partner is China as well.

Economic Reports

The reports traders should focus on are rather similar to those of the United States: quarterly GDP reports, monthly Employment Report, Retail Sales, and Producer and Consumer Price Index (CPI and PPI) for both the AUD and the NZD, including Westpac Consumer Sentiment for New Zealand. 

The AUD/SPX Correlation

Australia is not the biggest economy, but the AUD is used extensively in the currency market as a proxy for growth. If economies are growing, there will be a demand for natural resources, causing the Australian exports to be strong and the country’s relationship with China, as one of the greatest economies in the world, comes into place here as well. Some of the greatest correlations we can see are found between the AUD and the USD as well as AUD and the S&P 500. Since the AUD is perceived as a proxy for growth, if traders assume that economies are going to grow, this will be bullish for the equities market and the currencies such as the AUD. As we can see from the chart below, the nature of this correlation has changed, but it is still quite high, exceeding 50%. Correlations can in general vary in strength during different periods; however, the AUD/SPX correlation can allow traders to draw some conclusions and expect changes in the prices of the AUD should the price of equities increase.

Another important AUD/USD correlation concern is gold, which has historically been one of the most prominent correlations. Therefore, the increase in the price of gold has traditionally been bullish for the AUD. Any decrease in the price of gold is then bearish for the AUD.

With regard to the NZD, one of the strongest correlations exist between the AUD and the NZD, which is why many young traders make the mistake of going short on one and long on the other. Although the two tend to move in different directions at times, these currencies are still highly correlated. Therefore, due to their strong correlation, the insight into what is happening with the NZD should provide information on what is happening with the AUD and vice versa. 

Owing to the similarities described above, if equities prices start to move up, this change will likely be bullish both for the AUD and the NZD. Should you come to the conclusion that a change in the price of gold is going to be bearish for the price of the AUD, the same conclusion can be applied to the NZD as well. 

Trading the NZD and the AUD

Both currencies require traders to take liquidity, proper selection of crosses, and avoiding news events into consideration. Currency pairs such as GBP/NZD can be great for traders, but they tend to get really volatile around the news announcements, leading to unpredictable moves and wide spreads. It is also important to remember that both New Zealand and Australian economies are focused on commodities and Asian countries. Concerning interest rates, both Australia and New Zealand keep their rates at 0.25%, which places them right in the middle among all major currencies’ central banks. Inflation in both countries tends to vary according to CPI and PPI reports. The two countries typically do not have any challenges with the trade deficit, as they are large exporters that typically carry a surplus. What is more, as these two currencies are tightly connected with global growth, commodity prices are important factors that determine what is happening to the AUD and the NZD. 

As a proxy for global growth, the NZD and AUD pairs will reflect any global panic. The 2008 AUD/JPY chart below reflects a large drop (a 50% loss) in the midst of the crisis that was affecting the entire world. Traders use these currencies to trade growth as well as to short and sell when there is a recession.

Recent Market Activity

The AUD has been quite resilient lately with the price action slowly building up towards the end of the chart. While the chart did give a few breakouts in several places, they would simply fall. What is more, as we can see from the chart below, the past three months the price has been consolidating and this consolidation is likely to break out sometime soon. However, the CAD for example has shown how the breakdown itself is not as relevant, since the price of the Canadian dollar did break down for it to go up the very next day. The near future of the AUD may reveal similar tendencies, with the price either going straight up and growing even more or, on the other hand, going up and then pulling back in the opposite direction.

The longer the consolidation, the more difficult for the trader to assess the chart’s future movement as much resistance has been building up. Likewise, the shorter distances do allow the price to break out more easily, and the break-out and pull-back tendencies are generally much more often in such cases. The chart below shows how the currency has been doing well lately in 2020 from the technical point of view, with its strength supported by the equities and gold markets experiencing all-time highs, strong risk-on sentiments, and a weak USD. The end of the August 2020 chart reveals how the current trend should be bullish, but it is not, so it is a sign that something is wrong at the moment and that the currency should be handled with care. 

As the chart below reveals, the volatility seems to be on the low when it comes to the NZD lately. Compared to March, for example, the volatility level is much lower now. The NZD lost its momentum going upwards and in August 2020 started moving steadily in the opposite direction. The big move down may easily reach the bottom end, i.e. the support line, which would require a change in the overall outlook on behalf of traders.

Traders have been able to see some divergence with the AUD/NZD pair in the last few weeks. If traders are thinking of whether to go short on one or the other currency, the NZD is currently a much better pick. The AUD and the NZD are similar, but if they break the level they have been approaching for a while now, traders might be able to witness a more significant divergence happening. Should traders encounter a slowdown, the AUD may turn out to be a better choice after all. Owing to the current progressions, traders are advised to pay close attention to this currency pair in the time coming.

So, what does the future hold for these two currencies? It’s tough to know, the same as with any currency pair, as there are simply too many factors that determine how the market moves. What we can say with certainty is that at this time the pair is delivering some excellent trade opportunities if you only know where to look.

Categories
Beginners Forex Education Forex Assets

The Connection Between Crude Oil and the Climate Emergency

About ten thousand years ago in the world, there were about five million people; 9,000 years later, the figure was over 300 million. And just as we started consuming large amounts of oil, the world’s population increased by 5 billion people in 80 years.

We can easily see that the population increase, the eradication of a large percentage of global poverty, the increase in life expectancy, the reduction in hours worked, and the increase in the quality of life with the consequent increase in per capita energy consumption, It has only been possible to achieve this by burning huge quantities of oil.

At the present moment, humanity is at a crossroads and has to choose between two paths that seem very different, but, curiously, the end result will be the same in both cases.

Let’s look at the two possibilities:

1 – We believe Greta’s grace of the climate emergency. We start shutting down coal-fired power plants, of course, nuclear power plants, we reduce CO2 emissions a lot, we put an expiration date on fossil fuels and we increase the prices wildly for the rights to pollute.

2 – Or, on the contrary, in a short time Greta goes out of fashion and nobody does anything of everything proposed (most likely option). Even if the subject is still on TV, people are likely to talk a lot and do nothing. It may become a fashion very similar to slimming: everyone says that when the holidays are over they will take the diet seriously, but obesity figures are increasing every year.

As I said before, whether option 1 or option 2 occurs, the result is that the world’s population will collapse in the next 30 or, at most, 50 years. If fossil fuel consumption is drastically reduced and CO2 is severely reduced, the world’s population will plummet. Then we will talk about the possibility that renewable energies can replace fossil fuels. If the climate emergency fails to reduce crude oil consumption (the most likely option), the result will be the same, as crude oil will reduce itself anyway.

Look at the Problems of Renewables

Given that sooner or later the decline of oil will come, we will have to analyze whether renewables will be able to sustain the current model of society with the world population growing at a rate of 80 million consumers per year.

Hydropower is the best renewable energy of all, but it suffers from an unsolvable problem: at present, there is almost no increase in production, because you cannot put reservoirs where there is no abundant water. We cannot, therefore, trust that this type of energy can greatly increase its production and will solve our problems of scarcity.

Solar energy has several problems that I will list below:

1 – It is an economically unviable energy. This serious problem is now solved with subsidies; increase in the price of electricity; budget allocations from taxes to make this energy viable; cheap credits for facilities; negative interest for those investing in solar farms to settle for a miserable return; bad loans for the manufacturing industry, which is also happening with the debt of shale oil companies, that will result in the largest debt default since the subprime.

People do not relate that, to pay for everything said in the previous paragraph, you have to consume abundant and cheap energy that creates wealth with which to pay for the losses produced by renewable energy. Nor does anyone think how and where the wealth will be obtained to pay those subsidies when there is no oil to burn.

Logically, the manufacture of solar panels and the machinery that makes solar panels is done by burning oil. Can they still be produced when there is no oil? People have assumed as a dogma of faith that science advances that it is barbarity and that soon they will invent something that is able to circumvent the laws of thermodynamics. 

2 – The permanent supply of renewable energy (except for hydropower) cannot be assured. To cover the cuts in the supply of renewable energy, there is no choice but to double the installed power with fossil fuels. How will this problem be solved when the only fossils left are the usual politicians and do not produce energy?

Doubling the facilities doubles the investment, and when you double the investment with the same profits, the return drops by half.

We return to the same vicious circle: the State subsidizes electricity companies to invest in unprofitable facilities. Subsidies are paid from taxes. Taxes are a part of the benefits or wages of individuals or businesses. And those benefits come from burning a lot of cheap, abundant oil. At a time when oil is neither abundant nor cheap, the circle is broken and all the lies of politicians (who even believe themselves) clash head-on with the bitter and crude reality.

3 – Battery safety is another difficult problem to solve. When it comes to increasing the energy density of batteries, the danger of fire or explosion increases too much.

4 – Who will invest in solar gardens when interest returns to 5%? And if the cost of electricity increases exponentially, will it be possible to generate wealth by producing products with such a high cost of electricity? Look, I’m talking about wealth, not paper money.

5 – Agricultural tractors and heavy machinery are currently not powered by electricity. So, is there a possibility of trading in the future? After reading point 3, I am not clear.

Most of these points are for windmills.

It is unlikely that the current standard of living can be maintained; the welfare state, which is another way of saying the welfare of the State; the 80 million annual increase in the world’s population, in addition to the increase in life expectancy. All that without oil is unsustainable.

Oil has enabled an increase of 5 billion people in 80 years. Without oil, the world’s population will fall to at least half of what there is now. The sharp decline in the world’s population brings us good news and bad news: the bad news is that future pensioners will be paid just enough not to go hungry but without whims. The good news is that the climate emergency will have cured itself. If there are only half the people consuming energy and polluting, everything goes back to its natural course.

Once we admit that the world’s population is going to be in the middle, we still have two options to choose how we want the population reduction to happen. We can choose to reduce the population to good or bad. As I know the human species, I have not in vain related to bipeds since I was born, my prognosis is that they will not choose either option, and reality will lead us to the bad option.

The bad option is to do nothing, to continue living in an unreal world of dream fantasies, and when the reality of the oil shortage is imposed and everyone exclaims stupefied who would imagine it? It’ll be too late to plan anything. The population will shrink with an exponential increase in resource wars, violence, looting, vandalism, hunger, misery, and deforestation from the cutting of wood for cooking and heating.

The good option is planning. It’s not about killing people, it’s about encouraging people to have fewer than 2 children. What happens is that no politician ever accept or propose to lower the birth rate, because of the following:

“People have been embarked on the pyramid scheme of pensions, also called the Ponzi scheme. All pyramid scams are based on the shape of the pyramid: there has to be a large base of people paying and a small peak of people collecting.”

Categories
Forex Assets

What is the Best Trading Position? Part V – How to Choose Properly What Assets to Trade

So far, our lessons were quite technical, involving a lot of numbers and calculations. Today, however, we wish to show you how your own participation and involvement can grant you the best trading position. The examples will be based on the forex market, but the rationale of the story transcends to all markets we trade.

What are the consequences of trading widely popular currencies?

Most traders will tell you to trade the EUR/USD, USD/JPY/, and GBP/USD. Unfortunately, most people will rarely explain to you how the USD is heavily controlled by the big banks due to its popularity. What this further means is that the market can become pretty volatile and the prices can move suddenly without any logical explanation. Some other currency pairs, such as the NZD/CHF one, may escape the big banks’ attention, which is mainly triggered by a massive influx of orders. In addition, currencies such as the USD are highly susceptible to news events, leaving room for the big banks to manipulate the price in any direction they need to ensure their liquidity. That is why you should be very careful about choosing what you are going to trade in your market of choice and strive to earn as much as you can about potential dangers.

What are the best currencies to trade?

While you can trade any combinations involving the eight major currencies (avoid the USD whenever possible), you should still aim to make more profitable and stable choices. For example, trading the CAD/JPY is better than trading the EUR/USD, but the CAD and the JPY both are affected by USD news to a degree, which means that you can find other options that will prove to be better. It is your job to understand how the currencies you wish to trade work.

The EUR is a great currency to trade because it does not move much when the news on the USD comes out. Moreover, all the news concerning the EUR mainly related to the Eurozone, mitigating its overall impact. The only time traders should pay attention is when the ECB releases news, which still happens rarely and can thus be easily avoided.

The GBP, interestingly, does not correlate with any other currency, which makes it move more often than others do. Like the EUR, the news concerning this currency is easy to notice and avoid.

The CHF appears not to react even to the news it is directly related to. It may, however, react to a lesser degree to the news concerning the EUR. Furthermore, the CHF is one of the easiest currencies to manage because there is almost no erratic movement.

What are the best currency pairs to trade?

The EUR/GBP is one of the most traded currency pairs, but also one of the rare ones that does not involve the USD. Interestingly enough, this pair only accounts for 2% of the market share, which is extremely suitable for avoiding the big banks’ radar. It also gives low ATR, making it one of the least volatile pairs to trade. The EUR/GBP moves slowly, which allows you to set the stop loss and take-profit levels without the two being hit in one day. However, there is no stagnation or choppiness, making it much easier to control in comparison to other currency combinations. Also, the pair isn’t triggered by the US news and, even though both are European currencies, they do not correlate often, so you should not see either of the two gaining strength as the other one is growing weak. 

The GBP/CHF was once the inverse of the EUR/GBP, which thankfully changed after the EUR/CHF crash of 2015. The EUR and the CHF now correlate increasingly less, which allows traders to trade them both without needing to choose between the two. There are many advantages to trading this pair, including the fact that it moves much faster and trends more than the EUR/GBP.

The AUD/NZD is a perfect choice for all traders who tend to avoid volatile markets and heavy news. Both of the currencies that constitute the pair avoid the USD, which immediately takes all the unnecessary drama away. Another important fact is that the AUD and the NZD are both risk-on currencies, which is really important. Currency pairs such as the AUD/JPY, for example, are risk-on/risk-off, which makes it dependent on the stock market. Luckily, the AUD/NZD pair behaves similarly and they do not correlate much.

Additionally, any important news typically comes out early in the trading day, which is ideal for people who trade just before the close of the daily candle. In case of some unfavorable news, this gives these traders almost one whole day to see if the price will correct itself. Most commonly, the price goes back to where it was the previous day, so the news does not need to affect these trades negatively. Because of this pair’s specifics, you can either avoid it in the testing phase or use it as the control currency to see if your system functions at all.

As you can see, just by gathering information on these currencies, their histories, and trading specifics, you can discover how some common facts you read online are not necessarily true. That being said, you must find a way to experience whatever you read in a safe environment (i.e. demo account) and save yourself the pain from making the wrong choices. Whichever market(s) you opt for, make sure that your information collection strategy and research skills are at their best since this is something that will help you build your unique position.

As promised, we are giving you the results of the last problem where you were tasked with applying the scaling out strategy:

Based on the chart, we can see that the ATR is 34.86, which we will round up to 35. Owing to this information, we can calculate our stop-loss and take-profit point (52.5 ≈ 52). If we are dealing with a 50,000 account, our risk equals 1,000, so the pip value is 19.2 in this case. We will make two half trades (9.6 each). After the price hits the take-profit level, we will move the stop loss to the break-even point (the amount you invested in the currency pair in the first place).

We are getting closer and closer to the end of this series, so make sure you follow our next article and complete the story on the best trading position!

Categories
Beginners Forex Education Forex Assets

Metals Trading: How to Trade Silver in Forex Platforms

The fact that there are approximately 3 billion ounces of fine silver in circulation around the world naturally impacts the way we perceive this commodity. Interestingly enough, gold seems to be much greater in quantity than silver but is, at the same time, much more difficult to obtain. Silver is used in a number of different industries as, as such, is an important commodity for the creation of batteries and medical instruments, among others. This scarcity and ease of access naturally affect its price, demand, and our choice of trading strategies. While there are minor differences between the FX and the XAG markets, trading metals is said to be similar, if not even easier, than trading currencies. Today, we are going to see how we can trade silver, listing all vital pieces of information to help you in the process.

The Metals Market Vs. the Forex Market

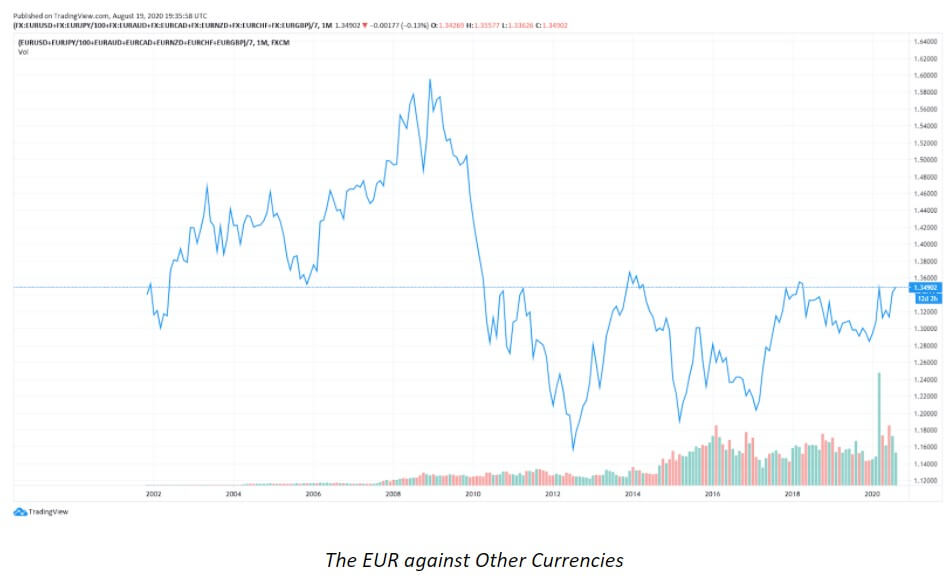
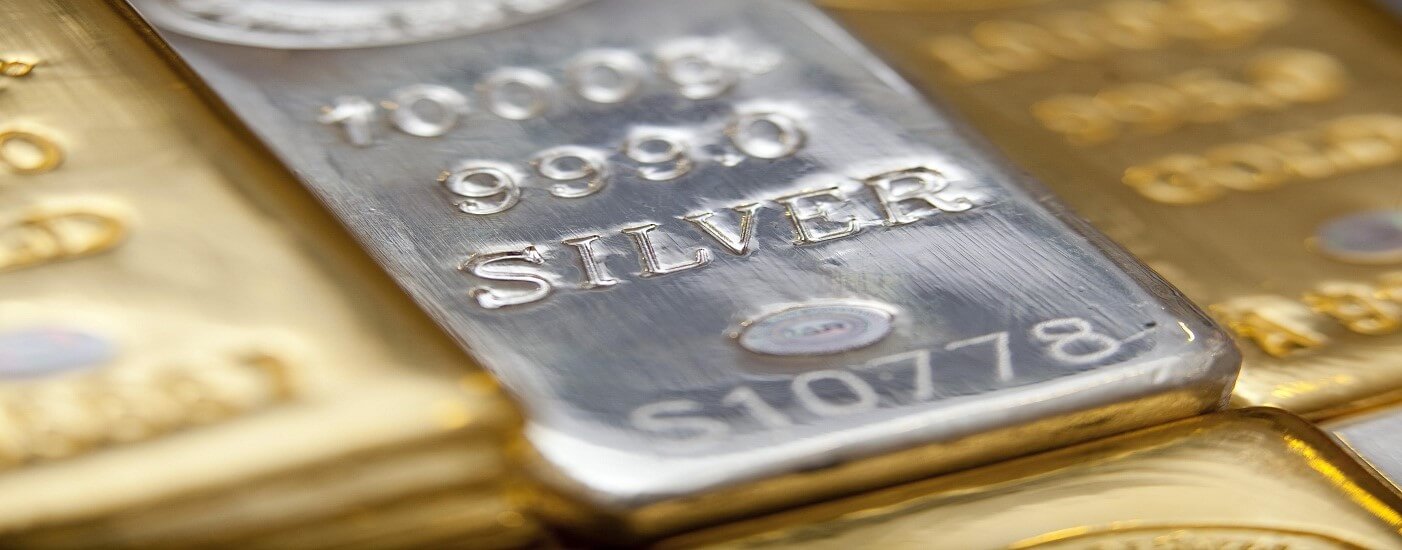
Half of all silver, like some other commodities, is completely used up after production. Due to its limited quantity, supply and demand lie in the core of this market, which is also true for stocks and crypto. Unlike metals, the value of currencies revolves neither around traders’ willingness to purchase something at a specific price nor its quantity, at least not for individual traders and investors. While the big banks do sometimes manipulate the prices in the metals market, this is much more visible in the spot forex. As we trade silver against a currency, we need to take a different approach because of their inherent differences. Therefore, the strategies traders use to trade silver cannot completely mirror the ones utilized in trading stocks or currencies. 

Requirements for Trading Silver

You first need to have a broker who allows spot metals trading. Since brokers who give interest rates for metals are few, finding a broker like that can be more difficult, especially in the US. Still, you do not need to use the same broker for trading currencies and metals. What you should do, however, is open a new account for trading silver. 

Brokers

Different brokers will offer different options, so some may allow you to trade only currencies, while others will only let you trade metals against a few currencies. Oanda is believed to be very useful for educational purposes, while Blueberry Markets is a well-known broker for traders living outside the US. Markets.com, another broker praised for its ease of use, customer service, and safety, offers interest rates for various markets from metals to stocks, commodities, indices, EFTs, and crypto. What is more, not only is Markets.com available on the MT4 and MT5 but it also offers its own trading and charting platform for US citizens. Other alternatives exist with mostly unregulated crypto deposit brokers.

Trading Pairs

Generally speaking, metals can be traded against many different currencies; however, professional traders seem to love the XAG/USD pair. Usually, it is silver that determines the cross’s movement in the chart, but there are some exceptions. For example, if the metal is stagnating, the USD will take over. However, most major USD moves typically end up driving the metal in question. Other combinations include the XAU/XAG. Although there are no strict positive correlations between the two, silver often runs alongside gold.

Technical Analysis Specifics

Reversals: While trading reversals are welcome in trading silver, trend trading is still said to be a better approach. Professional traders suggest for the leverage in trading reversals to be lower than for trend trading. However, try not to use outdated and inapplicable tools that would perform poorly in this market, such as calling tops or bottoms. Rather, look for more modern or suitable tools and instruments and test their performance.

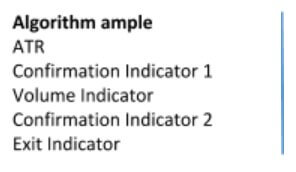
Algorithm: The algorithm for trading currencies and silver could be the same. The algorithm below is an example of what you can use for trading silver. Make sure you use different indicators that work better with precious metals. Naturally, you should test out everything and make choices based on what suits you best. For example, your confirmation and exit indicators may differ from the ones you used for trading currencies.

ATR: Any forex trader might immediately notice how metal pairs exhibit really high ATR levels and daily volatility, but with proper risk management, any trader should be able to manage this fast-moving commodity successfully. 

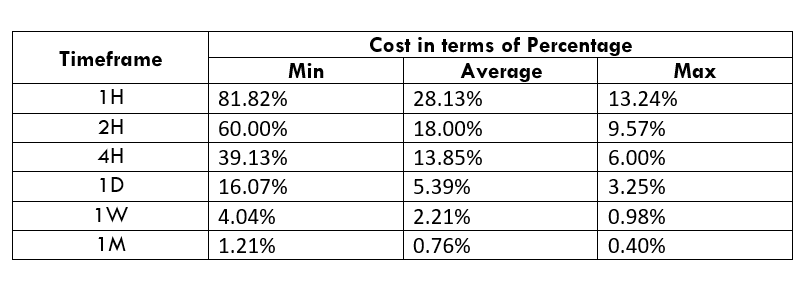
Spreads: Spreads for the metals market are higher than what you may find elsewhere, but this should not be a cause of concern.

Volume indicator: Similar to continuation trades in forex, if the overall trend is long and you get a long signal, you can still enter the trade even if your volume indicator seems to disagree. However, professionals recommend that you listen to your volume indicator in all counter-trend and reversal trades.

Sentiment indicators: While chasing sentiment is a bad idea in the world of forex, it may be applicable to trading silver in specific cases. For example, if you see a major discrepancy between traders who go long and the ones that go short, which did happen in the past, do not do what the majority does. Analyze this ratio and see if there is room for you to go short or long.

News: Luckily, with trading silver, you should only worry about the news events concerning the other half of the pair (e.g. USD interest rates and elections).

Strategy: Owing to its nature, most traders want to buy and hold silver. Not only is this approach a secure way to protect one’s finances in general but it is also a great way to stay on top during economic downturns. Holding precious metals long term is also a perfect hedge against inflation and currency wars.

Anyone interested in trading the XAG should know that it takes time to start earning money in this market. However, you should also bear in mind that the wealthiest silver traders actively trade spot metals. While silver might be a new source of income for you, you may also consider expanding your portfolio to other metals because of the financial rewards. For example, trading fewer metals pairs can prove to be equally beneficial to trading all 28 major currency pairs. If you are already getting good results in spot forex, why not add on and double your return? Finally, remember not to give in to the ease of trading silver because using risk management, money management, and psychology tips you used in currency trading and investing are equally important here. Carry out testing as you would normally do for your forex algorithm and currency pairs and then fully enjoy the benefits this market has to offer.


Categories
Beginners Forex Education Forex Assets

Adding a Currency to Your Trading Scope – The Singapore Dollar

A common approach to forex when traders begin their trading for the first time is to focus on one asset. Cryptocurrencies are a popular choice even though not a good pick because of many factors, one being this is still not a developed market. Many books, videos, bankers advice, and mentors suggest the EUR/USD to start with, without any good reason. Liquidity is not an issue if a broker has at least a few liquidity providers, so the EUR/USD pair as the most liquid asset on the forex is not offering any real advantages even in this area.

If we take a look at the two economies, it gets complicated. The US economy, politics, and dominance create so many possibilities to surprise your trading strategies in a bad way. And the EU economy is also somewhat unpredictable to follow with so many countries. Yet beginner traders are attracted to this pair thinking it is “safe”, easy, and because “everybody is trading it”. Our previous articles describe this pair as one of the worst you can pick, mostly because of the proven contrarian trader concept. Then there is another extreme, although rare, to go with an exotic currency pair with increased volatility. We have also presented our opinion on exotics in a separate article.

According to contrarian traders, you should go will all the majors and their crosses but avoid the popular EUR/USD and GBP/USD if there is a similar trading opportunity. This way you can fine-tune your system, plan, and mindset on various playgrounds ultimately giving you versatility. Now, as you develop, expanding the scope where you trade becomes a rewarding endeavor. But it does not come without caution. How we approach this expansion is described by a technical prop trader we are going to present in this article, using the Singapore Dollar example. 

The market during most of 2019 was flat, forex had a very low activity which can be seen just by looking at the VIX, EVZ, and other Indexes that measure volatility. In this environment, it is hard to get a relevant trading sample test with the asset you want to include in your trading array. So what you might think as good before, comes to be a very bad choice once the markets return to normal. Beginner traders are not always informed about the market stages and might go into volatile, less developed, even experimental assets such as the alternative crypto market.

A similar approach before the crypto age was when traders would often go with the penny stocks trading. When a prop trader wants to see if his system is working on a new asset, testing is a must. When the forex market is flat, testing in such an environment does not reflect normal conditions. Now, in 2020 we have another abnormal condition caused by the pandemic and extremes in the state/central banking stimulus. However, whenever there are trends to follow and capture profits from, it is good enough for signals to generate and test new assets. 

Testing involves a few stages depending on how thorough you want to be. Of course, investing more time with testing will give you more reliable data but at one point you need to decide if the results are good enough. Some currencies can have special drivers and chart characteristics we may or may not spot from testing alone. Forward testing on a demo account is an unavoidable phase after backtesting. If we want to add SGD, we can start with one pair, such as USD/SGD. After favorable forward tests, we add other combinations of the SGD, if available by the broker to test the currency and expand our trading scope. Since we aim to build a universal technical trading algorithm if you follow our structure example, there are no opportunity limits, all assets are viable. Professionals have an idea of what asset they are looking at, not all are equally interesting, therefore they scan what could be a good fit for their trading system. Trend following systems needs the volume that drives trends, without too many factors a trader cannot control (risk) and a chart with minimal whipsaws, among other, less important considerations. 

Consequently, Singapore Dollar could be a good choice. The SGD is not a currency that “drives the bus”. It is not dominant in the price move, as one prop traders describe it – it is a blank canvas. In the long term and even in the midterm, it will be the other currency that moves the price you are pairing with the SGD. As for the news impact, they almost do not have any effect on this currency. When you look at the reports, the Singapore economy is a good all-arounder most of the time. Singapore is the banking hub for most of Asia and the number one banking hub for the whole world right now. A bad manufacturing report in Singapore does not have any significance, as it turns out on the price change too. The economy is not based on manufacturing here and according to some research, even the GDP report does not have a big impact too.

Our prop trader is very interested to test currencies and markets like this, it all favors his technical trading system specialized in trend following. Now we could take other countries with similar characteristics, a few of them, but then liquidity might be a big question mark. Most of the time countries, their economy, and the currency might seem a great pick if we take all the above factors into account. But this particular currency might not be traded enough to have the liquidity we need. We do not need super-liquid pairs like the EUR/USD, but enough so we do not have uncontrollable risks caused by low liquidity on the market expressed as gaps, slippage, extreme spikes, crashes, whipsaws, and so on.

The Singapore Dollar is heavily traded, it has the liquidity, USD/SGD even has more liquidity than some of the minor pairs out of the major 8. This means we do not see whipsaws that cut the trade we have opened yesterday on a daily timeframe. Some observations conclude that SGD pairs either move smoothly or do not move much, enough to trigger our volume or volatility filters. Such movements are easily followed, ensuring high probability trades just because of the currency’s typical behavior. According to our prop trader, the only pair that is a bit jumpy is the CAD/SGD while other major combinations with the SGD are smooth. 

The picture above is the USD/SGD daily chart with smooth trends followed by clear flat periods even during the pandemic shock starting from march 2020. 

A few areas of caution, by looking at the other charts, you may think SGD pairs correlate. This may seem like a possibility but by looking at a zoomed out chart you will conclude pursuing signals out of correlation is not effective. The picture below is EUR/SGD (orange line) and USD/SGD (blue line) is showing mostly positive correlation until July 2020 when it became negatively correlated and then back again later. 

Correlations are hard to use in trading according to the experience of prop traders. Even if you notice a correlation, be it accidental or fundamental, the move should reflect in your trading system anyway. Trying to predict the movement of one asset just after another moved in the opposite direction is a hardly effective strategy. As described in our article about correlation, it is a good idea to ignore this type of analysis. 

Another factor traders might consider when looking for a new trading asset is the spread. Unless you are following a very high-frequency scalping strategy, the typical spread amount should not count as a criterium. It is a common misconception to trade nominally tighter spread currency pairs. Tighter spreads will give you a bit more if you are trading on an hourly chart, for example, although on the daily chart the spread is mostly marginal relative to the potential gain. Only highly illiquid exotic pairs have wide spreads and only on certain events. The spread dynamics during the day are not known unless measured, and rarely anyone measures it. An unaware trader can decide to trade some asset or pair just because the spread at that moment was tight, not knowing it can widen multiple times and trigger the Stop Loss. Optimal daily timeframe strategy will unlikely be affected in this way, however, the spread should not be a deciding factor in any case.

Aside from spread dynamics, which can also be dependent on the broker liquidity providers, traders also commonly forget to measure the volatility to spread ratio. Volatility is easy to measure with the ATR indicator. Now, comparing the ATR to spread ratio across assets can give us an approximate spread influence on our trades. Some currency pairs have higher spreads and lower ATRs, while some other pairs can have similar spreads but very high ATRs. NZD/CHF might have 3 pip spread but the ATR of 47 pips, meaning the spread percentage is about 6%. This percentage is one of the worst out of the 28 major currency pairs and crosses. High-frequency trading strategies on lower timeframes might have some use out of this analysis by choosing currency pairs with the best ratio (low spread with high ATR). Although if you trade on a daily chart using our algorithm structure and plan, it is completely redundant. 

Do not concern yourself with the spread, including on your search for a new currency or asset to trade. ATRs on the SGD pairs might not be very high compared to other pairs and the spread might not be as good. Still, daily timeframe traders should not care about this. If you have some criteria to trade only when the spread is lower than 3 pips, for example, missing out on a 150 pip trend because of 3 pips is a foolish decision. On the other hand, if you just randomly pick assets to add to your trading scope, you will probably find out your system cannot be as effective. Do your backtesting and then a good sample of forward testing. If the results are good, nothing is stopping you to reap the extra rewards.

To conclude, keep in mind the economy of the country behind the currency, how sensitive it can be on news events, how the charts look, is the currency liquid enough. In the next few articles, we will be covering how you can translate your forex trading system, adjust it If needed, and apply it to other markets. The Singapore Dollar is a good choice if you are looking into exotics, but it is rarely considered by traders. Currently, the SGD daily charts look smooth even during the pandemic and could even be a better choice than a pair with the majors only.

Categories
Beginners Forex Education Forex Assets

How to Choose a Currency Pair for Trading in Forex

Two mistakes that a lot of new traders make is to simply select a random currency pair to trade or to try and trade too many different pairs at once. An important thing to do when first starting out is to decide which currency pair you want to trade with, you can, of course, change this decision in the future or to pick up multiple other currencies once you have a bit of experience. However, that initial first currency pair can make a big impact on your trading. This is why we are going to be looking at how you can choose that first currency pair that you are going to trade.

Before we select the pair that we are going to be trading, we need to actually understand what a currency pair is. The currency pair is what it sounds like, it is simply a quote of two different currencies. There is the base currency which is the first currency listed so in the EURUSD pair, it would be the EUR, the quote currency pair is the second currency, so again for the EURUSD pair, it will be USD. The quoted figure is the current exchange rate of the base currency for the quote currency. For example, for the EURUSD it may be 1.11 which would mean that you get 1.11 USD for each Euro traded.

When first starting out with trading, it is recommended that you select one of the major currency pairs. This is for the simple reason that the amount of volatility is lower and the amount of liquidity is higher, this offers a much safer trading environment with less violent price movements than some of the minor or exotic currencies. Some of the major currency pairs to think about have been listed below along with some of their main characteristics, to give you an idea of what is involved in them and how they may behave.

EUR/USD

This is the world’s most traded currency, this currency pair has the highest level of liquidity out of any of the available currency pairs. Due to this, it is also one of the most stable. While it does have a lot of large trends, moving large distances, it does this at a slower pace, never jumping too far with a single tick. Many describe this pair as one of the safest pairs to trade due to it having the lowest spreads of all currency pairs. This pair is most active during the European and American sessions and can have some added volatility when there is news within the Eurozone and the United States.

USD/CHF

The US Dollar against the Swiss Franc, this pair often moves the other way to EURUSD, it has smaller movements with very few large jumps and often has a small spread making it one of the safer currencies to trade. The Swiss Franc is a safe haven currency which means that when there is a crisis or economic drop, it can also go down in value, this pair is active during both the American and European sessions.

GBP/USD

This used to be quite a safe pair to trade, but now with Brexit happening it is a little less predictable. There is still hope that once the Brexit saga is over that it will return to its old steady self. It is still incredibly popular for traders due to its increase in volatility and profit potential. It can have slime huge movements which are perfect for trend traders but also have a lot of breakouts as well as false breakouts which can catch people out. This pair reacts a lot to events in Britain and is most traded during he European and American sessions.

Other pairs include things like the USDJPY, USDCAD, AUDUSD, and NZDUSD, those are the other major pairs. Generally, they will have lower levels of volatility than the minor pairs but can still react quite a lot to major news events. They are often good for trend trading as they can have long drawn out movements rather than large and quick jumps.

The minor pairs include things like EURJPY, GBPJPY, EURGBP, EURCHF, GBPCHF, EURCAD, and GBPCAD, these pairs can have some added volatility to them and so are often not recommended for new traders. Instead, stick to the major pairs to start. The Exotic pairs include things like USDZAR, USDMXN, USDTRY, and USDRUB. The liquidity on these pairs are lower so you cannot make as larger trades at once and they can also jump about a lot which can make them very profitable, but also very dangerous which is why they are not recommended for beginners.

We mentioned above that it is recommended that you only trade with a single currency pair to begin with, this allows you to concentrate fully on that one pair. It also means that you are able to learn more about the way that the currency pair moves, allowing you to better analyze and trade it. You can branch out afterward, but we recommend learning all that you can about one before you try looking at another. You do not want to get confused and to mix up the characteristics of different pairs as this can lead to a series of losses.

In order to select the pair that you want to trade, you will need to look at a few things. The first is the strategy that you are going to be using. Some pairs are better for longer-term trading and others for the short term. If you are a scalper then you want a pair that has more volatility. If you are a trend trader, then you want one that goes on larger and longer movements over time. You also need to consider the time that the pair is most active. If you are from the Uk, then there is no point in trading a currency pair that is most active in the middle of the night, instead of one that works for the time that you will be up and that you will be free. 

You should also consider the spreads. Different pairs have different spreads. If you are looking for short-term trades or to scalp, then we would not recommend getting a currency pair with a larger spread. This will make it very difficult for you to make a profit, so instead, you would need to go for one with a small spread. This doesn’t matter quite as much for trend traders, but it is still worth considering the impact of the cost of a currency pair when looking at your potential profits.

So those are some of the things that you should think about when you are selecting a currency pair to trade. Think about your strategy, the costs, and when you are available to trade, then think about the characteristics of the different pairs. Work on one pair at a time until you have a good understanding of it and then move on to your next one. Don’t try to do too much at once and you should get on just fine.

Categories
Forex Assets

Which Currencies Should I Be Trading With? The Secret to Asset Selection…

One of the most common mistakes made by some Forex traders is not to understand that, correctly deciding with which pairs to make trades, and in which direction, is 90% of the battle to make profits. Unfortunately, many traders focus on trying to perfect the entry methods, not realizing that if you pick correctly what you’re going to upload today, for example, then the exact input method used will not cause a noticeable difference in your trading results. You can become an expert in selecting entries in the 5-minute chart, but if you do not choose with which to trade with a broader perspective, and in the longer term, will be of little use to you. Why do some traders frequently make this mistake, and how can they choose the currency pair with each day in a smarter way?

Why Traders Do Not Consider Pair Selection Carefully

Most traders are eager to start making a lot of money. The way to make a lot of money quickly, as they are told, is trading with shorter deadlines – this is true, at least in theory. Traders realize that some currency pairs have lower spreads (such as EUR/USD) and think they should choose those low spread pairs to make trades and save costs. Another very common reasoning is that it makes sense to trade with currency pairs that are most active during the trader’s preferred trading hours. An additional argument says that each currency pair has its own “personality” and one must gain a lot of trading experience with few pairs to get to know their personalities, and thus make trades more successful.

These considerations are rational and true, at least to some extent. The problem is that they are far from being the most important consideration that should influence the choice of currency pairs for trades. I learned this a few years ago when I decided I would do full-time trades focusing on the EUR/USD and GBP/USD pairs. For several months, these two pairs barely moved, while USD/JPY took off like a rocket and provided easy money to anyone who made trades with it. Of course, I knew very well the personalities of EUR/USD and GBP/USD, I had a great strategy that had worked very well in these pairs for years, and their busiest hours fit precisely in the time zone of my geographical location. Despite all this, my linear thinking made me miss the only real trading opportunities of 2012, which came in pairs and crosses of JPY.

Factor #1 – To Decide Which Pair(s) To Make Trades With

So how should one decide with which currency pair or pairs to trade? I’m going to use an analogy with the gaming world to simplify the subject: Let’s say you go to a casino to play a game where you need other players to risk money at the table to give you the chance to make a profit, I mean, your profits will come from your losses. This is a good comparison with the Forex market, which works the same way. So, which table would you go to? The busiest, with more players and more money at the table, or a quiet one on The corner with just a couple of players? Normally, it would make more sense to choose the table with more players. So why trade in foreign exchange be different? What you want is to be doing trades with the “busiest” currencies at any given time, you want to be where the stock is. Is there any way to determine that? Well, you could try reading the financial news to spot the biggest things that are happening on the market at any time. There is a place for that, but there are easier ways that can tell you where to start focusing your search.

Although Forex trading does not have reliable centralized volume data, there are reliable statistics that tell us that currencies participate in more trades, that is, that currencies are exchanged in larger volumes. Most importantly, today, about 70% of all Forex trades are made between the US dollar, the euro, and the Japanese yen. The pound sterling and the Australian dollar represent a further 10 percent. The US dollar is by far the most dominant of all these currencies, so it is quite reasonable to focus on each of the other currencies against the US dollar. You don’t need to open the trading platform and worry about 80 pairs and crosses or wonder if the Canadian dollar/ Swiss franc is what you should include in your trades today. It’s almost certainly not, and if you ever hear someone telling you about a level of support or resistance in a couple of currencies like that, it’s good to ignore that person – no one is looking at that pair or their levels!

Reducing the Options

Now that you know it’s only worth looking at a few currency pairs, you’ll find it much easier to know which ones participate in trades any day. The method to be used to answer this question is to answer which of these currency pairs is likely to have the highest volatility? It needs volatility, because if the price doesn’t move, how is it going to make money? It is almost mandatory to buy and sell at the biggest price differences you can find, to receive the highest possible profits. There are some ways to predict where market volatility is likely to be, and if you apply the methods I describe below, you should get some good answers.

The first thing we need to find out is that by statistic, in the markets, volatility is “clustered”. Suppose that the average daily range of a currency pair is a movement of 1% of its value, taken over several days. Suddenly, one day it moves 3% of its value. Volatility clustering research conducted by data scientists like Benoit Mandelbrot tells us that this pair is likely to move by just over 1% tomorrow, most likely actually by about 3%. Therefore, when a currency pair is seen to move for more than its average volatility, that high volatility is more likely to continue to be reversed in the short term. Another method we can use is to calculate the average real range (ATR) of the last 5 or 10 days for GBP/USD, EUR/USD, and USD/JPY and to calculate these values as percentages of the price of each pair from the beginning of the period. Whoever has the greatest value, is probably the pair on which it makes sense to focus tomorrow.

Another crucial factor is the trend, or impulse (they are essentially the same thing). Major currencies, such as the US dollar, the euro, and the Japanese yen, have shown in recent years a greater likelihood of moving in the direction of their long-term trends. A good rule of thumb in trading major currency pairs is to ask is What is the lowest or highest price than 3 and 6 months ago? and make trades in most or in full in the same direction as any long-term movement, if any.

If you trade only in the course of Asian trading hours, you are likely to find that your best chances will involve Asian currencies such as the Japanese yen and the Australian dollar. It is advisable to consider whether one can develop a method to do trades on longer time horizons, as otherwise, one could be missing out on other opportunities while asleep, just as I missed out on opportunities in USD/JPY in 2012. If I had the wisdom to trade with the daily graphics at that time, I could have taken advantage of that great move in the Yen very easily, even at night while I was asleep, with the traders in Tokyo doing the heavy lifting for me!

Finally, if you look at an economic calendar to see when major central bank announcements or the most important economic data for major currencies are scheduled, you can see that if you are in a trade before those releases, They could give you the volatility that is necessary to transform your trade into a big winner, or at least show you where volatility is most likely to appear.

Therefore, it is good to limit one’s approach to major pairs and to make trades with currencies that show the greatest volatility, and see where are the greatest trends in the long run. This will give you the optimal opportunities to be profitable in Forex trading.

Categories
Forex Assets

Trading The JPY/HUF Forex Exotic Currency Pair

Introduction

In the JPY/HUF currency pair, JPY represents the currency of Japan. On the other hand, HUF is the Hungarian Forint. This currency pair represents the value of Hungarian Forints (quote currency) per Yen (base currency). This pair can be represented as 1 JPY per X HUF. For example, if the value of this currency pair is at 2.91 (CMP), then about 2.9 HUF is required to purchase one JPY.

JPY/HUF Specification

Spread

If we want to determine the spread, we should subtract the Bid price and the Ask price. Spread is a trading charge that the broker takes as soon as we open a trade. This value changes with the change of the execution model.

Spread on ECN: 13 pips | Spread on STP: 18 pips

Fees

Every broker takes a trading fee from a trader. The process of taking the fee is almost the same as every broker in the world. Note that the fee is only applicable to ECN accounts.

Slippage

Slippage happens when the execution price and open trade price are not the same. The volatility and the broker’s execution speed are the main cause of slippage.

Trading Range in JPYHUF

The trading range is the representation of the minimum, average, and maximum volatility of this pair on the 1H, 4H, 1D, 1W, and 1M timeframe. Using these values, we can assess our profit/loss margin of trade. Hence, this proves to be a helpful risk management tool for all types of traders.

Procedure to assess Pip Ranges

  1. Add the ATR indicator to your chart
  2. Set the period to 1
  3. Add a 200-period SMA to this indicator
  4. Shrink the chart so you can assess a large time period
  5. Select your desired timeframe
  6. Measure the floor level and set this value as the min
  7. Measure the level of the 200-period SMA and set this as the average
  8. Measure the peak levels and set this as Max.

JPYHUF Cost as a Percent of the Trading Range

With the volatility values from the above table, we can determine the chance of cost with the change of volatility. We have got the ratio between total cost and the volatility values and converted them into percentages.

ECN Model Account 

Spread = 13 | Slippage = 5 | Trading fee = 8

Total cost = Spread + Slippage + Trading Fee

= 13 + 5 + 8

Total cost = 26

STP Model Account

Spread = 18 | Slippage = 5 | Trading fee = 0

Total cost = Spread + Slippage + Trading Fee

= 18 + 5 + 0

Total cost = 23 

The Ideal way to trade the JPYHUF

As per the above data, we can say that JPYHUF is not an extremely volatile pair. Therefore, traders from every level can trade with it and make money. The average cost per trade in the H1 timeframe is at 41.86%, which decreases to almost 1% in a monthly timeframe. As a trader, it is often hard to trade in a timeframe like weekly or monthly, as it is very time-consuming. Therefore, sticking to the hourly to daily timeframe is recommended for traders to minimize the trading cost.

Another way to reduce the cost is to place orders as ‘limit’ and ‘stop’ instead of ‘market’ orders. In limit orders, slippage will not be in the calculation of the total costs. Therefore, in the below example, the total cost will be reduced by five pips.

Limit Model Account (STP Model Account)

Spread = 18 | Slippage = 0 | Trading fee = 0

Total cost = Spread + Slippage + Trading Fee

= 18 + 0 + 0

Total cost = 18

Categories
Beginners Forex Education Forex Assets

Master the Art of Spot Metals Trading With These Tips

Getting involved with precious metals trading is always a good idea. It is a great hedge against your forex risk-on positions. Long-term holding creates another safe haven benefit against investors’ greatest fears. Inherent precious metals value compensates for the inflation effect, political, terrorism, military or currency wars, pandemics, or economic downturn. Now, investors play the long game, the precious metal positions are held for a long time and they play a significant part of their portfolios.

Forex traders do not have long hold game ideas as their primary. Making profits with precious metals by holding for a long time requires patience measured in years, you never know when the crisis moment is going to come. Making profits right now requires active trading, the spot metals category is different than forex, traders need to be ready for another turn of testing and building. Going forward we will present one of the ways traders can utilize their knowledge and systems from forex, however, it is based on the system we have already described. 

Most of the technical analysis we have created using the algorithm structure from our previous articles is going to be translated into the metals market, therefore you should be familiar with it. Of course, the exact formula is not the same, there are some adjustments and additional analysis, but most of the elements are following the same concept. Trends are the core of the system and it is the core in precious metals trading too. If you just go and carry over the system you have made for forex, you will still have some success, although, additional odds might be missed and your balance can feel the effect. 

The biggest difference between the markets is the supply and demand forces. According to some prop traders’ opinion, the forex does not have real supply and demand, the central banks control the monetary politics and the mass levels. Nowadays it is common to read bank manipulation headlines and fines related, but they do not stop the activity and probably it is only the tip of the iceberg we see in the media. Manipulation is not the biggest issue actually, it is the fact supply and demand follow bank inputs, changing the balance in a very unpredictable manner. If you are trading forex successfully you might wonder why to bother with precious metals. Well, as our prop trader is suggesting, trading precious metals is easier, and there are often situations metals trading performance can outperform forex by far. In forex there are many currencies and combinations, in the spot metals market – you are trading 4 to 5 metals maximum. The differences are subtle still, we are going to focus on them and then go deeper into each of the metals specifics in the next series of articles. 

Most traders will focus on one market. It is a good idea to master one market, but often they do not go beyond. Whatsmore, sometimes they even stick to a few currency pairs, mostly majors. The self-limitation also translates into your diversification and your balance in the long term. Also, the system that works is never upgraded or used in other markets without a good reason. The system we write about is universal, you can trade both markets, with even more applications for other trading strategies. However, a limitation may come out from your broker asset range, not just from your trading mindset – which is harder to fix. Not all brokers offer four major metals – Gold, Silver, Platinum, and Palladium, the latter two are even rarer. In the United States, there are even more limitations. So you might need another broker leading you to open another account, and this is a good thing as our prop trader suggests. Diversification is created not just by trading in another asset category but with a different broker too. Remember though, trading with another broker should not be like trading with some other capital. It is still yours and you should treat your wealth as a whole, risk wise. Your position size and complete risk management will be like you are trading on one, major account. 

As for the leverage, prop traders recommend setting it to 1:20, buying power is not important since we are using optimal, long term risk management which does not need leverage too much. In the US, the leverage is limited to 1:1 since the 2007/08 recession aftermath act to cope with the leverage abuse in the future. The measure could have been more optimal, not just completely ban any leverage on precious metals. During the Trump mandate, he announced to cancel the act but as it seems this will not come true. Of course, there are ways to go around this measure for US citizens through Exchange Traded Funds products and other less known ways you need to discover alone. 

Trading metals can be against all the 8 majors if you have them offered by the broker. Markets.com allows them all and has one of the widest product offers in the industry. Rarely, you can also see spot Gold and other metals against the SGD and HKD. Interestingly, some prop traders advise trading spot metals against the USD only, for several reasons. If you are familiar with our articles describing the USD and how to approach trading with the pairs containing it, then you may wonder why trading metals against the USD is a better choice. Brokers that offer any other currencies are rare, XAU/EUR is probably the only other currency you will see metals paired with. Yet this is not a problem, the diversification is not at play here, when we compare the same metal against other currencies, the charts are not that different, especially on the daily timeframe we suggest. 

In the picture above we have compared XAU against some major currencies. There are no significant differences in price action. If we zoom in and compare the candles on the daily timeframe, the candles are almost the same. Even when we witness Trump’s tweets, speeches, and announcements among other events that shake the market, we should not be concerned with the currency expressing the value of the metal. Therefore, for simplicity reasons just stick with the USD unless you have a strategy that works on very low timeframes.  

As for the metals choosing, our prop traders recommend trading the major four metals mentioned. The symbols given for these assets are XAU for spot Gold, XAG for spot Silver, XPT for spot Platinum, and XPD for spot Palladium. Some brokers can even name them just “GOLD”, for example, and this usually means either CFD Gold futures or spot Gold against the USD. In the next few articles, each of the metals trading will be explained in detail. If you are wondering why Copper is left out, it is because it is a commodity metal with erratic movements. Copper is like a very exotic currency in forex, it can only be a good choice for traders into risky strategies. At the end of the day, you should not limit yourself if your back and forward testing show good results with this metal. Our long term testing results are not consistent enough to include Copper into our trading scope. 

Money management and the mindset required for metals is the same as in forex. If you have a sturdy money (risk) management set up with forex trading, carrying it over to metals is easy, just do everything the same. Adjusting the usual Take Profit and Stop Loss levels is always open, there are no hard rules here, in some cases Gold might have a tighter Stop Loss, but the risk profile should be the same as well as the methodology you have with forex trading. Note this is true for the money management fundamentals explained in our previous articles, however, even if you have your own, you do not need to change much. Elementaries such as Journaling, Backetsing methodology, leverage set up, are also applicable to metals trading, the only major difference is in the algorithm and some additional analysis. 

The transition is smooth for an established trader. These guys already know how the markets work, however, beginners might need a quick reminder about the supply and demand nature of different markets. Stocks have a limited number issued to the public, so equities respect the law of supply and demand, except for Indicies, they are a special story. Commodities also respect supply and demand. Cryptocurrencies are new and a kind of revolutionary twist on the scene without a strong market cap, yet they too respect the law of scarcity, which is also one of the core ideas of cryptocurrencies.

The forex market does not respect supply and demand, although traders that use support and resistance lines (many of them) would object. For more details, you can check our content on this topic too. Now, when we look at the asset we want to trade, the XAU/USD, for example, we see a mix of a currency and a precious metal. One has intrinsic value, the other one is paper or just a number but with the value stamp. One has the supply and demand naturally, fiat does not, therefore this asset cannot be traded as a currency pair nor as stocks. The difference is not great when we look at what we need to adjust but are significant when we talk about high percentage trading. 

This asset we want to trade, precious metal against fiat combo makes us wonder, who is driving the bus? In other words, which side is responsible for most of the asset price action? It is usually metal. The USD might take over if the metal is stagnating, like any other currency against it will, but metals do not stay in place too long. However, major events regarding the USD will shake the metals market and it will drive the bus. 

Trend following strategies is still the best way to trade according to research, including metals. Reversal strategies, however, are not that worse and you can incorporate one. Reversals may force you into higher drawdown and therefore, according to some professional traders, you should consider reducing the risk for them. Unlike forex trading, here traders can retain high percentage trading even with reversal strategies. But there is a difference between reversal strategies and some of them might not be what we classify as high percentage trading. If you like to call tops and bottoms using leading indicators, commonly presented with the overbought and oversold area oscillators, know you are not into a high percentage trading concept even if you have many other great tools incorporated.

Do not try to predict the future, trial has a price tag. Since reversals are in play, you may want to seek out reversal indicators if you do not have them right now in your algorithm. In that case, seek out newly made indicators, forget about the ones made in the previous decade or two. Chances are there are much better versions out there with more accurate and reliable signals. Of course, you can still tweak and adjust the good old RSI or Stochastic oscillator and still have results with the proper money management, just keep in mind there are new, better tools based on them. 

Regarding technical analysis, following the algorithm structure made by us will have some adjustments since reversals are now a viable trading strategy. To refresh, the algorithm has 6 elements, two trend confirmation indicators, a baseline, an exit indicator, a volume or volatility indicator, and the ATR indicator for our position sizing and SL/TP placement. This algorithm is purely for trend following and to make it a reversal too we need to get rid of the baseline element. Consequently, the ATR measurement off the baseline does not factor in anymore.

Additionally, every direction is tradeable, up and down, they are not filtered by the baseline rule. So, now we even have more trading signals. However, there is more we need to change. Trading forex is different, metals move in their own way and therefore we might need to change our confirmation and exit indicators. This change is not obligatory, some indicators can work on the precious metals market and forex without any quirks. But if you find unsatisfactory performance, be sure to change these first. To give you some comparison, the results from trading 4 metals should be on par or better from trading 28 currency pairs. 

Price volatility in metals is not the same as with currencies of course. Precious metals like to move, their ATR values are much higher. Knowing our money management plan, we adapt everything to volatility or ATR. There is nothing bad with this, on contrary, you will enjoy dramatic trends that happen with metals often. Palladium has a specially high ATR so traders should know to adjust the size of their positions accordingly, on a demo account first. The calculus should not be difficult, there are even some useful MT4 plugins that calculate the sizes automatically once the ATR value is typed in. With higher ATR one can expect higher spreads too. If we measure the spread importance in the ATR, their ratio, the spreads again, like in forex, become insignificant for our daily timeframe trading. These kinds of traders should never be concerned about spreads unless they are with some exotic (bad) broker. For some reference, the spread part in the ratio is about 1% for Gold and about 7% for Platinum according to our measurements. If you trade on a few levels lower timeframes, the spread is a factor, do your calculus on how big the spread influences your trade. 

Precious metals have such good momentums the volume indicator might lag too many times and cause you to miss more good trades that it filters the bad ones. Of course, this depends on the volume or volatility indicator used but they all lag more or less. As our prop trader says, he noted his trading had to change from this result and decided to update some trading rules. Namely, whenever a metal resumed the momentum in an already established trend, he would take a trade immediately on the confirmation indicator signals, even if his volume indicator does not agree. Still, for reversals, volume indicators play their role as usual. If you need an indicator to gauge the major trend direction, use some moving average or your baseline. Just know this is just one observation, the rule does not have to apply to you.

Sentiment indicators play a lesser role in precious metals. The ratios do not mean much and traders should not chase any signal interpretations from sentiments. Looking at the sentiments and the price action we can easily discern the difference from forex currency pairs. Change in the sentiments does not cause any particular price action with the metal. Of course, there are extremes, for example, XAG/USD at one point had 21 traders long for every 1 short, something like 97% traders long on this asset. There is little room for anyone else to go long. In these rare scenarios get ready for long trades, the ratio can only correct causing the already known contrarian trader idea to buy. The big bank manipulation is not that present with metals, but you can expect some degree of it, especially during very important events. So now you might wonder what events can cause metals to shift.

News rarely has any effect on the metals. Note though, according to statistics, interest rate decisions on the USD can affect metals too. Comparing the XAU/USD and the EUR/USD, interest rate change in the USD will likely cause traders to flock to the XAU since the EUR rates are extremely low too, especially at the time of writing this article. Gold simply offers protection and better-estimated income than interest rates with some safe-haven currency. Non-Farm Payroll event also does not have any significant effect on the charts. Additional caution has to be on the elections. Any market will go crazy during the US elections, prop traders usually like to avoid the risk associated with them and close all positions until all is normal again. 

Be advised that precious metals trading hours are mostly different than with forex or crypto – which is always open. The hours also depend on the broker, usually, precious metals have one hour off longer than forex, and every working day they have 1-hour break around session closing. All this should be known to you when you start trading. The specification window in MT4/5 should have this information for every product offered or you can consult your broker support. 

To conclude, do not limit to the forex market only, you have a universal system, use the opportunities everywhere. But know there are differences you need to recognize and adjust to, as with everything else. The differences are subtle but adjustments get better probability trades, even 1% better odds make a large % on the ending year balance. Find a broker with a good metals range and check the conditions. Lastly, trade your system and stay out of the way, test the plan, the upgrades to it, and apply, nothing more. 

Categories
Forex Assets Forex Basic Strategies

Key Strategies the Pros Use For Profitable Gold Trading

Trading and investing in Gold is one of the top searches on the internet and a hot skill that could be the best thing to develop nowadays. As one of the four precious metals usually offered for trading by brokers, gold is the most popular, most traded and historically the most valuable asset one can have in an economic downturn. Forex traders are in a very good position to grasp the advantages of precious metals trading, the small differences are easily adopted, the principles are the same.

Trend following is still the best approach, yet metals also offer opportunities for other trading combinations such as reversals. Before we move onto the actual gold differences, beginner traders should be familiar with the system structure and trading we apply in the metals assets category, using what we have mastered in the forex. The article in front of you will firstly digest gold fundamentals, trading requires some fundamental basics about this metal even though we are using mostly technical analysis systems. There is uniqueness for each of the 4 metals we are going to analyze.

XAU is the symbol mostly found on the brokers’ asset list for gold, the X stands for index or spot market and AU is the symbol from the periodic table of elements. In the asset contract, it is expressed in troy ounces which is slightly different from standard ounces. One standard contract holds 100 Oz and the chart price is for one Oz. 

Gold is not used in production very much when compared to other metals, only 10% of the total gold extracted is used for various jewelry and electronics. So the demand for gold from the industry is not the main driver for its price, even though electronic devices are making a breakthrough in everyday lifestyle. The main drivers come from safety, hedging, and investment needs. Countries also use it for the same purpose except the amounts are measured in tons, Russia, and China currently being the biggest hoarders of this metal. Rich people also have this habit to collect gold in various forms but a part of them do not use it primarily for investment. 

The image above is the supply of gold including a few years of prediction at this rate. Now, according to a certain group of prop traders, this is contrary to their expectations. They think millennials had new know-how and technology to boost production in the coming years, including better technology to find new deposits. The chart accounts for this phenomenon although the decline is still evident. This information has a huge bullish prospect for gold. The chart implies humanity can bring whatever technology they can to extract gold but unless it is dramatically effective in a short time it is not going to cut the price in a few years or compensate for the fact most of the gold is already extracted.

The chart is not implying anything related to world economic cycles, pandemics, or crises, making it easy for youngsters and traders to realize gold is the ultimate protection and savings solution. To some theories, China and Russia’s gold accumulation can bring the power balance to shift very quickly towards them. They do not have to strategize with trade wars, politics, military actions, all they have to do is gather the power out of gold holdings and wait out the west fiat influence to slowly fade out. Cryptocurrencies are also into play with this theory some might call crazy, but the effect is very close to being clear in a few years. 

Investment wise, the gold price cannot go down to zero for sure, we can only witness some short term falls unless a miracle economy recovery or a golden mountain is discovered. When we look at the supply, long-term investment is logical but the demand is increasing too. Aside from the governments across the globe hoarding gold, the population is also very interested in physical gold holding. If you are well informed about the economic cycles, we are well past the peak and into the downturn, however, if you look at the equities indexes, there is no evident downturn. This could mean the crash is going to get more dramatic and gold will be one of the first assets masses will flock to. 

XAU/USD and the USD Index can both move up as safe-haven assets but explains gold is in charge of the move, not the USD in the XAU/USD pair. When the metal has a reason to move it does not matter how strong is the currency denominating it. Investors, funds, and other major players will stock up gold reserves early in this trend, you will probably see signs like higher gold premiums, price action volatility, VIX, and $EVZ pick up, and others that a crisis is around the corner. Simply when things go bad, gold is the only asset people see as valuable, it has been like this for centuries. Essentially this is what investors do, when the world burns they hold the gold, and once recovery is in sight, cash in the gold and buy risk-off assets cheaply. Once another cycle downturn emerges, repeat. It is true these individuals make riches in such times. 

Now into the technical specs of XAU. Gold moves in smooth trends. Smooth trends trigger technical algorithms signals early in the trend and trades see a followthrough. On a daily timeframe (we like to use) this is especially true. In forex, it is common to have step-trends, the kind that triggers the signal to trade on one candle and then a period of flat price action and then another step candle. Choppy trends like this are hard to follow, and they are happening even on slower systems just with a few candles more as steps. Compare the XAU pairs with forex, the charts show smooth transitions most systems can pick up easily. Whatsmore, gold also exhibits smoother price action than other precious metals. All precious metals have this characteristic but gold is a special case. Because of this, our trading systems can have tighter Stop Loss levels relative to the initial position.

The trend will in most cases continue on its way up or down, it does not need some correction room as with forex where we have to leave some space so it does not trigger our Stop Loss too soon in an emerging trend. If we take our algorithm money management plan of 1.5 ATR Stop Loss from the entry price level, we can cut it to 1.35 ATR. The 2% risk profile is still on, just in metals trading we distribute the risk capital onto 1.35 ATR pip range. Metals do not leave traces of bank manipulation effect, there are still some but the effect is very small and the frequency is lower. Therefore, whipsaws do not happen often because of this, it is more likely the metal is changing course. 

Interestingly, gold with its smooth, somewhat predictable moves is easy to trade and we can also apply riskier strategies, like reversals…until Trump became president. Unfortunately gold is not immune to Trump’s tweets, speeches, and announcements. Gold is the fear metal, a panic buy button. One day a tweet may be about a trade war with China and one day after a positive outlook about a good deal with China. Banks can use the news as they see fit for short term USD manipulation, the price of gold will rocket as fears creep in, and when everybody goes “whew” it goes back down. These events will trigger your Stop Loss even if you see everything going smoothly. There is no defense against Trump’s tweets as we have explained in our previous article about them. Of course, you can avoid this inherent risk by waiting out his mandate but trends are still much better with gold than with forex, especially the USD currency pairs.

Prop traders adjust to this by bringing the Stop Loss level further away, like in forex to 1.5 ATR, but ultimately it is up to you if you want to avoid or adjust the risk profile. Since the new US presidential election is coming soon, hopefully, new traders will not have to deal with this. China’s trade war may not be a focal news point as pandemic cut down countries GDP measured in two-digit percentages, but the west tries to slow down the China extreme takeover in the global economic dominance. As a trader, you can expect more risks coming from this issue regardless of who will be the new US president. 

To wrap all up, know the asset you are trading, the fundamental drivers. Gold respects the supply and demand as all precious metals but the upcoming trends, statistics, and results show holding gold is almost a certain win. Contrary to forex, knowledge about the swissy background will not help you much for technical trading as gold can. Risk related to gold is reduced by its price action nature although know things masses react to, like the Trump tweets, can mess your trades. Gold is gathering the fears and as such you will need to know fundamental drivers. Adjust your risk accordingly and enjoy smooth gold trends.

Categories
Forex Assets

Coronavirus: What are the Best Pairs to Trade Heading into 2021?

At the moment of writing this article, we see a lot of turbulence involving the COVID-19 mixed in with the dramatic US elections aftermath. The pandemic presents a unique environment, one which cannot be categorized into a recession cycle or anything we have experienced before. We see the first large scale pandemic in modern history. Does this mean some assets are going to be better performing?

It is hard to predict future movements, you can ask any serious investor such a question. They are bombarded with them and what most say is that they do not know. But they can rely on some data that points to some expectations. It’s logical to see certain commodities and precious metals tied to economic activity level, still, it is not known exactly when oil is going to spike with the activity coming back to normal. Nor we may expect the same spike will happen with metals related to industrial activity. Entering any reversal trade based on a hunch is a great way to lose, but we can stay in certain safe heavens until it is time to slowly go into risk-off assets after clear indications the worst is over. 

Let’s see what happened since March, once the pandemic went viral and global. We will first analyze risk-off currencies such as NZD, CAD, AUD, then the neutrals, GBP, EUR, and lastly safe heavens USD, JPY, and CHF.  The NZD did not endure any special selloff. According to the picture below which represents the NZD basket against other major pairs, we see the exact opposite. Is this because New Zealand fared well in the fight against the pandemic than other countries? Unlikely. The correlation between the COVID-19 patient numbers and the currency directions is random in most countries, therefore trading based on these statistics is a bad idea.

The AUD followed a strong positive correlation with the equities or indexes. It is almost copied price action. The vertical red line marks the March pandemic breakout. Before the breakout, AUD was in a downtrend that looks like it just amplified a bit before it went long again. This price action seems it does not care about the pandemic at all. If we want to pick a currency to trade in 2021, COVID-19 impact on a single economy should not be our criteria. However, some other assets as mentioned above are directly affected. 

Canadian Dollar is considered correlated to oil. Most of the informed traders know about the oil price shock once the pandemic forced lockdowns in most of the world, especially developed economies, except China. From the CAD basket chart below, we see extreme whipsaws and price action that spells trouble for trend followers. We cannot say this chart is positively correlated to oil, we also do not see a small correction as with oil. How price action is going to look like in 2021 based on this info is completely unknown. At this point, CAD seems to be the worst currency to trade unless you have some special range-effective strategy.

So what we see in risk-on currencies is that AUD and NZD do not care about COVID-19 but are somewhat in-line with indexes. NZD is not the same copy, although it tends to move like the AUD. New Zealand was one of the best countries to cope with the pandemic, but this is not the criteria you should rely on. One should know Australasia currencies are very tied to China’s economy, a country that seems to know how to control the spread of this virus. However, China relies on export and inevitably depends on importers such as the USA and EU. 

Great Britain Pound has a lot of major fundamentals affecting its economy. Brexit, internal political struggles, COVID-19, and discouraging economic indications. GBP price action chart shows a strong bearish move than almost as strong pullback after the pandemic had started getting global. Chart analysts will easily spot three strong support points after the initial shock. Similarly to the CAD, GBP is extremely unpredictable by any means, probably only partially good for range-bound trading strategies. 

Euro and GBP seem to be in the same boat. EU countries took catastrophic hits to their economy and health systems. Has this affected the EUR? It is, but not in a negative way. By looking at the price action below, we see a strong uptrend after the pandemic start and then calm consolidation that lasts for months. Is the EUR the best currency to trade with? Depending on your strategy, range-bound reversals with channel indicators are probably the best way to go here, pairing the EUR with another ranging currency such as the GBP. In 2021 it is hard to predict what will happen to the Eurozone, but for now, it seems not much can shake this market. 

Swissy is copying the EUR. According to the price action below it is not behaving as the safe-haven currency, more like the EUR clone. Does it mean it lost its reputation? Unlikely, it just means it is not a safe haven in situations when the whole world shuts down. Similar to the above range-bound currencies, it is not a good pick for trend following strategies. 

JPY is not regarded as a safe haven apparently once COVID-19 went global and serious. It is just more volatile than the CHF but after the 2020 US elections and the recent vaccine announcement, it is testing its major support level before the pandemic. It is yet to see if this is just another spike before the real economic downturn is about to start.

Finally, the USD went sharply up but investors soon realized the US economy does not have that safe haven characteristic, what’s more, the pandemic has a strong impact on the ideals of this country, pushing the USD down more than any other currency. 

All this can provide us with some results which are the best pairs to trade until now during the COVID-19 since March 2020. The biggest difference index or pairs that moved the most are AUD/USD, NZD/USD, AUD/JPY, NZD/JPY, and to a lesser extent EUR/USD and GBP/AUD. Therefore, these pairs are the best for trend followers. Range bound strategies would probably like EUR/CHF, EUR/CAD, CAD/CHF, and AUD/NZD. Is the same going to continue in 2021? If vaccines prove to be effective we can probably see risk on sentiment again, however, the pandemic might have pushed the economic cycle off the cliff, causing another economic crisis on steroids.

Recently, after the US elections, we have witnessed interesting events. Pfizer and its partner, BioNTech announced the vaccine after the US elections, spiking equities up. Gold went sharply down back to the pandemic showup rally support. Gold futures experienced a single day decline not seen in seven years. However, some assets enjoy a real safe-haven personality – cryptocurrencies. Bitcoin is back to $15k levels at the moment of writing of this article, resembling the famous rally from 2017. So, gold is not really going to be a pick for 2021 unless we are into recession, Bitcoin on the other hand is on a good track to be both, pandemic safe heaven and also a recession safe haven.

Cryptocurrencies are volatile and require adapted strategies to trade. They are still considered risky assets and should be only traded with also good risk management. If we had to pick an asset to trade, it would not be currencies unless we see the end of the pandemic. In that case, going back to risk-on currencies seems a reasonable choice. If an economic downturn is about later, it is going to be global so precious metals and crypto could be the right choice.

Categories
Forex Assets Forex Basic Strategies

Silver Trading Doesn’t Have to Be Difficult – Check Out These Tips…

Dominant gold association with wealth and security is going to be even more hyped after the next economic downturn most economists expect to be more dramatic than what we have used to see in the last two decades. Also, cryptocurrency is another market type, Bitcoin also gets perceived characteristics of precious metals by people, even though they are very different in many ways. It comes down to what we perceive as valuable, but we will not go into theories just to pin down silver is more scarce than gold, contrary to what most people think.

Before we move on to XAG/USD trading, readers need to understand the basics of Supply and Demand forces, general characteristics of precious metals, and also know what we do with gold trading. All of these topics are already covered before. Similar to gold, silver carries the inherent value property, it was also exchangeable for silver dollar banknotes before the gold standard abandonment and is traded on the markets worldwide. If we go deeper into silver fundamentals, similarities stop. Traders that follow a procedure will explore forex trading the right way, the same applies to meals trading. This is why we start with the fundamentals even though currencies’ knowledge alone will not get you to the prop trader level. 

Silver is a less popular trading asset than gold and therefore you will have a harder time finding a broker that offers XAG/EUR, XAG/JPY, or any other currency against silver except the USD. Although, like with spot gold trading, this will not be an issue. Liquidity is lower though it is good enough to retain trading conditions we like to have, with a few trading drawbacks in the technical area. 

Bitcoin and Litecoin comparison can be like gold and silver if we compare their fundamental similarities. Obviously one is worth less than the other and they also move in tandem, in a positive price action correlation. Silver is considered to be a more risky asset than gold, however, opportunities or possible gains are higher than with gold. According to some professional traders’ opinion, the silver upside is larger in proportion to the risk. This opinion is based on technical and fundamental analysis and experience that puts silver in a special basket. Let’s first start with the fundamentals.

Silver has about 3.5 billion troy ounces available right now when we count all holders, total supply. Roughly estimated, it is about half an ounce per person. Now, the demand is certainly made more aggressive when you have some people having more than others, it creates scarcity which can be a primary driver for the bullish sentiment. Interestingly, silver is more scarce than gold which has 6 billion ounces in total supply, but gold is more expensive, trading around $1900 per Oz right before the 2020 US presidential elections. Amateur investors will probably just take gold anytime before silver, yet the scarcity of silver might get on top of the gold bullish sentiment according to plain fundamental numbers.

If you remember the article about increasing the odds in your favor, by accounting for the scarcity of silver and the fact it is a lot cheaper than gold, it is easy to understand silver is a better prospect for the average investor. On top of this supply scarcity, know silver is used in production a lot more than gold. To be more precise, 50% of it is used for various industrial needs, not just jewelry and silverware. The latter is not consumed, it still has the same weight while in production it is consumed and hard to recycle again. Silver is used in batteries, nuclear tech, medicine, solar panels, and electric cars all of which are getting exponentially popular nowadays. One more argument for the silver future value jump is the fact the supply is getting lower too. 

Traders and investors still need to pay attention here, just because the scarcity and demand are increasing it does not mean it will necessarily increase the silver value in an economic downturn. A bearish argument comes from the fact a big part of the silver industry consumers will bust or cease production when a large scale crisis emerges. Central banks seem not to care about silver, according to statistics, their supply is getting lower sharply after the gold standard abandonment.

Governments do not want silver and do not have a long-term investment plan with it most likely because silver value concentration is not as high as gold. Contrary to this, silver holdings with individual investors are booming.

So people want silver as well in their portfolio and this is what matters for traders that come from forex. The chart above does not show the last 2019 result but it was pretty high after the India craze for silver. If the demand is going higher and the supply is the same or getting lower it is easy to conclude a bullish silver outlook. In our previous article, you could see the gold supply is starting to go down and expected to do so sharply in the next few years, even with the new technology around. That chart has a projection that it will go down but silver is already in a downtrend.

Now the world silver mine production chart above displays what they produce, the silver ore. The ore does not have the same quality as when the mine was new, it has a lower yield. This yield chart is very bullish for silver. 

So the mines have peaked in production and the ore is getting diluted and now even the production is down trending. These fundamental charts are the unpopular backstage few traders want to see. It is good to know this if we want to invest long term, however, for daily traders, it may just mean a bit bigger positions on the long silver positions. 

All points traders should apply to buy and hold strategies explained in our previous article, now when silver is booming and is not as expensive as gold, you can buy more of it. The potential upside is even more amplified compared to gold. Gold runup from the low to high pivot point for the last decade is about 768%. Silver for that exact period went 1147%. Last year, during the summer of 2019, silver run outperformed gold by two times. So to some basic upside/downside assessment, this might be a good point to hold silver instead. Throughout history, silver mostly outperformed gold when big correlated trends occur and it is likely silver will do it again for the coming downturn, which is going to be amplified because of the COVID-19 implications. Of course, an even better proposition is to diversify and hold both, precious metals are a hedge against everything, when all goes south you will get richer. 

From a technical analysis standpoint, silver is different too when we get into the details. Firstly, the ATR is different, and it is logical since silver is much cheaper per ounce than the other precious metals (copper is a commodity metal). On a daily chart, silver is also more volatile, candle wicks are longer, and this is not what we want to see. Conditions like this need to be tamed with different risk management levels than for forex and gold – for which the daily chart is mostly smooth. Silver moves in tandem with gold, they do correlate to some extent although the application of this info is not a good trading proposition. Simply, correlation trades are hard to realize, this correlation between assets may serve as additional info but not a dominant decision-making point. You will always find a moment when they look correlated and then when they are not, but make similarly looking charts. 

Positive gold – silver correlation can commonly produce signals from the same system on both assets. The daily chart we like to use is especially prone to have tandem signals. If silver is a bit riskier asset and you have a signal to trade but not quite yet on the gold, you might be asking if the wait for the gold signal tomorrow is a good choice. Not all brokers will provide the same price chart, they should be almost identical yet different liquidity providers and broker setups might cause some differences. This difference should not be an issue when we use the same system with different brokers. In some instances, you may have one set of winners and losers and different entry points with others, however, at the end of the day, the bottom line is the same. Some brokers also have 3 digits quotes after the comma so your ATR value is also one digit too long. Mostly it is like with the JPY pairs with two decimals. Silver charts have wicks and tails you may associate with stop loss hunting. Well, silver moves like this, it is not manipulation, just the nature of silver movements. 

Back to the trading decision question. When you have signals on both gold and silver at the same time, platinum and palladium are unlikely to follow, and this is good, you can trade and have better diversification in the metals category. Trade both gold and silver in this situation, but split the risk you normally take. We trade 2% per position with a 50% scale-out at 1xATR range, but you can use whatever structure you like. If gold is the first to produce a signal yet silver is about to come second tomorrow, just go on full risk with the gold. You do not have crazy price action with gold and less likely to be stopped out by the wick. Lastly, when you have a silver signal while gold is probably triggering the entry signal tomorrow at the next candle, our prop trader group suggest to split the risk once again and wait for the gold and get in with the other half. This is the plan of how we manage silver movement risk, with a simple position size cut. According to the prop trader’s experience, when you get that first signal on silver, this metal’s volatility can trigger take profit even though both trends reversed, ending with one loss and one small win. All these suggestions are just a personal preference, so traders can use it as they see fit, make their own rule. Whatever plan you set up, do not keep changing things. You will not know it works or not if you keep changing, so stay consistent. 

To close this article, know the future of this metal and that long-term holding it is a good idea as with gold. The stats presented here strongly confirm the opportunities are almost guaranteed. When we trade silver, adapt to its movements, volatility, and understand the correlation with gold. Lastly, you may use other indicators for metals than in forex but know what to do when you have tandem signals to enter and stick to the plan. A quick reminder, 4 precious metals trading is likely going to be at least as good as trading forex 28 major pairs and crosses, but with additional benefits of long term buy and hold strategies you can combine. 

Categories
Forex Assets

Analysing The Costs Involved While Trading The AUD/MXN Exotic Pair

Introduction

In this exotic forex pair, the AUD represents the Australian dollar, while the MXN – the Mexican Peso. Exotic currency pairs have higher volatility in the forex market when compared to the other major pairs. Here, AUD is the base currency, where MXN is the quote currency. It means that the AUD/MXN exchange rate shows the amount that 1 AUD can buy in terms of MXN. Let’s say that the exchange rate for the AUD/MXN is 15.0346; it means that 1 AUD can be exchanged for 15.0346 MXN.

AUD/HUF Specification

Spread

When you go long in the forex market, you buy the currency pair from your broker at a higher price than when you sell it. The spread in forex is the difference between these two. The spread for the AUD/MXN pair is – ECN: 2 pips | STP: 7 pips

Fees

Some forex brokers charge a commission for every trade on ECN type accounts, depending on the value of the trade. STP accounts do not incur any trading fees.

Slippage

Sometimes when you place a market order, your broker will fill it in with a different price. This is slippage in forex trading; it is caused by increased volatility and the speed at which your broker executes the trade.

Trading Range in the AUD/MXN Pair

The trading range analyzes the spread between the highest and the lowest price movements across multiple timeframes. The trading range analysis ranges from the minimum, average, to the maximum volatility across all timeframes. It is used to assess the potential profitability of a currency pair across all timeframes.

The Procedure to assess Pip Ranges

  1. Add the ATR indicator to your chart
  2. Set the period to 1
  3. Add a 200-period SMA to this indicator
  4. Shrink the chart so you can determine a larger period
  5. Select your desired timeframe
  6. Measure the floor level and set this value as the min
  7. Measure the level of the 200-period SMA and set this as the average
  8. Measure the peak levels and set this as Max.

AUD/MXN Cost as a Percentage of the Trading Range

Further analysis of profitability can be aided by analyzing the percentage of the total cost to the volatility. These costs are put in terms of percentages of the volatility on all timeframes.

ECN Model Account costs

Spread = 2 | Slippage = 2 | Trading fee = 1 | Total cost = 5

STP Model Account

Spread = 7 | Slippage = 2 | Trading fee = 0 | Total cost = 9

The Ideal Timeframe to Trade  AUD/MXN Pair

For the AUD/MXN pair, the ideal trading timeframe appears to be the longer timeframes since trading costs are at their lowest here. We notice that the trading costs for the AUD/MXN pair decrease as the timeframes become longer. Also, note that at longer timeframes, the volatility is higher.

For traders wishing to trade the AUD/MXN pair for the shorter-term, timing their trades with when the volatility increases towards the maximum can help. More so, adopting the use of forex limit orders will lower the trading costs by ensuring there are no slippages.

ECN Account Using Limit Model Account

Total cost = Slippage + Spread + Trading fee = 0 + 2 + 1 = 3

Notice how using the forex limit order types reduces the overall trading costs across all timeframes. The maximum trading cost of the AUD/MXN pair, for instance, decreased from 84.75% of the trading range to 50.85%.

Categories
Forex Assets Forex Basic Strategies

Embarrassed By Your Index Trading Skills? Here’s What To Do…

Indexes are popular as they represent the economic activity in certain areas. Therefore it is often the case to see a company stock move inline with the index it belongs to. Some traders turn to trade only indexes instead, it is easier to conduct fundamental analysis based on aggregated performance than to follow what a single company is doing – unless a trader is very familiar with its capital structure, reports, and its services or products.

German traders are very interested in trading their DAX index, what’s more, they are very informed about their economy and even beginner traders have a good knowledge base to start trading the DAX right away. Following our previous series of articles about carrying over our forex trading experience and systems to other markets, this article will be about what we need to adjust to being as good in the index asset category. We will present just some opinions from professional prop traders, following the algorithm structure and ruleset already described before. If you have a system already with good results in forex, there is no reason not to transfer that knowledge and the system to seize opportunities from other markets.

Since each asset category has specialties, indexes require attention to several market aspects, additional work is also a lot of testing. By exploring other markets from forex, the overall capital gain potential is increased to a big extent, just by having 10% from forex, 10 from precious metals, 2% from commodities trading, and an additional 10% from indexes make a difference. Of course, mastering one market before moving to another is the right approach, although people are not prone to get out of the comfort zone. The percentages above are for an average trader who has a proven system and a plan set in place already, it is not an elite benchmark, but it is an elite gain all combined. To compare, elite traders and investors have a 15% return from one market per year, consistently.

Do not be impressed by an expert advisor or signals provider with their presented unrealistic returns as it is almost always extremely high to attract your attention only. After we address the fundamental peculiarities, we will make adjustments to our algorithm or technical analysis.

Trading indexes for individual traders is done through the CFDs. These contracts allowed great freedom in terms of what we can trade, be it precious metals futures, commodities, or indexes. Long and short positions are possible even with stocks over the CFDs. Now, CFDs have leverage and therefore margin, allowing traders to have bigger buying power than what is otherwise possible. Leverage also amplifies the amount traders can lose, going beyond zero. In classic buy and holding strategies, you can lose all of your investment value only if that asset goes to zero, which is not likely, nearly impossible for precious metals. Using CFDs, depending on leverage amount, you can lose all investments if the asset falls in value, even if it is just a 10-15% drop. Money management we carry over from forex will make your trading completely protected from this risk since we are very strict on how much we allocate for each position. Traders should first understand CFD type financial instruments before trading, they bring certain benefits and increased risks compared to traditional stock trading. 

Indexes you are about to trade are volatile compared to forex. Their daily ATR (14) value is very high, much higher than precious metals, and could go to 13000 pips. Consequently, you will also find trading indexes require more capital. The usual amount in your demo account such as 50.000 USD may not be enough, contracts are not the same size as well as the price per one unit. Also, note trading indices carry an increased risk of unexpected trade “glitches”, and by this we mean your positions could be closed by broker adjustments to their products. Such changes are usually announced by email and they are mostly about indices from certain countries where elections or other events are expected to heavily affect their equities market.

Brokers can change the terms during these times as they see fit, mostly it is just the leverage reduction, although, they can completely close the assets from trading. If you happen to have a position in such assets, they are likely to be forcibly closed. Sudden spread widening is also an issue with volatile assets such as indexes, if the volatility spike is extreme it could trigger your Stop Loss levels even though they are properly set in line with your trading plan. Therefore, demo trading for a longer period is a must. 

Indexes price action is very active, you will have a lot of signals and you can even be thrilled how good you are. If you are lured into real money trading with indexes before forward testing your system for a few months, it could cost you. Backtesting will take more effort than with other assets, there will be plenty of signals to mark and measure, and they all have to be compared. Every time you make adjustments, be it another indicator or money management rule, collecting results and comparing them will be the biggest part of your job. Forward testing will discover new issues such as above mentioned volatility spikes and spreads that may cause your successful backtested system to perform much worse in real-time. When this happens, be ready to make a new plan or elements to cut the losers first, then think about pushing for more winning signals without compromise. 

CFDs are somewhat restricted to US citizens. Alternatives to this limitation exist, one of them is trading ETFs instead. There are inverse ETFs that allow shorting whenever you are actually in a long trade, and for certain ETFs, you even have 1:3 leverage. So Exchange Trade Funds are more than enough substitute to CFDs, however, you will need to do research about them, they have specifics we are going to talk about in another article. 

Now let’s get into the technical adjustments and setup for indexes according to technical prop traders’ recommendations. Firstly, you may notice correlations between the markets or indexes. If you are familiar with our opinion about correlations from articles about precious metals and forex trading, indexes are not much different. Correlation comes and goes without any clue why. Let’s take a look at the charts below, the daily timeframe shows very correlated movements between different indexes. 

The S&P 500 (sky blue line) has exaggerated price action in this whole year outlook compared with the rest of the most popular indexes. Nikkei also has somewhat uncorrelated moves in certain places but overall positively correlated with the rest. Now, take a look at the weekly timeframe. 

The zoomed out decade period shows completely different charts. At some points, we see a correlation, and then it is gone. Nikkei 225 (yellow line) is drastically different but all come into positive correlation during the COVID-19. 

Nikkei 225 remains flat on this latest 2020 weekly time frame chart, even with a mild bullish sentiment in the last two months while S&P 500, DAX, and Dow Jones Industrial are starting to slope down. It is hard to use any correlation info to the actual trading, it is not consistent and traders know consistency is a must. Some might notice a tighter correlation between US-based indexes since they are measured in the same country. The most uncorrelated index is the Nikkei 225. Now, similarly to precious metals trading, you do not need to trade various indexes for diversification purposes, it is redundant as indexes can move in and out of sync. It is recommended to trade only two indexes, regardless if there is a correlation or not. As our prop traders say, less is more in this case, you do not get any special advantage by having positions in more than two. If you have a signal on two indexes, one from the US and the other from the EU, trade them both only if they are not correlated on a daily chart. If they are correlated, trade the one with smoother price action. By comparing the DAX and CAC you can notice DAX is more smooth, so it is an easy choice. 

Note indexes have different uptime, they close at different times too. So the daily chart, the easy-going trading routine only at the session end could be a bit shaken if you expand to trade indexes. Your trading routine would also need some adjustment if your lifestyle allows it. Know you will be in constant action, indexes move all the time because traders, institutions, and investors need to be active, their jobs demand it and their investors require gains. 

If you keep your trading scope to 4 indexes, 2 from the US and 2 from the EU, you may want to explore Asian markets, the Hang Seng index. This Hong Kong (HK50) index has very attractive price action for trend traders that developed systems according to our recommendations and structure. HK50 rarely has flat periods for more than a few days. HK 50 has many fundamental drivers and still, apart from elections events, you can ignore them all! If you stick to the daily and higher timeframes, just do what your system tells you, no need to look at the event calendars. Non-Farm payroll might affect an index from the US, but the trend will prevail with only one or two candles in the correction way after the event. Indexes have such drivers they do not react too much and the memory does not hold for long. 

On top of the HK50, you may go even further to the Australian index, also symbolized as AUS200 or ASX 200. This index has its specific price action and this is a good thing. It is not moving as the US and the EU indexes, therefore you can also pick one from other geographic markets. India 50 is another example of alternative markets you can trade when you need something uncorrelated. Just know the ATR values with these are extreme, in one day you can find candles that moved 7000 pips in one day. Make sure your money management is sound before trying. Some brokers do not offer less popular indexes so you may not find Taiwan MSCI and other alternatives. Make sure you find a good combination and limit your scope, keep it simple. Pick 3 or 4 different indexes, a couple from the US and EU, and one or two from Asia or Oceania. 

Finally, let’s see what you need to change with your technical algorithm. It should have 6 components as we have discussed before. Indexes move relentlessly, therefore the volume indicator is not needed here. Even when there is no general direction, it is short-lived. Choppy price action like with certain currency pairs is not going to be present with indexes, expect a lot of strong trends. As a result, you do not need any volume measures, trade indexes like you would Oil. To remind you, implement adequate confirmation indicators to indexes, as well as exit indicators, and eliminate the baseline element too. What you end up having is two confirmation indicators and one exit adequate for indexes, ATR (14) indicator if you need to calculate position sizes, Stop Loss and Take profit levels, nothing else. 

In conclusion, indexes are up for grabs since you know about forex trading. Carrying over that trading style to other markets is an easy process, yet you still have to do a lot of testing. The exact recommended levels for risk management can be modified if you feel you would have better results otherwise, make sure you know what you are doing, ATR values are extremely high here. If you are from the US, know there are many ways you can trade Indexes even if you do not have access to CFDs. Lastly, know you are going to apply your trading knowledge and quickly master new markets with it. You have a higher goal now and that is to add on consistent returns wherever you can, be it forex, precious metals, oil, or indexes.

Categories
Forex Assets Forex Basic Strategies

Apply These Secret Techniques to Improve Your Platinum Trading

Whenever you see marketing product bundling schemes they are commonly named by precious metals, starting from “silver package” up to gold and platinum as the top, most expensive offer. However, platinum is not the most expensive metal you can trade on the market, it is cheaper than gold and palladium. The price of an asset is not important to traders, they look into other important factors such as volatility, supply and demand, fundamentals, and policies.

We will approach palladium trading the same way we have described in previous articles. Note traders should be familiar with the system we use, although the analysis and opinion presented here can be useful for everyone interested in widening their opportunities and skills from forex to the precious metals market. All the adjustments we have made to our technical trading system for precious metals is already described, therefore, we will focus on the specifics of platinum. 

Platinum crossed paths with gold in 2011, to the point platinum is currently trading at $860 and gold at $1900 per troy ounce, it took only 9 years for gold to double. Before platinum was a more expensive metal. This shift has more to do with demand than with the supply of platinum. South Africa is the place where platinum is mined but actually, platinum can be considered as a by-product of gold, nickel, and some other metals mining process. It is like a metal that comes along with them, not primarily the goal of the mine opening, except in South Africa. The total platinum supply is extremely scarce compared to gold and silver, by far. A total of 8 million ounces are currently mined out from the earth, gold has 6 billion, and silver 3.5. If you are interested in investing in platinum, you will be a minority investor by choice. 

When we turn to demand, platinum is used in the industry, automotive, dental, medical appliances, and jewelry for making white gold alloy, even though pure platinum jewelry is not common. The primary platinum supply and projection for the next few years is in the picture below. 

As with gold and silver, platinum is also having a decreasing supply projection, creating a bullish sentiment. However, there is a twist to it. Platinum at the moment cannot be your ultimate hedge asset as gold and silver can be, despite its scarcity and decreasing supply. The fact that offsets platinum ability to be a metal to go in an economic crisis is the demand for it. In the picture below we can see the composition of platinum demand by sectors and the total demand.

Note the actual investing part of the demand, it was not present before 2007. Since inception as an investment metal platinum is not seen as the metal traders would choose, although long term investments are now held. Also, demand levels remain the same more or less, the automotive industry can be a factor, we have an increasing need for electric cars that also require platinum yet that also counters the need to make catalysts for combustion engines. Platinum is not bearish nor bullish here. It is extremely unlikely platinum is about to become a metal of choice before silver or gold, therefore the price does not move up or down dramatically as silver and gold. Can platinum be a hedge against other precious metals? Probably, diversification is an investor’s friend. Is it good to hold it long term? It is hard to know, there are no trends that could increase its demand.

The demand is the major factor of platinum price, supply is low and mining platinum is hardly going to get up, thus even a small demand increase will amplify the price move because of scarcity. If this ever happens because of the industry shift or a different perception of platinum, its price will catch up with silver and gold very quickly. An interesting fact about platinum is that there was almost no physical coins and bars to buy, gold and silver were dominant. Only in the last decade, you could see platinum coins and bars offered for investors, today they are not a rarity. Does this mean platinum needs more time before it is perceived as a good alternative to gold is yet to see. So the sentiment is neutral to bullish, we haven’t seen anything with platinum in the last decade as we have with gold and silver. 

Now, by looking at the technical analysis, gold, silver, and platinum charts have nothing in common. However, they could move in tandem or positive correlation. 

Gold (orange line), silver (gray line), and platinum (blue line) manifest similar patterns but platinum did it in its own way. The dips are more extreme and the tops are flatter. If we trade on a daily chart, you may not see the same price action. In the long term, you can with moderate precision tells platinum will follow gold and silver. A similar phenomenon is with cryptocurrencies. Still, platinum does not have a positive correlation on a daily and any other time frame where we invest for short-term trades. This is a great feature.

We do not have to worry about what gold and silver are doing. Platinum has its own vibe where it will move but will follow the major precious metals trend when zoomed out. Take any trend from gold or silver for the last month and you will see entry points are completely different and there might even be a counter-trend not present on the gold or silver chart. Go to the weekly chart and observe the same thing. Having a variation in the precious metals asset range benefits you so you can trade one when the other is consolidating and vice versa. Days, when the USD is driving the bus, will be manifested with positively correlated moves across all metals against the USD. Luckily, metals have their own way and they drive the bus most of the time. 

If you remember that we manage risk differently for gold and silver when we have the same trade signals not too far between, platinum does not need this measure. Trade full position sizes regardless of what gold and silver are doing. In some cases, you will even have opposite trend trades. Taking about pros, gold has its smooth movements, silver has its dramatic trends and platinum does not really care what the others are doing, you can trade it without fear even when signals are conflicting. According to some technical traders, platinum is performing better than the other two metals using the same system. So platinum may be an easy-going but faster performer, consequently, you will need to cope with somewhat erratic trends, they can appear out of nowhere and end suddenly. 

Wrapping it all up, platinum has unattached movements with the other precious metals but will correct at some point when we zoom out to see the bigger picture. Does this mean you can use this and buy or sell at a better price? Not really, you may often find platinum went the opposite way and trigger your stop loss before it is corrected. If you are an investor you could wait out for the correction, however, the price may not be any better. You may find it was simply better to trade platinum without any regard for correlations.

When the USD starts moving hard, you will see a positive correlation just by sheer dominance of the USD move, but metals are independent movers. Be aware of the interest rate events for the USD. A change will likely impact precious metals in the same direction. Your forex knowledge of how to manage trades before news events can be carried over here without any changes. Just be sure to follow fundamental changes for platinum and all other precious metals, especially if you are investing and applying a buy and hold (for a long time) strategy. The major shift from forex trading is this fundamental information, still, we use the same technical trading system. 


Categories
Forex Assets

The Role of the United States Dollar Index in Forex Trading

The US Dollar Index is something that you often see mentioned around the trading world, if you haven’t seen it mentioned then it probably won’t be long until you do. If you haven’t, then it would be a good idea to get to know a little more about it, the US Dollar Index is a great tool that can help you to confirm if there is a directional bias for the currency pair that you are currently trading, it can also help to warn you of awesome potential barriers to your trade before you decide to place the trade.

The Federal Bank in the US is one of the more important central banks in the world, the US dollar is also one of the most traded currencies in the world making up to 70% of all transactions each day, so being able to have an idea of what the Dollar is doing on any day will give you a huge advantage for your trading and you as a trader, and that is exactly what he US Dollar Index will help us do.

So what exactly the US Dollar Index? It started back in 973 for the value of 100.000. In 1985 the USDX (US Dollar Index) traded for as high as 164.7200 and then on March 16 2008, it dropped as low as 70.698. So the USDX can range quite a bit moving both up and down, the ranges are often quite large having large trends. However, this is not always a guarantee and so this is why it should be used as an indicator only instead of as an actual trading tool to make trades.

The USDX is basically a measure of the US dollar in relation to a basket that will contain a number of the most important trading partners for the US. The basket has six different foreign currencies within it, with each currency having a different weighting due to the size of the country or countries using the currency, for example, the Euro has 23 different countries within it and so it is weighted slightly higher than a smaller one such as the Swiss Franc. The largest part of the USDX is made up of the Euro which currently weighted at 57.6%. The following currencies are included in the USDX:

  1. The Euro (EUR), 57.6% weight
  2. The Japanese Yen (JPY), 13.6% weight
  3. The Great British Pound (GBP), 11.9% weight
  4. The Canadian Dollar (CAD), 9.1% weight
  5. The Swedish Krona (SEK), 4.2% weight
  6. The Swiss Franc (CHF) 3.6% weight

So it is clear that the value of the USDX is influenced quite heavily by the Euro, this is one of the clues as to why the USDX will be useful for us as traders when it comes to making trading decisions.

The USDX can actually be seen as a kind of anti-euro indicator, due to the Euro having such a high weighting on the USDX, it means that there is a kind of negative correlation between the two. When the Euro falls the USD will generally rise, and when the Euro rises the USDX will generally fall. Knowing this can mean that we are able to use the USDX as an indicator for the potential movement of the EUR/USD pair. 

The USDX can also be seen as a guide for the direction of the USD traded against pretty much any pair. When you trade a currency pair that has the USD in it, it will be guided by the USDX. If the USD is the base currency within a trading pair, then the USDX and the currency pair will typically move in the same direction. If the USD is the quote currency (second currency) then the USDX and the currency peri will often move in the opposite direction.

There is something known as the smile theory, this is basically a good way of mentally remembering the three different ways that the dollar responds to different situations. It is called the smile theory because the three different situations create the shape of a smile. On the left of the smile at the top, we have the USD strength that is formed when the global economy is starting to struggle. The bottom part of his smile is where the USD depreciated on something known as a dovish feed. The right side of the smile, the right upper part, is when the USD gains value on something known as a hawkish feed and risk on the environment. This then creates a smile like a graph. The smile theory allows you to get an overall picture of understanding where the dollar is at present and what is likely to happen next.

If you manage to get into the habit of looking at the US Dollar Index prior to making any trades, it gives you another indication of what could happen and could also be used as an additional confirmation for your trades. As with anything in trading, nothing is a guarantee, you cannot rely on the USDXto show you the exact direction or exactly what any currency or currency pair will do, simply use it as an indicator and nothing more. It can be quite a powerful tool and can really give you a little edge when trying to work out the potential direction and bias of the markets, so it is a good idea to get to grips with how it moves and how it works in order to implement it into your own trading analysis.

Categories
Beginners Forex Education Forex Assets

Which Currency Pairs Are Most Volatile?

One of the most prominent and most important decisions that you need to make at the start of your career is which currency pair you are going to b trading, there isn’t a right or wrong choice to make here. It will be down to your own preference, and will also need to take into account what your trading strategy is as well as your risk management plans.

One of the things that you should be thinking about when you select which currency pair is the amount of volatility within that pair. The forex markets are incredibly liquid with a lot of money going through them which normally means that there is a lower level of volatility. However, there are many reasons as to why certain currency pairs will have a lot more volatility within them than others.

The volatility of the currency pair that you decide to trade with will affect pretty much every aspect of your trading, the more volatile pairs can mean a lot bigger profits, but the other side of the coin is of course that there are opportunities for much greater losses too, as a result of this you are going to need to balance the potential gains against the potential risks. So we are going to be looking at some of the slightly more volatile currency pairs today, these pairs can offer fantastic opportunities but should be traded with caution, some are quite popular, others are a little rarer and not even found on the majority of brokers.

Just before we get into which the most volatile currency pairs are, it is important that we have a basic understanding of both what a currency pair is and what volatility is. So if we start with currency pairs, each pair is made up of two different currencies, the base currency, and the quote currency. The value of the currency pair is determined by how much of the quote currency make up a single unit of the base currency. So if we were to be looking at the GBPUSD pair, the base currency would be GMO and the quote currency would be USED due to it coming second. So you will then need to work out the price of both the base currency and the quote currency in order to work out whether that air is worth trading.

Volatility is something that is spoken about quite a lot when it comes to trading and forex, volatility is basically the amount of distance that the price fluctuates. The higher the volatility on a currency pair the more the price will move up and down, with a less volatile pair like the EURUSD moving less with each tick (movement). Price movements are of course measured in pips and so the higher the volatility, the higher each pip value and movement.

So let’s take a look at what some of the more volatile currency pairs are that you can trade…

USD / KRW: This pair is made up of the US Dollar and the South Korean Won, it has a highly inflated exchange rate which can make price fluctuations for this pair very common. Some traders seem to think that this currency pair is quite easy to trade and so more and more people are beginning to trade it, this does however mean that the volatility will only increase making it even more dangerous.

USD / BRL: The Brazilian Real falls into what is known as an exotic currency, this means that it is coming from an emerging market. These sorts of currencies often have much higher volatility so pairs such as this one with an exotic currency in it are often far more volatile.

AUD / JPY: The Australian Dollar and Japanese Yen is another very volatile pair, this is known as a commodity currency and these sorts of currencies can be very volatile. Yet the Japanese Yes is one of the least volatile currencies available on the market and people look for it to bring stability to their portfolio. The opposites of these two currencies give the currency pairing a high level of volatility making it very profitable for people looking to profit on price fluctuations.

NZD / JPY: This currency pair works very similarly to the USD JPY pair that we mentioned above with a very similar relationship between the two currencies. Once again the NZD is a commodity currency, its value is mainly tied to the exports of dairy products, honey, wood, and meat. A change in price for some of these products will cause a jump in volatility for this pair.

GBP / EUR: Ten years ago this currency pair would be on this list. However, due to the ongoing Brexit negotiations starting in 2016 this pair has become a lot more volatile, as have many of the pairs now containing the Great British Pound. Each and every news event regarding Brexit shakes up the volatility of this pair with rather large jumps and trends being caused by the news.

CAD / JPY: The Canadian Dollar is heavily dependent on oil prices, this currency pair has a similar relationship to that of AUDJPY and NZDJPY, the inverse in these currency types can cause a lot of volatility. With changes in the price of oil being quite common, it is not uncommon to see jumps in the price of the CAD and so added volatility for this currency pair. If you are thinking of trading this pair, then be sure that you are also monitoring the prices of oil.

GBP / AUD: The GBP USD pair was once again quite a stable currency pair in the past, but there has been a lot of conflict between the US and China in relation to their trade war which has disrupted the trade links between Australia and China, something that Australia really relied on and still does. Due to this, the Australian exports have dropped in value which has, in turn, made the relationship with the GBP a little more volatile.

USD / ZAR: South Africa is one of the world’s primary exporters of gold, and when selling gold around the world it is generally priced in USD. Due to this, the price of gold is highly linked to the strength of the US dollar, and so as the price of gold increases, it will mean that you will need more Arin in order to purchase USD, thus increasing the volatility of the markets.

USD / TRY: There has been a lot of political instability and disruption within Turkey which has caused the Turkish Lira to be incredibly volatile within the forex markets. During moments of political importance such as elections or coups, the volatility of this pair will spike dramatically.

USD / MXN: The relationship between the US and Mexico has been a little wobbly ever since Donald Trump was elected as the president of the US which has caused a lot of volatility within this currency pair. Even more recently, there have been some added tariffs on Mexican exports which have caused an even greater level of volatility within this currency pair.

So those are some of the most volatile pairs to trade, there can be a lot of profits in trading these pairs. However, there can also be a lot of danger, as the potential profits group, so do the potential losses, so these sorts of pairs are best left to those that have studied them or are considered to be experienced traders. Having said that, feel free to experience them on a demo account to get a feel for what it is like trading a volatile pair, you never know, it may be what is right for you.


Categories
Forex Assets

Which Are the Most Popular and Profitable Currency Pairs to Trade?

When it comes to forex trading there are a lot of pairs available to trade, a lot of them from the majors, the minors, and the exotic pairs. Some are, however, far more popular amongst traders than others. The world of Forex is attracting more and more people as time goes on, yet many of them do not know what the most popular pairs are or what the most profitable pairs are, they simply choose a random one and then start trading. So that is why we are going to be looking at what some of the most popular and most profitable forex currency pairs to trade are.

Before we do that though, let’s take a look at what a currency pair actually is. The forex market is the global market for trading currencies, it’s also the most liquid financial market in the world. Forex trading is simply the process of buying one currency while at the same time selling another, this is also the reason why the currencies are trading in pairs, one being bought and the other being sold.

There is a base currency and a quote currency, the base currency is the one that is quoted first while the quote currency is the currency symbol that is stated second. So if we were to trade the GBP/USD pair, then the GPB will be the base currency while the USD will be the quote currency. When trading there is also something known as a spread, this is the rate that you can sell a pair at and the rate at which you can buy it, the difference between these two figures is known as the spread. The final thing to point out is how they are displayed, if the GBP/USD pair is set at 1.31, this simply means that every single pound will be worth $1.31.

You also need to understand that there are different types of currency pairs, we very briefly mentioned them as the majors, minors, and exotic pairs. The defining features of the major currency pairs are that they include the US Dollar in them, examples of these major pairs include EUR/USD and USD/CHF. So this would mean that the currency pairs that do not include the USD are not majors, instead, they are known as minor pairs or crosses. They do however contain one of the world’s leading currencies such as NZD/JPY, GBP/AUD, and EUR/CAD. The final set of pairs are the exotic pairs, these often come from emerging economies around the world. They are often the least traded pairs but also some of the most volatile, some of these currencies include the Thai Baht, the Polish Zloty, and the Emirati Dirham.

So what are the most popular trading pairs available?

EUR / USD: The EUR/USD pair is the most well known and also the most popular pair to trade, it consists of the Euro as the base pair and the US Dollar as the quoted pair. It is also the most liquid currency pair available and also one of the most stable, yet it is still incredibly profitable to trade on, the spreads of this pair are also often the lowest of all the currency pairs.

USD / JPY: Another one of the most traded currency pairs traded on the markets and is also known for having its low spreads. The JPY is seen as a safe haven when the markets are in a time of uncertainty.

GBP / USD: The GBP and the USD are both among the most popular currencies and so this currency pair is also one of the most popular and profitable for traders to trade. This pair is normally quite stable, however with recent world events such as Brexit, the volatility has increased, but it remains incredibly popular to trade.

USD / CAD: There is a strong commodities link between the United States and Canada, this currency pair also has a strong link. This pair is known as the Loonie and as the Canadian dollar is linked to the export and prices of oil and grain, these commodities can influence this currency pair.

AUD / USD: The Australian dollar relies heavily on the export of the country’s gold pricing, due to this the AUD/USD currency pair can be influenced by the price of gold. This is yet another very popular trading pair.

USD / CHF: Yet another very profitable pair, the swiss franc is another currency that is seen as a safe haven, due to this the volatility is generally a little lower, yet this currency pair is still incredibly popular.

NZD / USD: The NZD/USD currency pair is another popular one, New Zealand has a strong agricultural influence around the world and so this pair relies heavily on the agricultural output and is an incredibly popular pair to trade.

EUR / GBP: This is again one of the most popular currency pairs to trade around the world due to both currencies being very popular. The Euro is used in many countries around the world making it popular to trade, normally quite a stable pair, this pair has been rocked with increased volatility due to the ongoing uncertainty around Brexit.

USD / HKD: Yet another popular trading pair, in fact, it is ranked as the 11th most traded pair, it can be seen as highly profitable with a lot of potential for smaller moves.

USD / KRW: South Korea has had some very impressive economic growth in local times. It is now the fourth-largest economy in Asia, due to this it now makes up to 2% of all trades that are made in the forex markets, due to its emerging and improving economy, this pair is becoming more and more popular as time goes on.

So those are some of the most popular trading pairs, yet you can’t really do anything with that information if you do not know how to actually trade them, having an understanding of the profitable pairs as well as how to trade them is how you can become a profitable trader. If we take the EUR/USD pair as an example, this pair often allows for a much safer trading experience due to its lower volatility, all that you really need to have when trading this pair is a basic understanding of how the markets work and some basic technical analysis know-how, this pair also often has the lowest spreads available of all currency pairs.

There is, however, absolutely no reason to limit your trading to a single pair, there are in fact over 250 different recognised countries and territories, so there is a lot to choose from when it comes to currency trading. Regardless of whether you chose to trade the majors, minors, or exotic pairs, it is important that you get your forex education done, at least the start of it, get some knowledge for analysing the markets and trade on a demo account to ensure that you are able to successfully trade before putting any real money into the account.

So those are some of the most popular pairs and also a little on what currency pairs actually are. Whichever pair you decide to choose, good luck, but if you are looking for stability combined with the potential for good profits, then go for the ones listed above, others can offer a lot more potential profits, but also a lot more risks.

Categories
Forex Assets

Trading The AUD/TRY Forex Exotic Currency Pair and Analysing The Costs Involved

Introduction

AUD/TRY is an exotic currency pair in the forex market. The AUD is the short form of the Australian Dollar and the TRY for Turkish Lira. Forex traders interested in such exotic pairs should be aware that trading them comes with high volatility compared to trading major forex pairs. In this exotic currency pair, the AUD is the base currency, while the TRY is the quote currency. Thus, the AUD/TRY price represents the amount of TRY that 1 AUD can buy. For instance, if the AUD/TRY pair’s price is 5.8362, it means that 1 AUD can buy 5.8362 TRY.

AUD/TRY Specification

Spread

In the forex market, your broker sells a currency pair to you at a higher price and buys it from you at a lower price. The value difference between these two prices is the spread. It is the primary way in which forex brokers earn their revenue.

The spread for the AUD/TRY pair is – ECN: 3 pips | STP: 8 pips

Fees

Forex traders with ECN account normally pay a trading fee to their broker whenever they open a position. This commission depends on the size of the trade, and not all forex brokers levy it. STP accounts do not have commissions.

Slippage

In forex trading, slippage refers to the price you expect your market order to be filled at and the price at which it is executed. The difference is a result of delays by your forex broker or high volatility.

Trading Range in the AUD/TRY Pair

The trading range refers to the analysis of the price fluctuation of a currency pair across various timeframes. The trading range shows the volatility in pips for a currency pair throughout the trading period ranging from minimum to maximum.

The Procedure to assess Pip Ranges

  1. Add the ATR indicator to your chart
  2. Set the period to 1
  3. Add a 200-period SMA to this indicator
  4. Shrink the chart so you can determine a larger period
  5. Select your desired timeframe
  6. Measure the floor level and set this value as the min
  7. Measure the level of the 200-period SMA and set this as the average
  8. Measure the peak levels and set this as Max.

AUD/TRY Cost as a Percentage of the Trading Range

After determining the trading range, we can then determine the trading costs associated with these trading ranges. The total trading cost is expressed as a percentage of the pip volatility. Here are the trading costs for the AUD/TRY pair on both ECN and STP accounts.

ECN Model Account costs

Spread = 3 | Slippage = 2 | Trading fee = 1

Total cost = 6

STP Model Account

Spread = 8 | Slippage = 2 | Trading fee = 0

Total cost = 10

The Ideal Timeframe to Trade  AUD/TRY Pair

From these analyses, we have established that longer timeframes have lower trading costs while the shorter timeframes attract higher trading costs. Note that the highest trading costs coincide with periods of lower volatility.

Therefore, the ideal timeframe to trade the AUD/TRY pair would be on longer timeframes when volatility is the highest. For shorter-term traders, opening positions when volatility is above the average can potentially lower the trading costs. Furthermore, traders across all timeframes can lower their trading costs by using the forex limit order types. With these types of orders, the cost of slippage is removed.

Below is an example using the ECN account.

ECN Account Using Limit Model Account

Total cost = Slippage + Spread + Trading fee

= 0 + 3 + 1 = 4

Using the forex limit order types has lowered the trading costs across all timeframes. You can notice that the highest cost has reduced from 101.69% to 67.8%.

Categories
Forex Assets

Exploring The Costs Involved While Trading The AUD/HUF Forex Exotic Pair

Introduction

The AUD/HUF pair is an exotic forex pair with the AUD representing the Australian Dollar and the HUF representing the Hungarian Forint. When trading in such an exotic currency pair, forex traders should anticipate higher volatility. The base currency in this pair is the AUD, while the HUF is the quote currency. Hence, the exchange rate of the AUD/HUF represents the amount of HUF that a single AUD can purchase. If the exchange rate of AUD/HUF is 221.51, it means that you can buy 221.51 HUF using 1 AUD.

AUD/HUF Specification

Spread

One of the ways forex brokers earn their revenue is through the spread. This is the difference in value between the price they sell a currency pair to you and the price at which they buy the same pair from you.

The spread for the AUD/HUF pair is – ECN: 22 pips | STP: 27 pips

Fees

For traders with the ECN account, they get charged a fee for opening positions. Note that not all brokers charge this commission. Forex brokers do not charge a fee on STP accounts.

Slippage

Every forex broker has different execution speeds. In times of high volatility, your order may be executed at a price other than the one you requested. This difference is slippage.

Trading Range in the AUD/HUF Pair

The trading range in forex trading is used to analyse the fluctuation in the price of a currency pair across multiple timeframes. The volatility, as measured with the trading range, is pips from the minimum, average, to the maximum for all timeframes. With this information, you can deduce the most profitable timeframes to trade.

The Procedure to assess Pip Ranges

  1. Add the ATR indicator to your chart
  2. Set the period to 1
  3. Add a 200-period SMA to this indicator
  4. Shrink the chart so you can determine a larger period
  5. Select your desired timeframe
  6. Measure the floor level and set this value as the min
  7. Measure the level of the 200-period SMA and set this as the average
  8. Measure the peak levels and set this as Max.

AUD/HUF Cost as a Percentage of the Trading Range

Now that we’ve established the volatility,  we can proceed to calculate the trading costs incurred when trading these timeframes. The trading cost is expressed as a percentage of total costs to the volatility.

Below are the trading costs of the AUD/HUF pair for both ECN and STP accounts.

ECN Model Account costs

Spread = 22 | Slippage = 2 | Trading fee = 1

Total cost = 25

STP Model Account

Spread = 27 | Slippage = 2 | Trading fee = 0

Total cost = 29

The Ideal Timeframe to Trade  AUD/HUF Pair

From the above analyses, we can see that the trading cost of the AUD/HUF pair decreases with an increase in volatility. Since the volatility also increases with the timeframe, trading the AUD/HUF over longer timeframes incurs lower costs.

Although the lower timeframes have higher trading costs, these costs can be reduced by timing trades when volatility approaches the maximum. Furthermore, slippage costs can be avoided if traders use forex limit order types. With the forex limit orders, trades are executed at precise price points, avoiding the impact of slippage. Let’s look at an example of this using the ECN account.

ECN Account Using Limit Model Account

Total cost = Slippage + Spread + Trading fee

= 0 + 22 + 1 = 23

Notice that the trading costs have been reduced in all timeframes. For example, the highest cost has been lowered from 423.73% to 389.83%.

Categories
Forex Assets

All You Need to Know to Start Trading the US Dollar Index

Some beginner traders may not have even heard or dealt with the US dollar Index, but the more invested traders are highly likely to have encountered the term on some media outlet. The US dollar Index, otherwise known under the abbreviations DXY or USDX, can be charted on MT4 on a variety of trading platforms. From the perspective of the forex market, the DXY is often said to be representative of the strength of the United States dollar (USD) due to the fact that it stands against other major currencies.

While traders are still unable to carry out trades on the DXY in the United States, the index is freely traded outside the borders of the country and across the world. Despite the availability of conducting related trades, some prop traders suggest that the ATR might be just too low for it to be a lucrative business endeavor. What is more, those who have extensive experience trading in the forex market claim that any involvement with the DXY may in fact have quite a negative impact on the overall trading of currencies, which may naturally vary from trader to trader.

Nonetheless, besides the difficulties encountered while trading this index, the DXY is still both interesting and important to discuss, especially in terms of the changes that have happened in the past and the ones that have yet to happen. In this article, we will delve deeper into this index implication in forex trading.

The DXY’s history commenced in 1973 when the United States left the gold standard, which further meant that the USD was no longer backed by an equivalent quantity of precious commodities. At the same time, the before-used gold- and silver-stamped banknotes could no longer be exchanged for the corresponding amount of gold and silver. The creation of this index therefore coincided with some key moments in the overall history of the country and its official currency. The value of paper money suddenly decreased and this led to an increase in frustration and fear in a number of people who started to spread concern for future ability to assess the USD’s worth. The idea of making an index directly stemmed from this need and hope that the currency’s value could be determined by comparing it to other world currencies.

Consequently, the currency basket was created and its value, set at 100, depended on the amount of trade carried out with other countries. As stated above, the necessity behind the formation of the DXY essentially originated from the USD no longer being tied to any hard commodities. Today, however, the value of the index changed substantially, especially because the currencies across the world changed and disappeared with time. A great number of the US trades were done with European countries and, as we know, a number of currencies in this continent were merged into the euro (e.g. the Deutsche mark, the French franc, the Italian lira, and the Greek drachma). The spread and the percentage hence changed dramatically and this naturally affected the DXY, which raised concern among the trading community. 

Some of the biggest challenges experts claim to have faced in the past is related to the fact that the DXY is generally not calculated by factoring in all the currencies in the world as it was originally conceptualized. While the world and its currencies kept changing, it appears that the rules governing the value of the USD and this index still remained the same. This idea is particularly interesting because the DXY is, as opposed to the common belief, currently determined on the basis of the exchange rates of six world currencies – the Euro (EUR), Japanese yen (JPY), Canadian dollar (CAD), British pound (GBP), Swedish krona (SEK), and Swiss franc (CHF), with the EUR as its greatest component. Based on this information, it is abundantly clear that the ratio does not originate from even distribution across all seven majors, excluding the AUD and the NZD. What is more, the index is heavily reliant on the USD/EUR currency pair, which makes above 50% of the DXY’S value. The weight is then shared between the currencies in the following manner:  the EUR: 57.6%, the JPY: 13.6%, the GBP: 11.9%, the CAD: 9.1%, the SEK: 4.2%, and the CHF: 3.6%. Therefore, traders interested in the AUD, NZD, and CNY will likely find little benefit from the USDX

The value which was initially set at 100 would change considerably with time, as you can see from the image below. The DXY would in certain periods appreciate to 120, which only meant that the USD also increased by 20%. At some other points, we can see that the USD depreciated quite a bit, and it is also clear that, as the graph below demonstrates, the current value of the index is standing at just above 90. The mid-80s recorded an all-time high with the unbelievable value of approximately 160, while the lowest point was measured in the midst of the financial crisis in 2007/2008. Interestingly enough, some other events would often affect and propel these drastic shifts, such as the Latin-American crisis that caused the USD’s increase in the 80s. The financial crisis in the US when the USD was quite weak, for example, immediately pushed the oil and gas prices due to the well-known connection between the USD and the price of commodities. The USD was extremely weak and unfavorable at the time and other countries seemed to be booming to the extent that, as some may even remember, the US cab drivers or models desired to be paid in the EUR rather than their homeland currency. 

Currency trading is also vastly different from trading stocks owing to the fact that, due to the increase in population and inflation, the stocks inevitably go up in value. This bullish bias however does not exist in the world of currencies, and the DXY directly epitomizes the previously stated difference – although the index was initially set at 100, today it is below its starting point. This (roughly speaking) 7% discrepancy, if compared or 1973, clearly demonstrates how the currency market need not and does not follow the standards or trends of the equities market. Needless to say, trends are also an inherent part of the forex market as well, and traders desire to see the USD increase in value too, yet from the long-term perspective, the value of the USD remains more or less the same as it did several decades ago. Trading currencies is, hence, truly unbiased, unlike stocks.

Also, individuals interested in getting a quote on the USD can for example search for the Dow Jones index, which is based on approximately 30 stocks. Interestingly enough, as stocks are not true objects but prices, people can neither buy them nor always easily find quotes for such matters. Despite the indices/indexes being numerous, some may be increasingly more difficult to find quotes on. Furthermore, since the US regulations forbid trading the DXY in the country, traders can resort to some other legal options that function as an alternative to trading the US dollar index. Some of the common financial derivatives used to trade the US dollar index include the CFDs, futures, and options. 

CFD, or contract for difference, is one of the commonly used ways to trade indices, allowing those eager to trade the DXY to profit from price movements. Unlike other trades, the CFD trades typically involve much greater risk, as the price can easily go below zero and even farther, taking down traders’ accounts along with them. As CFDs contain leverage, traders do need to invest in trading psychology and money management skills to be able to weigh out their options and limit the chances of destroying their accounts. Those experienced in trading stocks and indices should also bear in mind that trading CFDs is unique and it is absolutely essential to study and demo trade them thoroughly. Other means of trading the DXY include futures contracts, which serve as a way for companies to offset risk and protect themselves from any future currency exchange rate changes or interest rate changes.

As we discussed above, traders may find it hard to find certain quotes although there are some indices, such as the S&P 500 for example, which are quite easy to access. If you are interested in the DXY, which is essentially a basket or a number derived from other values, you would need to insert the dollar sign before a quote, which signifies that it is an index. Therefore, anyone requesting a Dow Jones industrial average quote would need to put in the dollar sign and INDU. Websites are becoming more and more user friendly, and are becoming easier and easier to use even with respect to the insertion of adequate abbreviations. Real-time quotes are still harder to find in comparison to the delayed ones where interested parties may even need to pay some money. 

The DXY is also available as an ETF (Exchange Traded Fund) on the ICE exchange. ETFs track indices, dividing it into shares. In addition, ETFs function similarly to stocks, they do not have a net asset value, and their value fluctuates during the day owing to traders buying and selling activity. Although ETFs resemble stocks, they are not tangible objects but numbers. If a trader is searching for a real-time quote on the USD, he/she can use UUP, a symbol for an ETF, as a substitute for the USD. As a derivative of the DXY, it mimics its behavior, so if one goes up, the other one will follow. The ones interested in stocks who cannot find the S&P 500 index can also use the ETF index under the name of Spiders whose symbol is the in SPY (SPDR), whose movement resembles the S&P 500 as well. Therefore, if traders are looking to buy the DXY, they should know that it is practically impossible because it is an index.

Traders can, however, buy the UUP, which is considered a stock or they can look into futures with regard to index as well. Moreover, those who do not wish to get involved with the UUP can still trade the DXY but would need to do so through its derivatives or futures. This may not be particularly sensible to forex traders, but if any individual feels interested in these trades, they should know that they are in fact buying the percentages of the trades between the USD and other currencies we discussed above. 

What is also important to discuss is the changes that have occurred in the past and the ones we are expecting to see in the near future. Firstly, the year of the creation of the DXY is approximately half a century away from the present and the world has changed tremendously since then. We no longer have the currency basked as wide as before, for example, and the concentration is now found in one single currency (the EUR), which everyone finds to be the greatest flaw of the DXY. In addition, trading has completely changed between the US and some companies and countries such as China, Mexico, Brazil, and South Korea. The upcoming changes are still being discussed, especially during times of price dislocation. In 2007, this topic was quite prominent when the DXY was at its lowest, and it appears that the need for change always comes up when there is some distress with the price of the USD.

The DXY is hence quite likely to experience some changes in the future, yet this still should not affect forex traders. The USD is unlikely to change and this only concerns the USD against other currencies. The only value of the DXY is, therefore, found in its ability to reveal its overall performance. In terms of the USD’s general performance, we can easily look into the DXY, but we still lack other similar indices. We still lack a JPY index against the USD, the EUR, the GBP, and other currencies for example. These indices offer a great insight into these baskets which could be utilized to discover the strongest currency. That way we could tell which one is the fastest or which the worst one is, but despite the existing interest, this idea has still not been materialized for some reason. 

Although many complain about the uneven distribution of currency percentages of which the DXY is comprised, experienced traders even claim to have tried a number of different approaches and methods to get on top only to realize that, no matter what technical analysis they applied, there found absolutely no gain from struggling with the DXY. For example, although they paid close attention to the type of signals they would receive while choosing which USD trades to trade, they still discovered that too much energy and focus was taken away from making some other profitable trades. That way, those who attempted to make any use of the DXY found that their essential principles of trading were compromised, as they started to pass on good opportunities.

Losses may happen anytime, especially since they are an inherent characteristic of the forex market, but missing out on great opportunities to build one’s account and financial stability are generally considered one of the greatest faux pas in the market. Hence, if any trader is already invested in breaking down the strategy on how to employ the DXY in the best way possible, he/she should also strive to eliminate chances of overseeing prospects of winning. If your involvement with the DXY is taking too much of your time and attention, you should ask yourself if it is worth the effort. Simply put, the claims for changes are many and it is abundantly clear that traders are eager to see an evenly weighted USD Index and the creation of similar indices for other currencies as well.

Still, if you feel that your trading account is currently suffering because of your involvement with the DXY, it may be wise to wait for more prolific times and shift to more lucrative opportunities that the forex market is abundantly offering. If you are eager to keep exploring the DXY and what it can offer in trading, make sure that you invest as much as possible in learning about the different substitutes to standard trading which are legal in the US, employing money and risk management skills.

Categories
Forex Assets

Little Known Facts About the Connection Between Crude Oil and Forex

Just as it is possible to use the movements of the Crude Oil market to identify trends by fundamental analysis or macroeconomics, this information can be very useful in the trading of foreign exchange and other types of Petroleum-related financial assets. In this article, we explain how the interpretation of oil price movements can be useful for a Forex trader when examining the relationship between Crude Oil and Forex markets. 

We will also explain why it would be useful to pay attention to Crude Oil prices in order to formulate a successful foreign exchange trading strategy. For those who want to trade with Crude Oil itself, this asset is offered to operate by many online Forex/CFD brokers.

Oil Price Movement and Forex Trading

Many countries in the world, such as Mexico and Saudi Arabia, depend heavily on their oil exports, especially in terms of budget and overall economic performance of their country. Crude oil is an essential commodity for the functioning of the modern world, so an increase in the price of oil is often related to inflation, economic growth, and the price of other goods, especially prices, Consequently the demand for products made of Petroleum.

The movements of the Crude Oil market are of great importance for the Petroleum producing economies and their derivatives, not only in terms of the formulation of policies but also the forecasting of local economic results. This is also true for the rest of the world, as it is impossible to imagine our current economic system without black gold, so that information can be useful in shaping our expectations with regard to inflation and other macroeconomic factors.

Oil Price Movements and Exchange Rates

We have already mentioned that there are countries that depend heavily on their oil exports. This is important not only because a bad year in the oil markets could affect the economic performance of these countries, but also because oil prices and quantity variations often affect the exchange rate of these countries.

Take Canada as an example. Like many other countries, Canada is highly dependent on its exports to the rest of the world, but as one of the world’s leading oil producers, You should not be surprised that Crude Oil is the main source of Canada’s total foreign exchange earnings, especially because Crude Oil is traded in US Dollars.

Movements in the price of crude oil and exchange rates. In other words, an increase in the price of crude oil (assuming constant demand) often means an increase in the supply of US Dollars in the Canadian economy. This tends to drive the exchange rate down, as Canadian dollars would now be relatively scarcer compared to the number of green dollars currently circulating in the economy. The opposite, of course, is also true: the fall in oil prices means that Canada will receive fewer dollars per barrel, which implies a lower offer of US Dollars in the economy and an increase in the exchange rate, given the relative shortage of US dollars.

As a merchant, there are ways to take advantage of Oil’s price movements by trading Crude Oil currency pairs, especially if you are reluctant or unable to trade directly with Crude Oil.

An “Oil Pair” in Forex is USD/CAD since the Canadian Dollar is the largest substitute for Oil in the global Forex market. This pair tends to increase in value when the Oil market is in decline and decreases in value when the market skyrockets, meaning that it may be possible to formulate a strategy to operate this pair based on the movements of the Oil market price.

Other currencies benefit from a positive correlation with Crude Oil, such as the Norwegian Crown and the Russian Rouble; however, these tend to have low liquidity, which means that it may be more difficult to take advantage of the relationship between these currencies and Crude Oil, at least compared to other Forex correlations. This means that trading with oil currency pairs like USD/NOK or USD/RUB can be more difficult, at least compared to other Forex “oil pairs” that tend to be more liquid, such as USD/MXN or USD/CAD.

As for the prices of crude oil and the value of the American Dollar relative to other currencies, there used to be an inverse relationship between them, but that has changed over time. The inverse relationship was especially true when the United States was considered as a net importer of petroleum, but the situation has changed significantly in the last decade since the United States became a major supplier of oil and a major influence on world crude oil prices. Now the correlation tends to be positive, although it should be noted that this has been anything but constant over time.

Oil Price Movements and Fundamental Analysis

Just as crude oil prices can influence foreign exchange rates, they can also affect the fundamentals that play a role in the valuation of some currencies. As we said, there are countries that depend heavily on their oil exports, for example, Mexico, Norway, and Venezuela. Because of this, unfavourable oil price movements affect the perceptions of traders and investors about the intrinsic value of their currencies. For this reason, it should not be a surprise to see traders fleeing from currencies like the Mexican peso into “safer assets” when oil prices collapse.

The opposite is also true. Rising oil prices could favor certain currencies. For example, because of Mexico’s vast oil reserves, positive movements in the price of crude oil tend to favour the performance of the Mexican Peso. Oil and Analysis Fundamentally, this correlation is not perfect, especially because there are other factors that could affect the fundamental evaluation of any currency, regardless of the country’s dependence on oil markets.

An example of this, at least in the long term, is the performance of the Norwegian Crown. As we know, Norway is a major energy producer, since oil accounts for about 62% of its exports. However, the correlation of this currency with the price of crude oil is very volatile and tends to be lower when oil markets recover. This has led some analysts to believe that, although positive price movements favour the Norwegian economy, the relationship between the performance of the Norwegian Krone and the price of Brent crude oil in the neighbouring North Sea is not very clear.

In any case, there seems to be a stronger correlation when the price of crude oil is falling, so it may be possible to benefit from this positive Forex correlation when the oil market collapses.

Crude Oil and Other Assets

As it is possible to trade Forex currency pairs based on Crude Oil price movements, traders can also take advantage of the relationship between the movements of the Oil market and other assets, particularly other commodities. There is, for example, a well-known (though not statistically constant) correlation between the price of crude oil and the price of gold. As an essential commodity, the increase in crude oil prices tends to increase inflationary pressures worldwide, so when oil prices skyrocket, this tends to increase inflation in the long run.

Gold is a well-known “safe haven value” against inflation and times of crisis, so should come as no surprise to see traders rushing toward this precious metal when they fear the continued depreciation of the world’s major currencies. Silver and other precious metals tend to have a very positive correlation with gold, so there may be an opportunity to take advantage of other Forex correlations.

On the other hand, falling oil prices tend to exert downward pressure on inflationary trends, which tends to hinder optimism about United States treasury yields. Oil prices also greatly influence global economic performance, so when crude oil prices rise too high, this tends to hamper economic growth, causing traders to rush to alternative assets such as gold. The gold supply chains themselves are also strongly influenced by what happens in the oil markets. Oil is widely used in gold mining, so rising oil prices tend to affect the margins of gold mines, affecting the supply of metal.

Another asset that has a well-known, albeit difficult, relationship with Crude Oil is natural gas. Historically, both commodities have moved together, as they were often positively correlated, but this relationship has changed significantly over the past decade.

Crude Oil Prices and the Foreign Exchange Market: Trading Opportunities

Abrupt market movements can be an opportunity to trade in currencies and other financial assets that have a positive (or even negative) correlation with Crude Oil. This means that a stock market crash may present an opportunity to sell energy shares, or to be long in the popular Crude Oil currency pairs like USD/CAD and safe-haven assets like gold.

On the contrary, a positive outlook for the stock market may be an opportunity to short the currency pairs of Crude Oil, or to be long in commodities that tend to have a positive correlation with the price of Crude Oil.

Categories
Forex Assets

Costs Involved While Trading The AUD/PHP Forex Exotic Pair

Introduction

In this exotic forex pair, the AUD is the Australian Dollar, and the PHP is the Philippine Peso. Note that trading with such exotic pairs is accompanied by periods of high volatility compared to major forex pairs. The AUD is the base currency, while the PHP is the quote currency. Therefore, in forex trading, the price of the AUD/PHP represents the amount of PHP you can purchase using 1AUD. Say that the price of AUD/PHP is 34.057. It means that with 1 AUD, you can buy 34.057 PHP.

AUD/PHP Specification

Spread

In the forex market, when going long, you buy a currency pair from the broker at a “bid” price. When you go short, you sell the currency pair to the broker at the “ask” price. The difference between the two prices is the spread.

The spread for the AUD/PHP pair is – ECN: 10 pips | STP: 15 pips

Fees

Forex traders using ECN type accounts get charged a trading fee by their brokers depending on the size of their position. STP type accounts rarely attract any trading fees from the brokers.

Slippage

If you have ever opened a trade during periods of increased volatility, you will notice that your order price differs from the execution price. This difference is slippage. It can also be caused when your broker is slow to execute your order.

Trading Range in the AUD/PHP Pair

The trading range refers to the analysis of the fluctuation of a currency pair over various timeframes. With the trading range, we can determine volatilities from minimum to the maximum across all timeframes. This information will be useful in deciding profitability across these timeframes.

The Procedure to assess Pip Ranges

  1. Add the ATR indicator to your chart
  2. Set the period to 1
  3. Add a 200-period SMA to this indicator
  4. Shrink the chart so you can determine a larger period
  5. Select your desired timeframe
  6. Measure the floor level and set this value as the min
  7. Measure the level of the 200-period SMA and set this as the average
  8. Measure the peak levels and set this as Max.

AUD/PHP Cost as a Percentage of the Trading Range

The percentage of the trading range is when we take the total costs associated with trading a particular pair and express it as a percentage of the volatility. Below are the percentage of the trading range for ECN and STP accounts.

ECN Model Account costs

Spread = 10 | Slippage = 2 | Trading fee = 1

Total cost = 13

STP Model Account

Spread = 15 | Slippage = 2 | Trading fee = 0

Total cost = 17

The Ideal Timeframe to Trade  AUD/PHP Pair

We can observe from the above analyses that longer timeframes produce higher volatilities. More so, as the volatility increases, the trading costs decrease. Therefore, shorter-term traders of the AUD/PHP pair experience higher trading costs than longer-term traders.

However, trading costs can be reduced if traders were to open their positions when the volatility is approaching the maximum. Notice that across all timeframes, the trading costs are lower when volatility changes towards the maximum. Furthermore, using forex limit order types can be used to lower trading costs. Such order types eliminate the slippage costs. Here’s a demonstration.

ECN Account Using Limit Model Account

Total cost = Slippage + Spread + Trading fee

= 0 + 10 + 1 = 11

By getting rid of the slippage costs, we have effectively lowered trading costs across all timeframes.

Categories
Forex Assets

AUD/TWD – What Should You Know Before Trading This Exotic Pair

Introduction

The AUD/TWD is an exotic currency pair with the AUD representing the Australian Dollar, and the TWD is the Taiwan Dollar. Such exotic pairs experience high volatility in the forex market. In this pair, the AUD is the base currency, while the TWD is the quote currency. That means that the exchange rate of the AUD/TWD is the amount of TWD that can be bought by 1 AUD. If the exchange rate of the AUD/TWD pair is 20.091, it means that you can exchange 20.091 TWD for 1 AUD.

AUD/TWD Specification

Spread

The spread in forex trading represents the difference between the price at which you can buy a currency pair when going long and the price at which you can sell the pair when going short. The spread for the AUD/TWD pair is – ECN: 24 pips | STP: 29 pips

Fees

Holders of ECN type accounts are typically charged a fee for every position they open. This fee depends on the size of the positions and the broker. Traders with STP accounts usually don’t get charged trading fees.

Slippage

If your broker delays executing your trade or if the market is highly volatile, you will notice a difference between the price you placed on your order and the execution price. This difference is slippage.

Trading Range in the AUD/TWD Pair

When trading forex, you will notice that a currency pair fluctuates over time. The trading range shows the minimum, average, and maximum variation in pips over different timeframes. By analysis of the trading range, we can determine the potential profit from trading a particular pair across various timeframes.

The Procedure to assess Pip Ranges

  1. Add the ATR indicator to your chart
  2. Set the period to 1
  3. Add a 200-period SMA to this indicator
  4. Shrink the chart so you can determine a larger period
  5. Select your desired timeframe
  6. Measure the floor level and set this value as the min
  7. Measure the level of the 200-period SMA and set this as the average
  8. Measure the peak levels and set this as Max.

AUD/TWD Cost as a Percentage of the Trading Range

To establish the Percentage of the trading range for CAD/TWD, we will express the total trading costs for both ECN and STP accounts as a percentage of the trading range above. This analysis will show us the true costs of trading the AUD/TWD pair across different timeframes, which will aid in determining the best timeframe to trade.

ECN Model Account costs

Spread = 24 | Slippage = 2 | Trading fee = 1 | Total cost = 27

STP Model Account

Spread = 29 | Slippage = 2 | Trading fee = 0 | Total cost = 31

The Ideal Timeframe to Trade  AUD/TWD Pair

From this analysis, we can tell that as the timeframe becomes longer, the trading costs become lower. For both accounts, the highest trading costs are at the 1H timeframe, which coincides with the lowest volatility of 2.7 pips. The lowest trading costs are at the 1-month timeframe coinciding with when volatility is highest at 256.8 pips.

Overall, we can also notice that the trading costs reduce when volatility changes from minimum to maximum across all timeframes. Therefore, traders of the AUD/TWD pair can reduce their trading costs by trading longer timeframes or trading when volatility approaches maximum. Furthermore, using forex limit order types can remove slippage costs.

Here’s an example.

ECN Account Using Limit Model Account

Total cost = Slippage + Spread + Trading fee

= 0 + 24 + 1 = 25

When the slippage costs are eliminated, the trading costs for the AUD/TWD pair drop. In this case, the highest cost dropped from 457.63% to 423.73%.

Categories
Forex Assets

The Insider Secrets of Coffee Trading Revealed

Coffee is one of the most interesting assets for trade. Although it is also one of the most volatile. Coffee is one of the raw materials of the soft complex and the vast majority of these products are characterized by being affected by sudden price changes.

There are two main types of coffee: Robusta and Arabica. Coffee is marketed under the ICE Futures contract in the U.S. It is Arabica. Robusta coffee beans are considered more bitter and also contain more caffeine.

History of the Coffee Trade

The International Coffee Organization reports on international coffee production and sales statistics and is a good promoter of coffee trade among nations. This organization is based in London, the ICO is composed of 55 member countries that produce and consume coffee and offers coffee futures traders a good deal of data and other information.

The Agricultural Foreign Service of the US Department of Agriculture also provides a wealth of information and statistics on coffee, including country and world production data, import and export data, etc. The various exchanges that trade in coffee futures also have a lot of information.

The contemporary history of the coffee market and its prices can be summarized in two periods: the period regulated by the International Coffee Agreements (AIC), from 1963 to 1989, and the subsequent period of free market, which followed the breakdown of the AIC negotiations in 1989.

The collapse of the 1989 Agreement was disastrous for many along the supply chain, as the International Coffee Organization (OIC) composite coffee target price fell by almost 75 percent in the following five years, from $1.34 per pound in 1989 to an average of $0.77 per pound in 1995.

During the regulated period, the average price difference between Arabica and Robusta was about $0.149 per pound. An annual peak of $0.475 per pound was recorded in 1986, following a shortage of supplies to Arabica following a drought in Brazil in 1985.

But why is coffee important to merchants?

With more than 2.2 billion cups of coffee consumed daily, coffee beans are one of the most commercially traded soft commodities in the world. Today, the coffee market is worth more than $100 billion annually. With growing demand, it has become one of the most interesting, albeit volatile, investment tools for trade. While some use futures and coffee options to cover their portfolio, others speculate.

Coffee is derived from a plant grown in more than 50 countries, all with tropical and subtropical climates. Brazil is the main producer, providing around 35% of the coffee grown in the world. The other main producers include Vietnam and Colombia.

Coffee Market and Price

Coffee futures and options are negotiated in New York on the Intercontinental Exchange (ICE, formerly the New York Board of Commerce) through CFDs.

The size of Coffee Futures Contract “KC” is £37,500

Trading in coffee commodities is now done electronically.

The value of coffee futures is quoted in cents per pound, and the price fluctuates at least 5/100 cents per pound, equivalent to USD 18.50 per contract.

A 1 cent change in price equals $375.

The months of March, May, July, September, and December are the months of the coffee futures contract.

International Coffee Market and Price

London coffee futures are traded at Euronext.liffe.

The equivalent to this contract for coffee futures is approximately 10 metric tons.

The prices of coffee futures are quoted in US dollars per metric ton with a minimum price movement of $1 per ton or $10 per contract.

The contract delivery months are January, March, May, July, September, and November with 10 delivery months available for trading.

Other international exchanges trading in coffee futures include the Singapore Commodity Exchange (Robusta), the Commodities and Futures Exchange (Arabica), and the Tokyo Bean Exchange (Arabica coffee and Robusta coffee), and (BM & F) in Brazil.

The largest coffee importers are the United States, the European Union, Japan, Canada, and South Korea. Global grain consumption continues to grow at a constant annual rate of over 2 percent, and artisanal coffee shops are rapidly consolidating into the retail business of modern society.

As an important staple of the diet, this agricultural product has generated a large economy of its own. Only in the US, the economic impact of coffee exceeds $220 billion and represents approximately 1.65%  of the country’s total GDP. The coffee industry is estimated to represent 1.7 million jobs in the United States. Thus, the prices of coffee commodities have a determining role in the global economy.

Is Coffee a Good Investment?

Like any other asset, the coffee trade offers no guarantee of financial success. For years, however, this agricultural product attracted the attention of international investors and traders seeking to add substantial growth and diversification to their portfolios.

Why trade in coffee?

There are several important reasons to trade in coffee, however, the most common are the following:

Diversification

The presence of coffee in a capital-only portfolio may reduce volatility due to the absence of a correlation between this commodity and other asset classes.

Safe Haven

Raw materials can serve as a safe haven in times of global economic uncertainty and market turbulence, providing operators with protection against inflation and the fall of the US dollar.

Speculation on Coffee Prices

Commodities could be very volatile, experiencing strong price swings. Trading in coffee CFDs is a way of trying to take advantage of the drastic fluctuations in the price of silver. Operating with coffee requires some consideration, due to the occasional high volatility of the market and the wide range of instruments available, from coffee derivatives, futures, and options, to the shares of those companies that are dedicated to this industry.

The Main Coffee Market Industries

One way to invest in the coffee industry is to buy shares in a company that produces or sells the product. The shares of these companies are strongly influenced by the coffee market and can offer a good value compared to the trading of the commodity itself. Of the countless companies in which one can choose to invest, a few names dominate the industry.

Expert operators often suggest investing in more than one company in order to cover their bets and avoid having all the eggs in one basket. Another way to protect against potential risks is to buy shares in a company whose product portfolio includes more than just coffee so that its return does not depend too much on the raw material.

Veteran traders share some tips on climate-related trade:

  • Never short in January.
  • Never short with coffee until July.

The reasoning is always the same: the proximity of the winter cold. In the case of the future of coffee, a freeze or threat of freezing in Brazil could be as serious as to damage coffee plantations and reduce coffee production, perhaps for several years, may have a substantial impact on raw material prices due to Brazil’s dominant role in the world coffee market. Depending on the situation of coffee supply in the world, some traders insist on shorting with coffee after May, looking towards the southern hemisphere winter season. However, this seasonal trend is not very strong because other countries, such as Mexico, can source coffee.

What to Expect for 2021?

The most recent estimates indicate that global production would be around 169.1 million sacks (-3.1% annually), mainly marked by lower production in Brazil (-8.5%), which will enter its biennial valley-year. The other producers would keep their production virtually unchanged: Vietnam (29.1 million bags); Central America (19); Colombia (14.3); and Indonesia (9.5).

Categories
Forex Assets

AUD/ZAR – Analysing The Costs Involved While Trading This Forex Exotic Pair

Introduction

The AUD/ZAR is an exotic currency pair in the forex market. AUD is the Australian Dollar while ZAR is the South African Rand. Trading the AUD/ZAR pair is expected to attract higher volatility than trading major forex currency pairs.

The AUD is the base currency in this exotic pair, while the ZAR is the quote currency. It means that the price associated with the AUD/ZAR pair represents the amount of ZAR that you can buy with 1 AUD. Let’s say that the price of AUD/ZAR is 11.5077; it means that with 1 AUD, you can buy 11.5077 ZAR.

AUD/ZAR Specification

Spread

At any given moment, forex brokers display the “bid” and “ask” price, which represents the price at which you can buy or sell a currency pair. The spread is the difference between these two. The spread for the AUD/ZAR pair is – ECN: 7 pips | STP: 12 pips

Fees

Forex traders with ECN type accounts can sometimes be charged commissions by their forex brokers whenever they open a position. The fees vary with the broker and the size of the position. STP accounts are typically not charged commissions.

Slippage

The price at which we place our trades isn’t always the price at which the broker executes these trades. The difference between the two prices is called slippage in forex trading. It can be because of extreme market volatility or broker inefficiency.

Trading Range in the AUD/ZAR Pair

The trading range refers to the pip movement of a currency pair throughout a trading day. The pip movement can be analyzed across different timeframes to determine the volatility of the pair.

The Procedure to assess Pip Ranges

  1. Add the ATR indicator to your chart
  2. Set the period to 1
  3. Add a 200-period SMA to this indicator
  4. Shrink the chart so you can determine a larger period
  5. Select your desired timeframe
  6. Measure the floor level and set this value as the min
  7. Measure the level of the 200-period SMA and set this as the average
  8. Measure the peak levels and set this as Max.

AUD/ZAR Cost as a Percentage of the Trading Range

We can compare the total cost of trading a particular currency pair alongside the volatility of that pair. This will help us determine the total trading costs of the pair across different timeframes and find out the optimal trading periods.

ECN Model Account Cost

Spread = 7 | Slippage = 2 | Trading fee = 1 | Total = 10

STP Model Account Cost

Spread = 12 | Slippage = 2 | Trading fee = 0 | Total cost = 14

The Ideal Timeframe to Trade the AUD/ZAR

From the analysis of the trading range and the costs in terms of Percentage, we notice that low volatilities attract the highest costs. Since lower timeframes have the least volatilities, it means that trading costs are higher in lower timeframes.

We can say that the ideal timeframe to trade the AUD/ZAR pair is when the volatility is approaching the ‘Maximum”. Traders interested in this pair can also choose to use forex pending orders instead of market orders. With pending orders, you get to eliminate the costs associated with slippage.

Here’s an example with the ECN account when slippage is 0.

Total cost = Slippage + Spread + Trading fee = 0 + 7 + 1 = 8

Eliminating the slippage cost has helped reduce the trading costs of the AUD/ZAR pair across all timeframes. The highest cost in the ECN type account has been reduced from 169.49% to 135.59%.

Categories
Forex Assets

The Untold Story on VXX Trading That You Must Read or Be Left Out

For years we have had many interesting products which have allowed us to operate all kinds of volatility assets, even if they were comparatively young products. Understanding these products well has always required a little study time. On the other hand, improper management of these products could lead to increased risk, so traders should know exactly what they are doing.

So, think and test your strategies beforehand and fake everything you can into a demo account before using real money. The VXX, which we will analyze in this section, is by far the most volatile product with nearly $1 billion of assets under management. It is presented as a structured fund (TNC) and has a total expenditure of 0.89% per year.

The VXX can be marketed as a share and is also the underlying of a number of options. The product has existed since 2009 and since then has generated one of the most impressive charts among any of the financial instruments. As we noted, it is obvious that this product should not be considered in any way as a long-term investment, but as a bargaining and hedging instrument.

The decisive factor is that the VXX is not directly related to VIX, but to VIX futures. In previous articles, we have already presented in detail the fact that the movements of these instruments may deviate from each other in some cases. The configuration of the loss limit also depends on account size and personal risk, as well as money management.

Long or Short?

Given the obvious downward trend, the question arises as to why someone wants to go long for a long time. Additionally, it wouldn’t be more affordable for you to cut short a lot of times? The objective of long positions is to benefit from strong increases in volatility, which can multiply the value of the VXX in a very short time.

Since such increases in stock market volatility are accompanied by crashing, we will have effective coverage against price losses. However, this type of coverage becomes quite costly over time, as sufficiently strong volatility increases occur more rarely and the VXX slowly but steadily loses value the rest of the time.

The objective of short positions is the opposite: If there is not a sharp increase in volatility, the VXX decreases in value slowly but steadily, so we accumulate profits if we have a short position.

The problem is this: While the losses are theoretically unlimited in an increase in volatility, as the price can go up to very high, the gains are always below 100%. In addition, the exposure decreases with the fall in prices, so, in absolute terms, we will have less and less profit. Similarly, in the case of making a profit, new short positions would have to be taken in order to keep the initial risk constant. And we haven’t even said that it can be difficult to find a broker who can easily allow us to take short positions in the VXX. Strong increases in volatility can multiply the value of VXX in a very short time.

  • Where do the losses come from?
  • Could the VXX cause large losses?

To do this you must first take a closer look at its construction. The VXX is composed of a combination of VIX futures contracts in different periods, before and after, whose units depend on the maturity of the contracts. This composition changes

daily at the expiration of a small part of the previous month and purchase contracts for the following month. In particular, a separate index is constructed for this purpose (symbol: SPVXSTR), which is mapped to the VXX. It is very important to warn that these changes are made on the basis of a neutral strategic design so that the VXX does not lose value because during a contango situation – in which the lowest value futures are sold and the highest value futures are bought.

The real cause of the long-term price decline is the so-called contango loss. Which describes the predominant deviation of the curve forward to the lowest VIX. Because if these low VIX values persist until the end of the respective front contract, the final settlement will occur at that level. Let’s take an example, consider the following situation of a steep contango:

  • Current VIX: 15 %
  • Future of current month VIX: 18 %
  • Future of next month’s VIX: 20 %

If VIX remains at a low level until futures expire, the value will be lost continuously. Assuming that the VIX is maintained at 15 % until its maturity in the current month as well as in the future, then the losses will amount to 17 or 25 %. Although the structure of the container is rarely so pronounced, losses accumulate continuously as long as there is no significant increase in the volatility or reversal of the feed curve. Because contango prevails, the VXX will lose its long-term value. Certainly, everything becomes evident at the time we realize that, since 2012, the VXX has received around $6.5 billion, according to the money flow tool of www.ETF.com.

At the same time, we could say that a fortune of just under a billion US dollars is invested in the VXX. This means that around $5.5 billion of assets have been lost in the last 6.5 years. Vance Harwood adds another interesting aspect: If the issuer Barclays Capital were not fully covered, but for example only 90%, it would mean that we would get a good additional income of up to $550 million in addition to the management fee during this period.

Conclusion

VXX is a fascinating product with an unmistakable long-term trend. Despite this, and as is obvious, it is surprisingly difficult and very risky to try to make long-term gains with this product. While the long positions will often fight against the weight of the contango, for the short positions, the sword of Damocles hovers before a rapid and sharp increase of volatility and always on the slow gains that otherwise would be quite regular.

Categories
Forex Assets

Shocking Facts About the GBP/USD Currency Pair

The UK and the USA always had a great relationship and similar economic views. Combining the British and American does not come out as great according to certain technical prop traders. The GBP/USD pair has some special characteristics as the third most traded currency pair. Being a very popular trading choice is not a reason for a highlight alone, even some cross pairs such as the AUD/NZD have special price action.

According to our prop trader, GBP/USD has some nuances trend following systems might have trouble with. We will focus our attention on the basic things to know about GBP/USD trading based on some very different opinions by traders, why to pay attention to additional factors on this pair, and certain trading measures. 

GBP/USD has a lot of similarities to the EUR/USD currency pair which is the worst pair you can trade described in our previous articles, according to technical traders’ opinion. Beginners should avoid the EUR/USD pair – this is certainly the opposite of what you would otherwise hear on the internet or trading books. If you are not familiar with the contrarian trader view, this is the asset most people are trading and where the big banks intervene frequently. What is even more surprising is some traders just trade this currency pair even if it does not have special advantages, the liquidity or spreads should not be a really important benefit. If we compare the two pairs we can notice they are in the top 3 most traded pairs, and both have the USD counter currency. 

The USD is the most manipulated currency yet the GBP is not far behind, it is one of the largest currency trading countries in the world after all. GBP/USD is also more volatile than the EUR/USD. Volatility is not always a bad thing, except for the scalping strategies, trend following strategies need volatility actually. Strategies, as explained in our previous articles, are volatility adaptive, making them universal to any asset. Another key characteristic for both currency pairs is USD driving the bus. In other words, the percentage change in the price or the pair is caused by the USD movements for the most part. Experienced traders know these pairs do not offer much for diversification, it is like trading the USD alone and the USD is the playground of the big banks and news events. 

About volatility, the GPB pairs are generally the most volatile if we do not count some exotics. Having a system that adapts your position sizing and protective orders accordingly to the volatility of any pair clears the risks related to it. However, expect bigger moves from GBP/USD than with EUR/USD. Interestingly, GBP/USD is also more sensitive to the news events according to measurements. Since the USD is included, events are frequent. Now, some events are more important and we are not talking just about the impact levels marked on calendars, but about the measurements each event caused the currency to move a lot. The measurements like this are not very popular, they are offered on some statistical websites for a fee, but are easily found.

You may notice if you are trading on a daily timeframe, some events are not meaningful even when regarded as highly important on calendars. As a trader, you will have to adapt your trading plans for the GBP/USD since it has peculiarities. Our technical prop traders avoid news events, so unless you have consistent results from trading the news we recommend avoiding them too, you have no control over how they are going to affect the price. Know that except for the USD, the pound is the most sensitive currency to news events. The reason comes from news aware, educated traders that react. 

Since the GBP/USD has this combo of a big mover with news event sensitivity, traders should trade this pair as they would the EUR/USD. It becomes a pair that comes after all other signals. In other words, if you have a signal from your system on EUR/GBP, and GBP/USD, do not split the position risk, trade the EUR/GBP, and ignore GBP/USD. The nature of GBP/USD increases the risk you cannot avoid if you trade it. Our articles cover some of the crosses not involving the USD so you may consult them for specialties on these currency pairs. If a system shows only the signal on GBP/USD, trade it but with reduced position size, as our prop trader recommends. 

Brexit poses a special uncertainty for the GBP, consequently also on the GBP/USD. Interestingly, EUR/GBP is still a good choice, but the GBP/USD does not follow the same system-friendly moves. Trends here are choppy, whipsaws often, and unpredictable effects ruin what you might have gained before. The events from Brexit come out of nowhere, a speech or announcements by the banks or political tensions hits the price action line like a stone drop. In 2019 the forex was pretty flat. To some opinions, the Brexit caused some much-needed volatility, allowing for trend following systems to re-engage trading, at least with reduced risk settings.

Nevertheless, caution requires us to follow the events and portals we usually do not have to if you follow our trading strategy example, also pay attention to other markets in the UK and the USA. The Brexit could be over in 2020, however, the effects and lessons from it should remain in the traders’ heads. Every country experiencing any similar long term, eventful turmoil causes the country currency value erratic. Whatsmore, the COVID-19 implications on the GBP are even more severe than in the USA if we look at the economic and pandemic measures.

When we try to make predictions, we are dealing with a very low probability we are correct. Traders that use technical trading systems do not like to predict price movements, especially not in the long term. Investors rely heavily on the fundamental analysis and they commonly make predictions based on the data, yet they react only when the results of Brexit or COVID-19 are clear. Right now the markets have multiple factors – COVID-19, Global trade war tensions and measures, very low maneuverability space left for the central banks, and an economic wave on the decline, signaling another world economic crisis. Markets never had all these very important factors at the same time which is not clearly evident on the charts. At the moment of writing this article, equities are near the record high like nothing is going on. 

The selloff on a larger scale in the equities and risk-on currencies are now very easy to trigger, posing a great opportunity for cautious forex traders. GBP is considered a mix between risk-on and risk-off currency, but nowadays a rare choice in a risk-off environment, while the USD is a risk-off currency facing presidential elections and pandemic effect. Some traders think the GBP has priced in for the worst-case Brexit scenario, the one without the agreement with the EU. This means the GBP is about to reverse but the recent COVID-19 events caused uncertainty to the point the price is actually at the right level. 

Consequently, the forex market is a bit low on volatility, as well as the equities, as before the storm. The US presidential elections are on the way making 2020 one of the most interesting years for analysis. The EUR has not priced in for Brexit, investors seem not to care about the UK-EU relations and focus on the internal struggles of the Union. The EU is facing serious doubt in the pillars that hold it together, this was especially evident during the COVID-19 pandemic where every country fought for medical supplies over other EU members. 

All things considered, technical traders do not make decisions based on these fundamental events but react only when the move on the market actually happens. However, there is an indirect pre-reaction. To conclude, GBP/USD is a more volatile version of the EUR/USD and with more news events, traders adjust their risk management accordingly. On the other hand, GBP cross pairs are great movers with quality trends. Additionally, Brexit and other major factors need to be considered and avoided, trade the GBP/USD only If there is nothing else to trade and do it with half risk. If you test your systems on this particular pair, compare the results with other GBP pairs. Systems that generate good results on EUR/USD and GBP/USD for a longer period could be worth keeping and perfecting.