Introduction
Markets behave as a fair-price searching machine. When there is no consensus about value, caused by an economic event or some other news that might affect the current fair price, market forces launch a new trend, which starts moving the price toward another “fair” level.
And the rest of the time, when the price is already at a consensus “fair price”, what happens? Does it stay at a single price point until a new event shakes it?
Nature hates stillness and rest. It seeks movement -Any kind of movement- and the markets do, as well. Therefore, as we all acknowledge, price does not stay still just because everybody on earth thinks this is the fair price. The fact that there are zillions of market participants, every one of them with its own opinions, makes it impossible that a fair price exists at all. As Jesse Livermore stated, the two most significant market forces are greed and fear, and, consequently, they exert their pressure on prices, too.
Therefore, when a market lacks impulse to continue a trend, it tends to make oscillatory price changes, although the fact that traders are using different time frames, price targets, and stops, makes this oscillation quite complex, with multiple cycles blended on an intricate and, potentially, noisy pattern.
Science has been dealing with waves and cycles for long. Almost everything in science deals with cycles and oscillations, therefore, cycles are a part of markets that may be handled with precise scientific accuracy, limited only by the noisy nature of prices.
To conclude, Markets mainly behave in two interlinked modes: trend mode and cyclic mode. Those two states may blend with each other on a higher timeframe, though.
We’ve already dealt with computerized studies to help traders find and trade a trend. In this article, we’re going to analyze several computerized studies which might assist us during the cyclic phase of the market, when the markets are not trending.
Slow Stochastics
The Stochastics oscillator was developed by George Lane, who teach it during his investment seminars since 1950. According to Lucas and LeBeau on his book “Computer Analysis of the Futures Markets”, Mr. Lane has been perfecting the use of stochastics for trading over many years, and he is able to make it work well in almost any market situation.
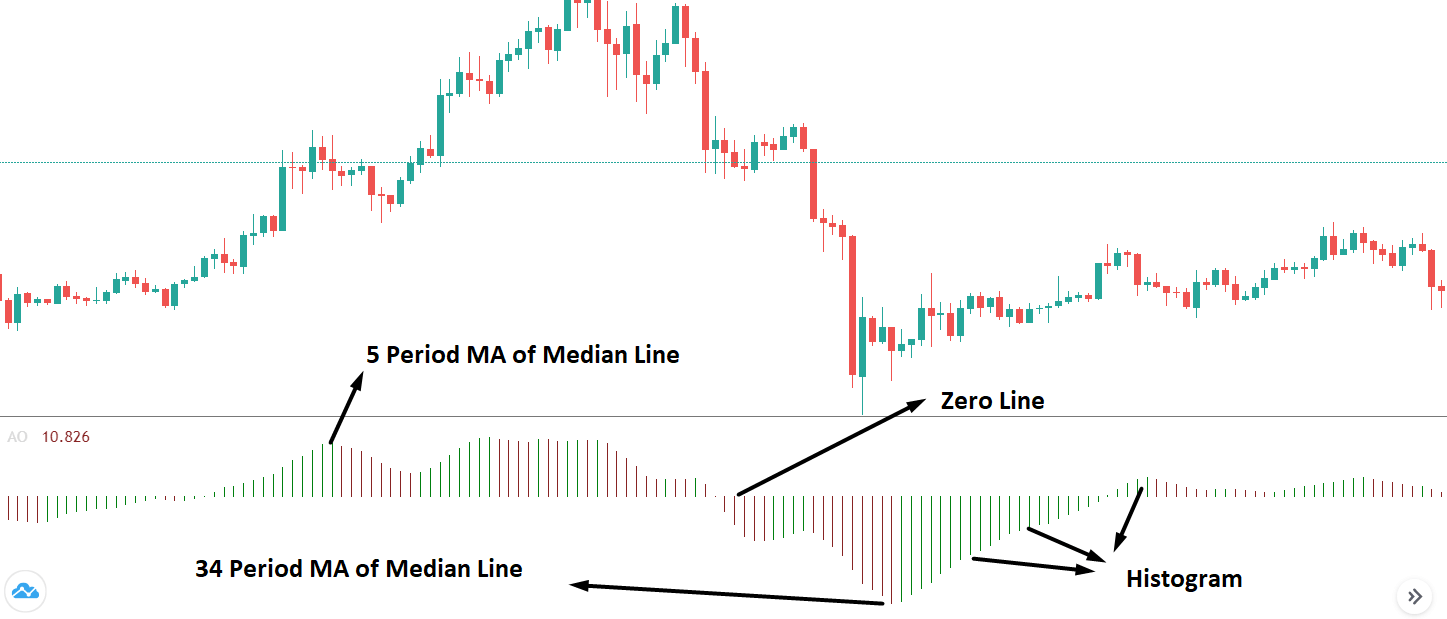
The Stochastics Oscillator, came from the observation that closing prices tend to appear near the high of the range during uptrends and near the low of the range in downtrends.
This oscillator measures where the close is, relative to the range of prices over the latest period. The %K line comes from a simple formula, which makes sure the signal is always between zero and 100:

There is a %D line, which is called slow stochastic and is computed by applying a three-day moving average to the %K line.
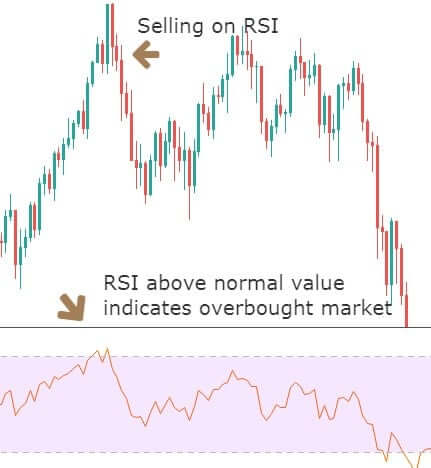
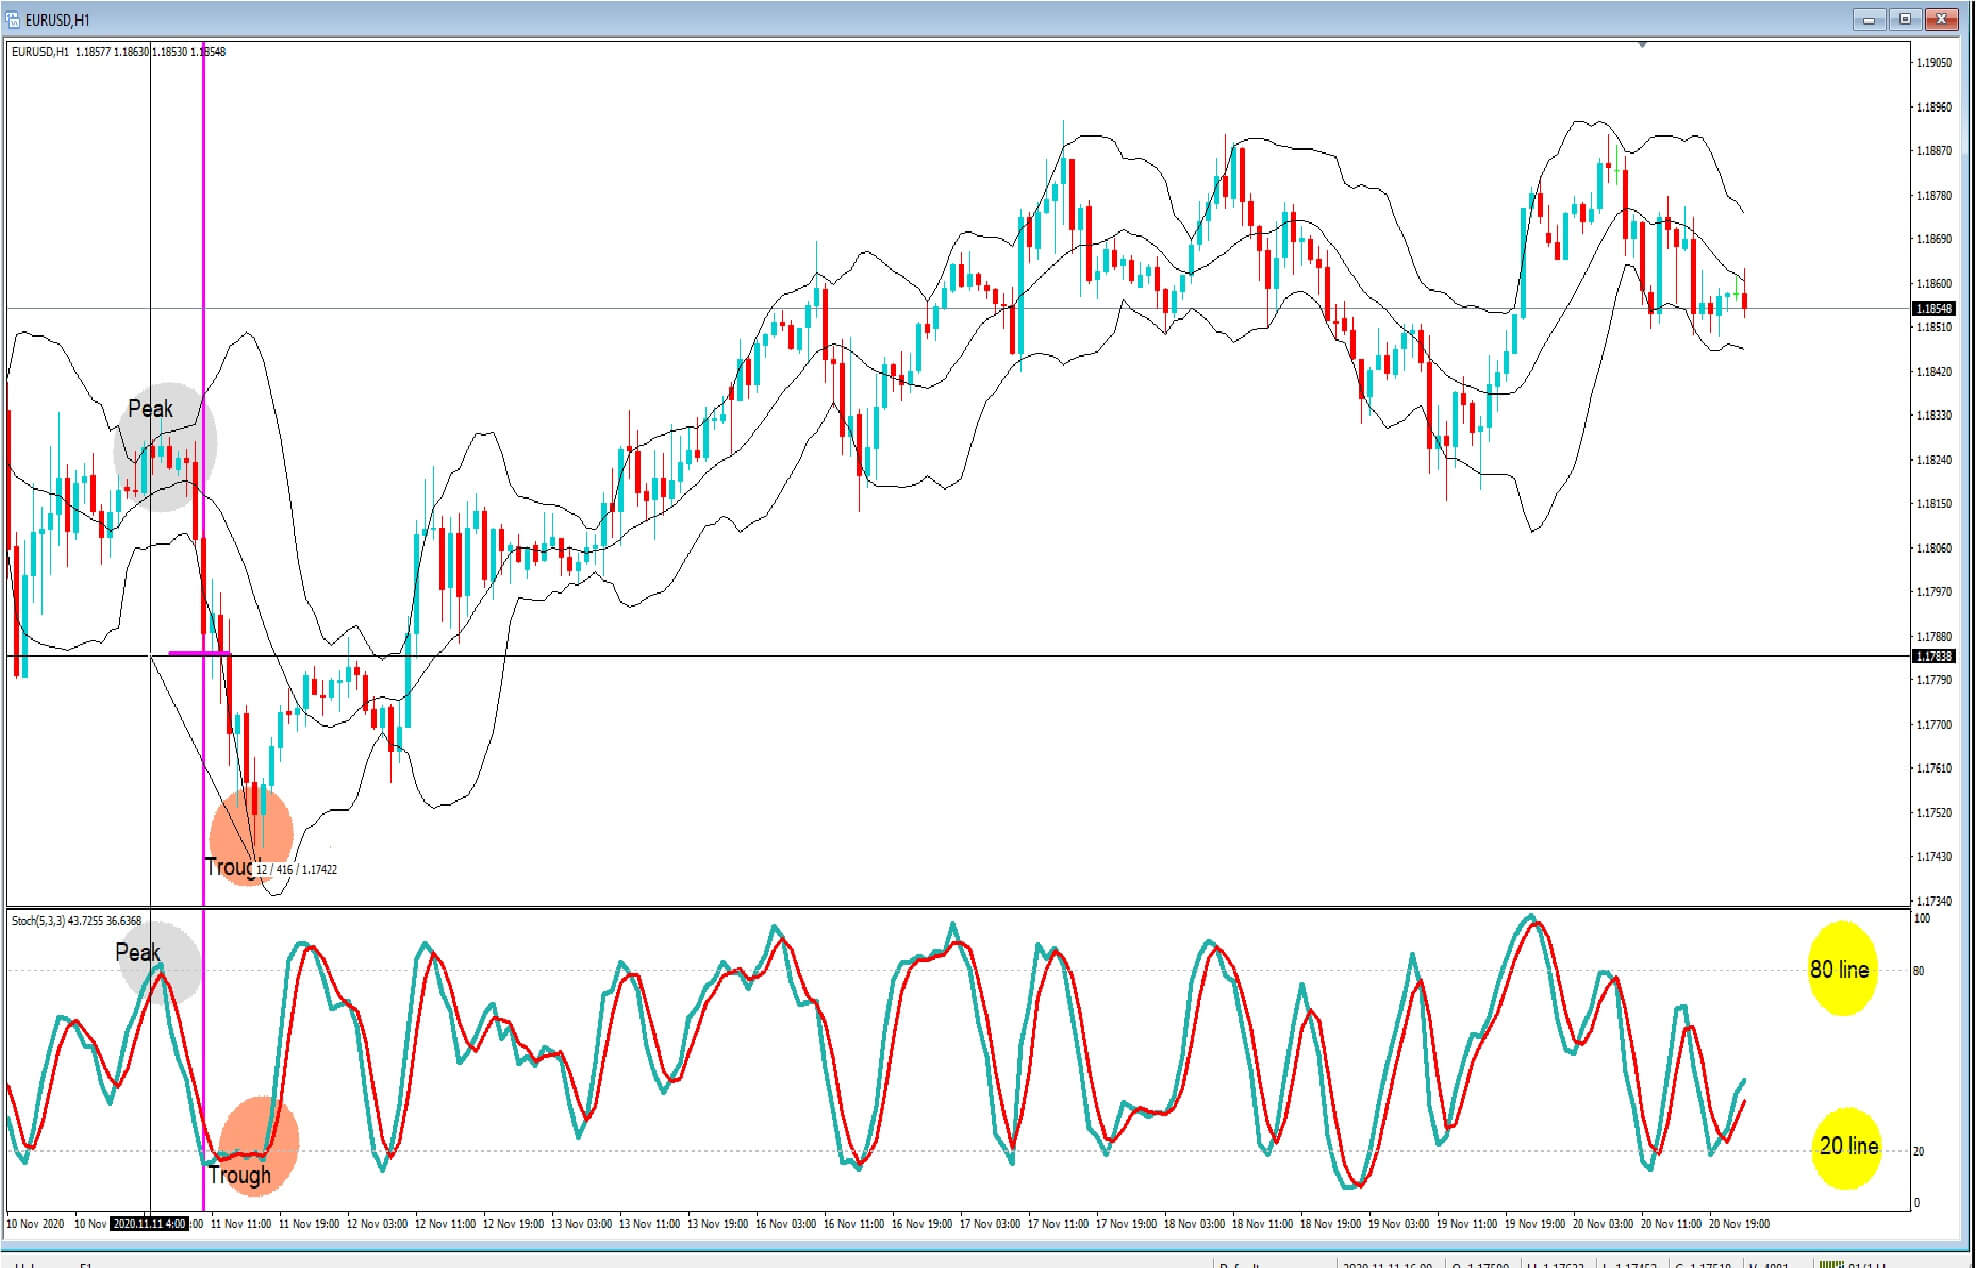
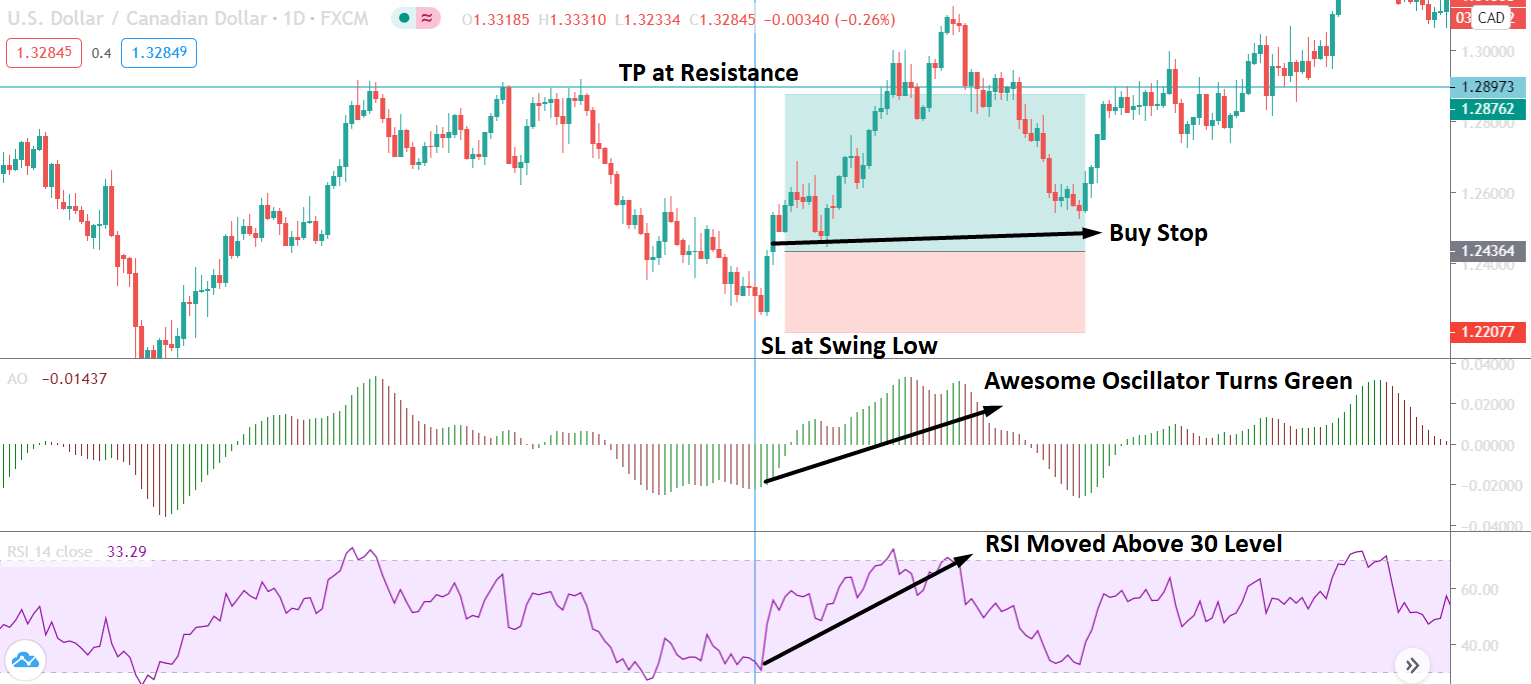
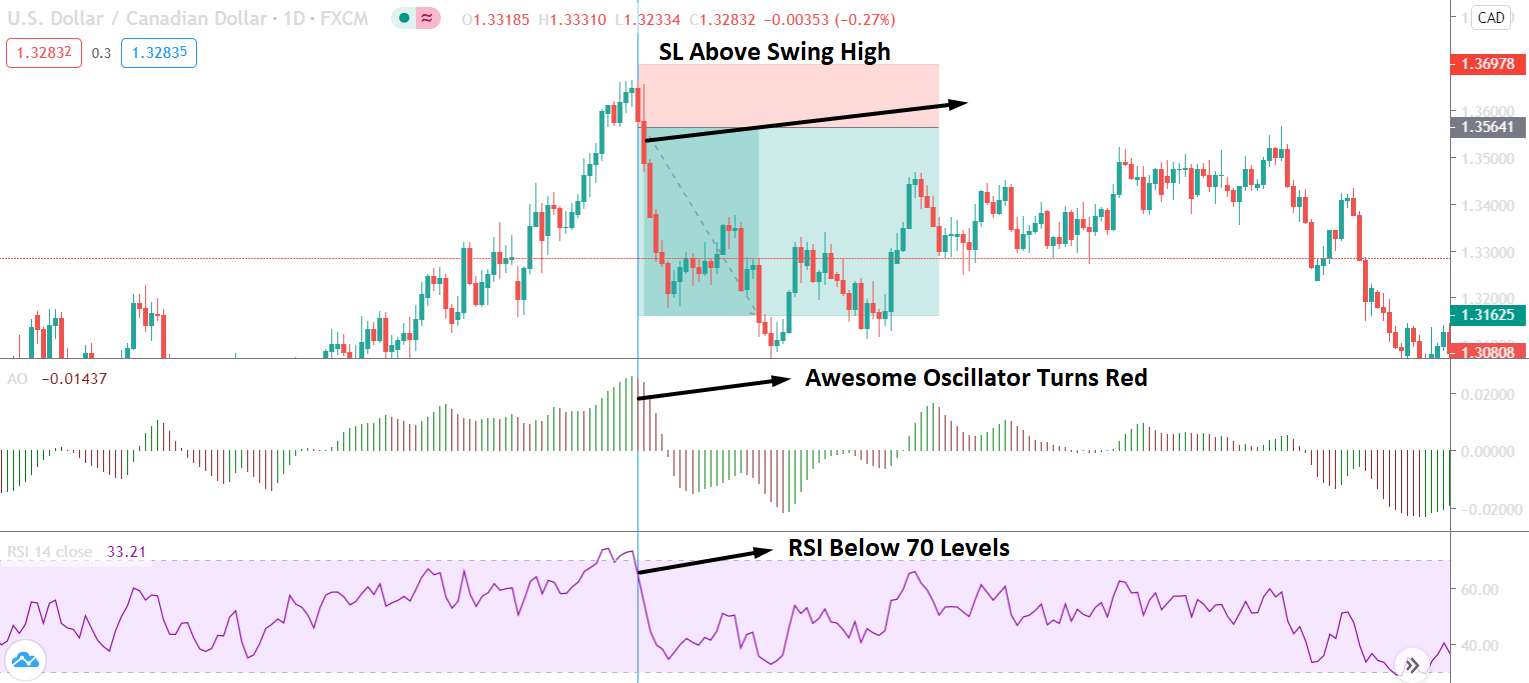
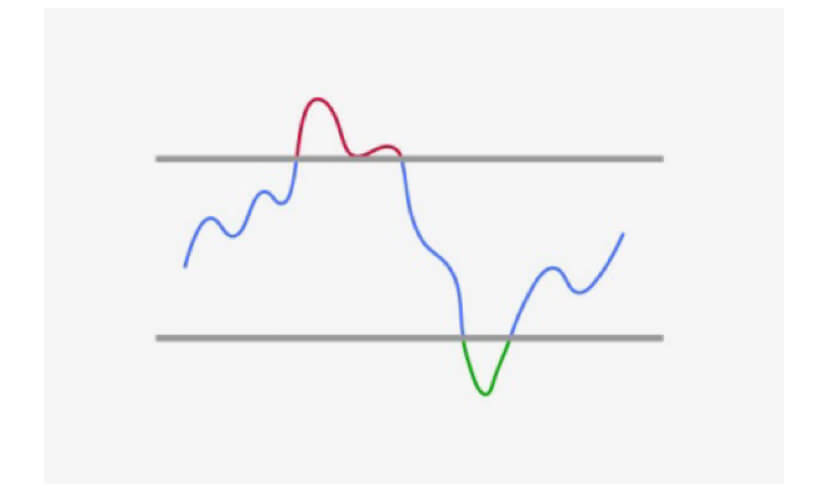
By convention, an overbought market is one that led its stochastics lines – %K and %D – above the +80 level; while a market is in oversold condition when they are below the 20 level.

The basic way to use Stochastics is by acting at %D and %K crossovers when this happens at those extremes, and when the %D line crosses – over or under- these price triggers. For example, when %D crosses under the 80 level it indicates a sell signal, and when it crosses over the 20 level, it’s a buy signal.
Periods
The standard period for the Stochastic oscillator is 14, but, according to Lucas and LeBeau, George Lane used an adjusted value of about 50% of the perceived market main cycle. Those authors said in their book that they had tested several periods, and a range between 9 and 12 were the best performing ones, as these were the best compromise between speed and validity, producing the minimum quantity of false signals.
What this tells us is that we need to experiment with the period of the signal and back-test it, to get an optimal figure for the current market we are treading.
According to Alexander Elder, if you intend to use Stochastics as your sole signal it’s better to choose a longer-term period, while in combination with other signals a shorter period is preferable.
Signals against the trend
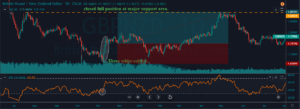
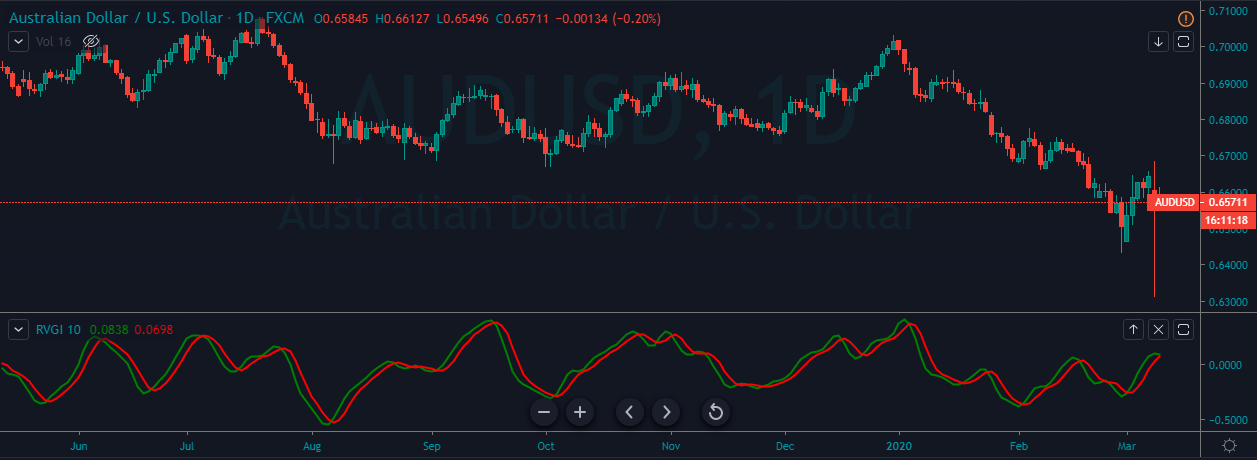
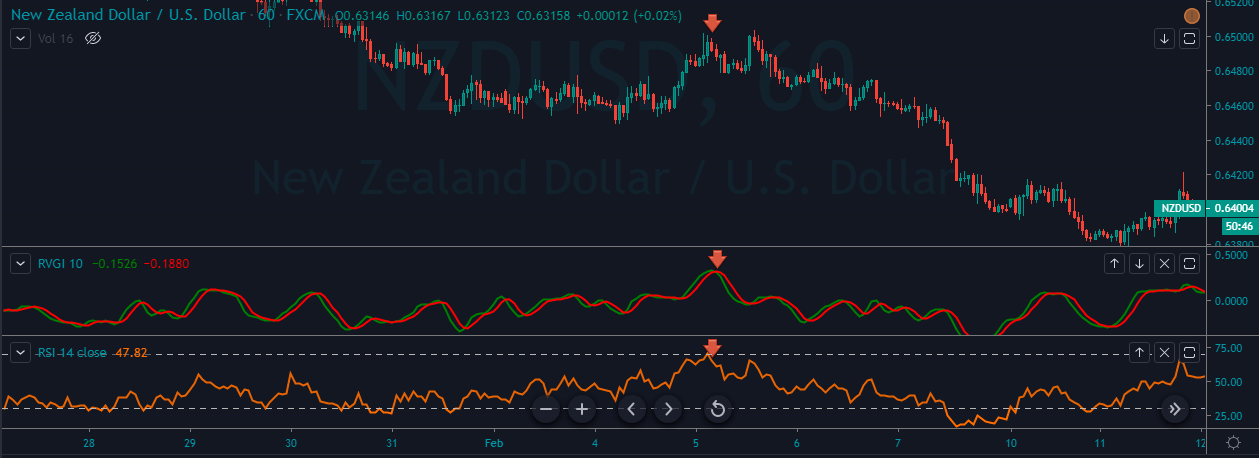
As said at the beginning, the use of this kind of oscillator is best suited to a cyclic phase of the market. When we detect a trend, the Stochastic oscillator does not perform so well, especially when the signal is against the main trend.

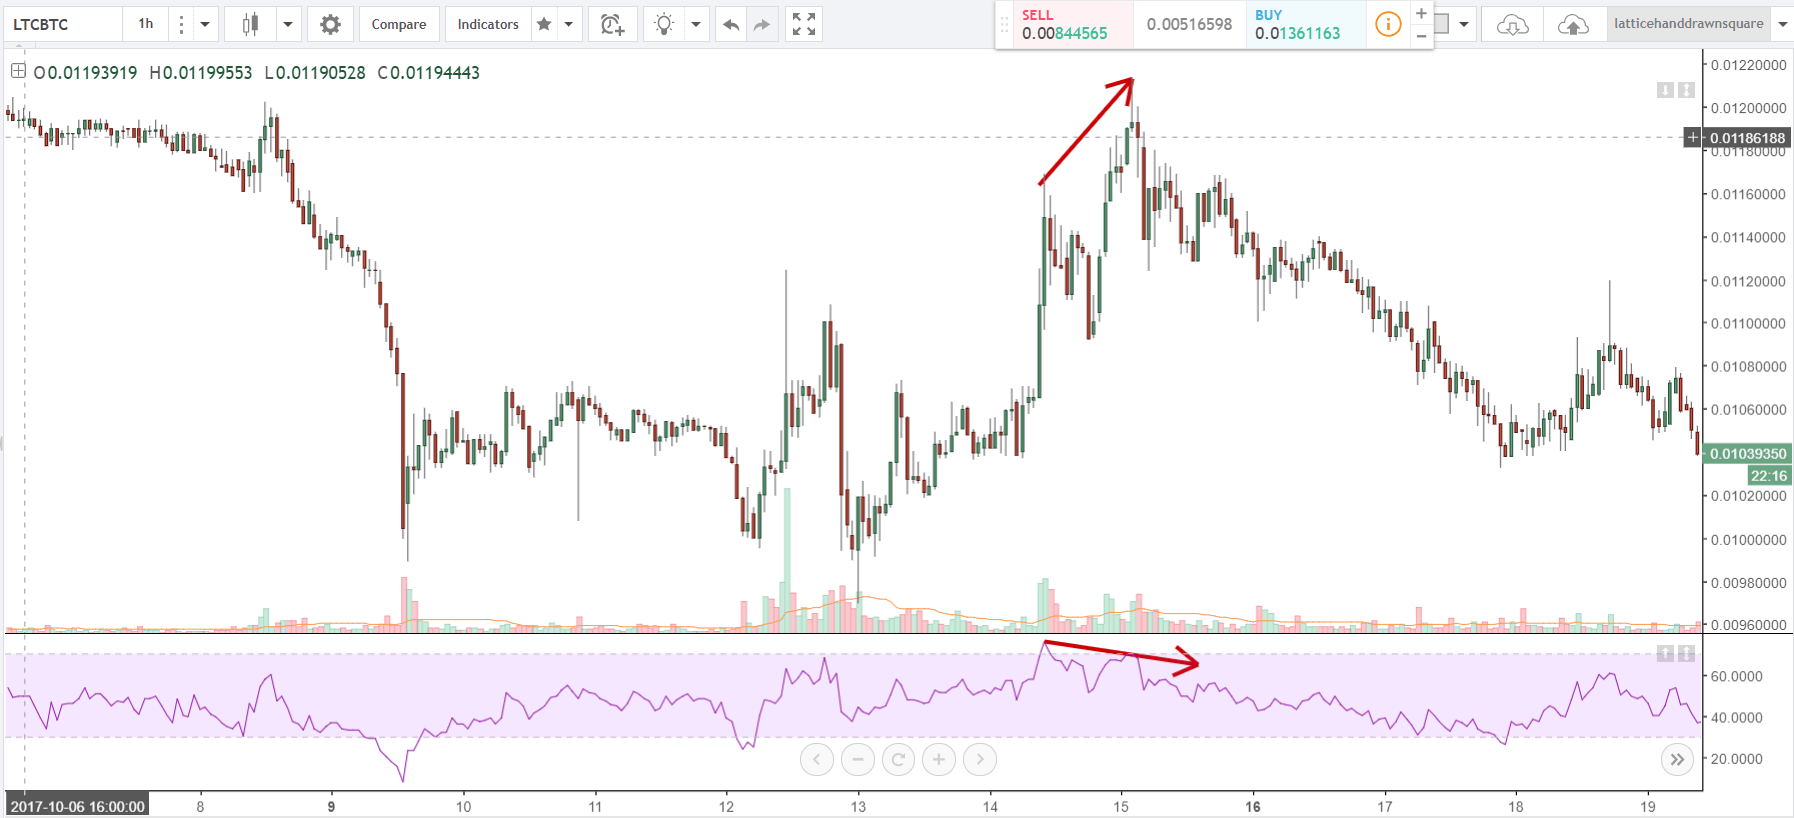
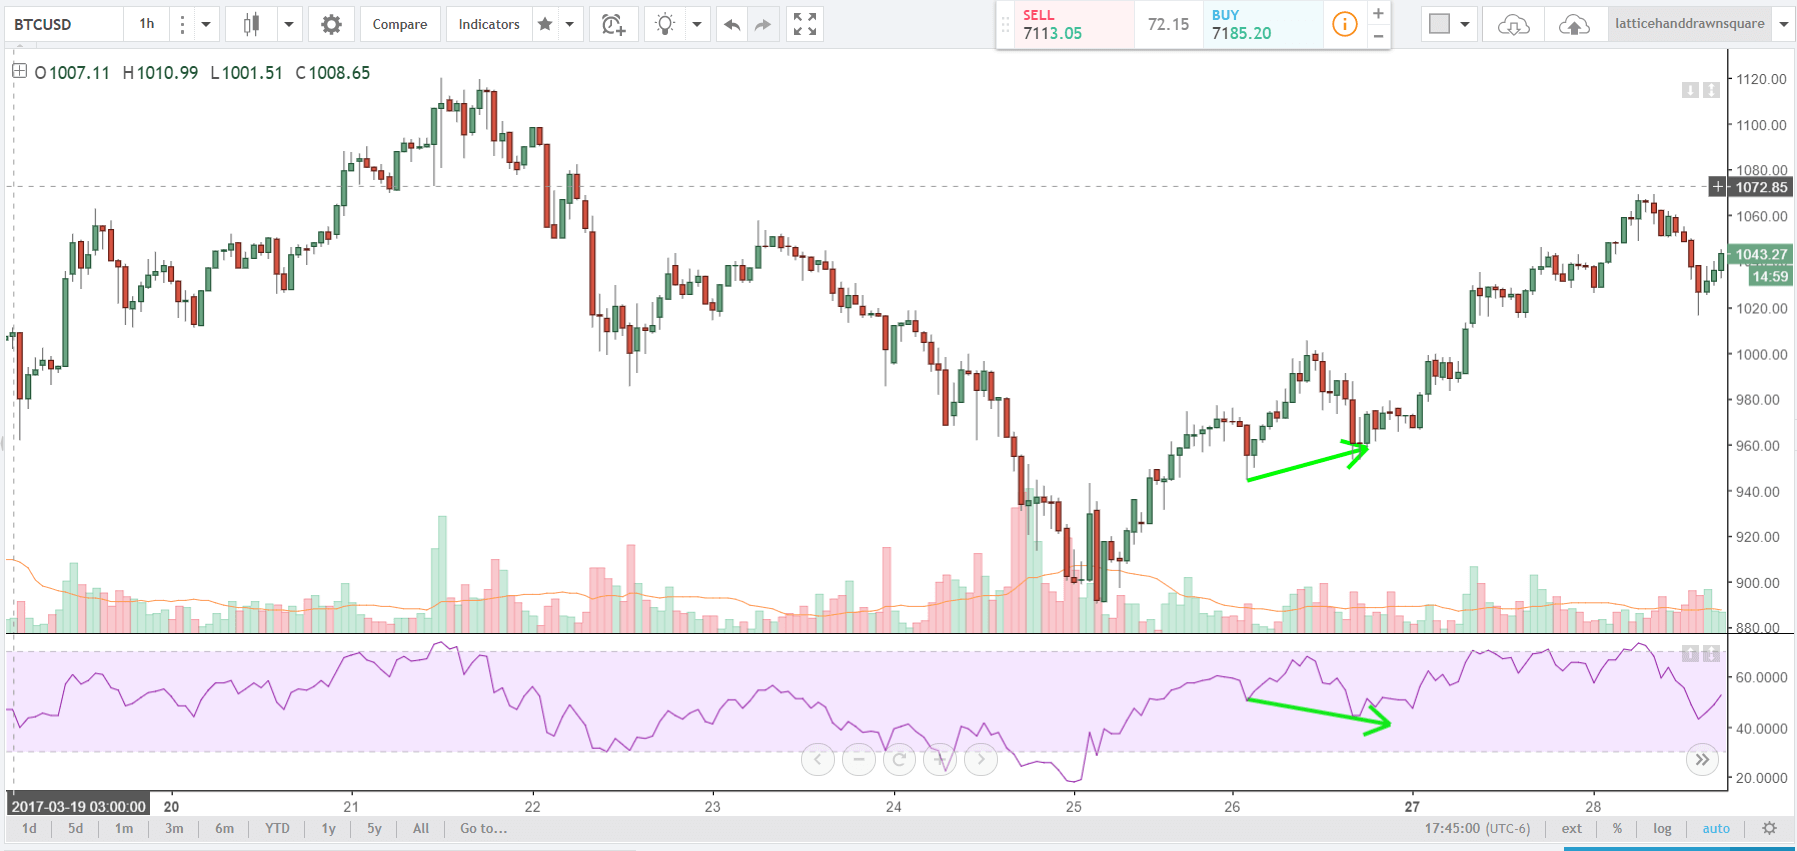
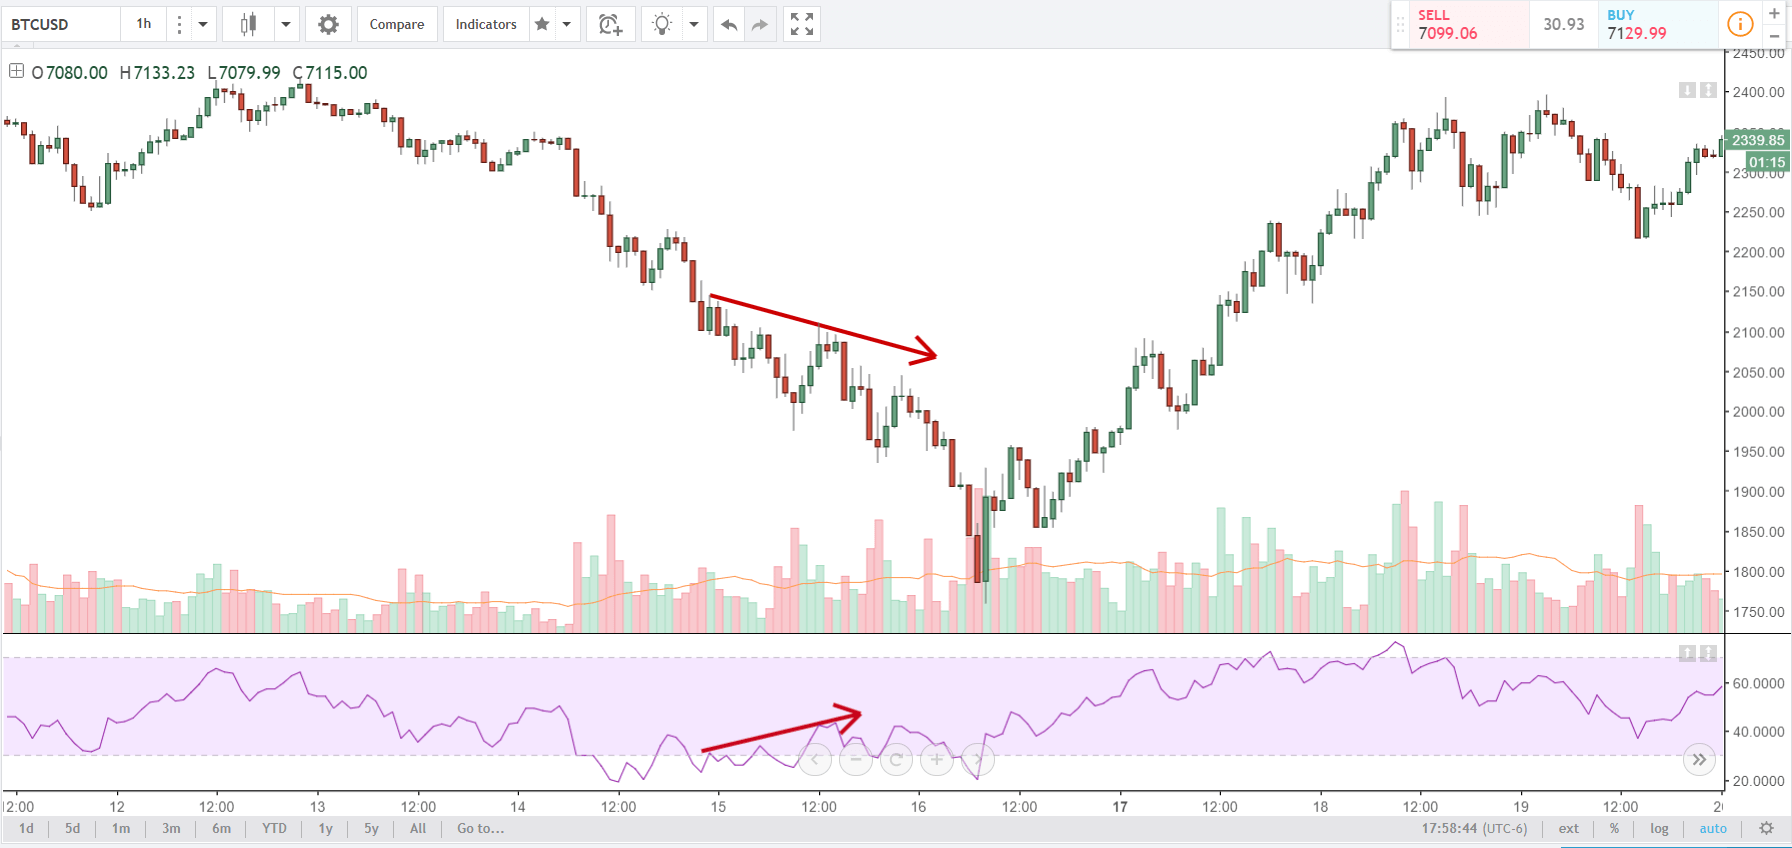
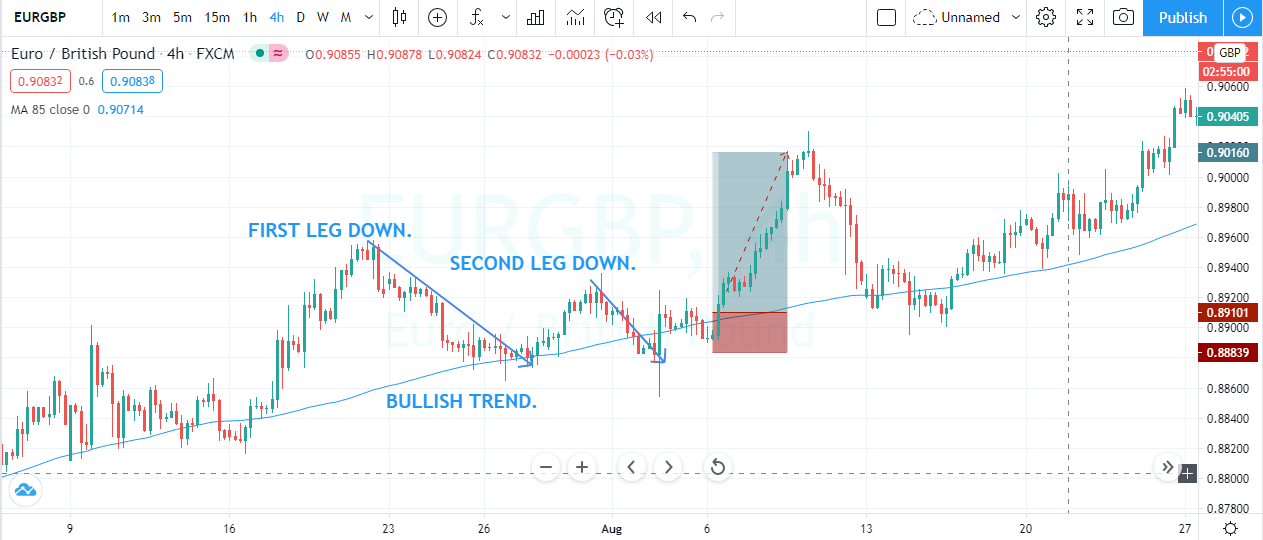
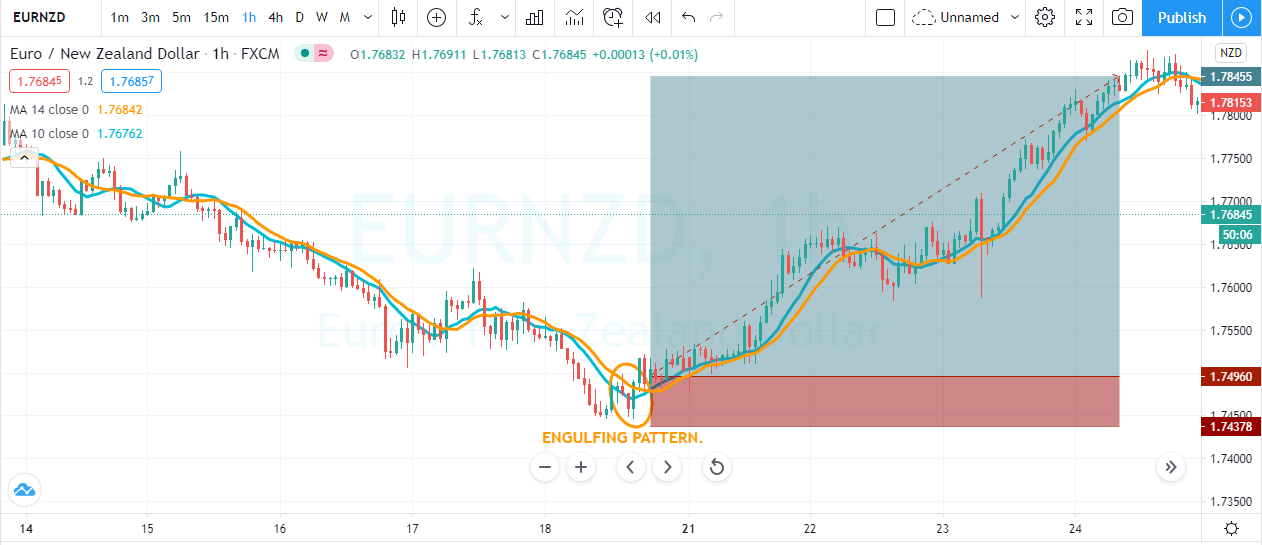
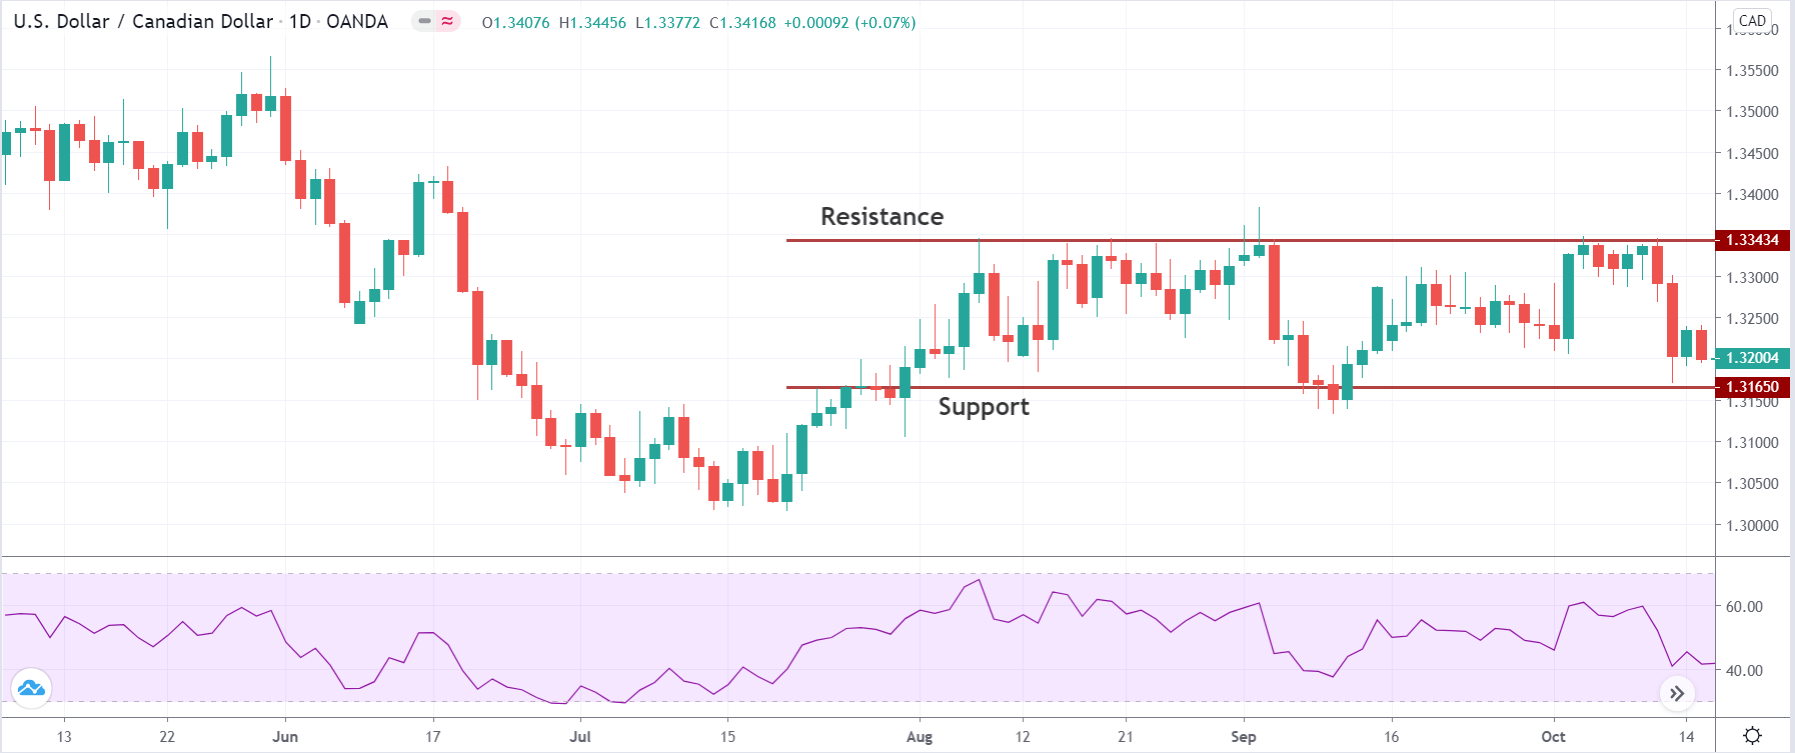
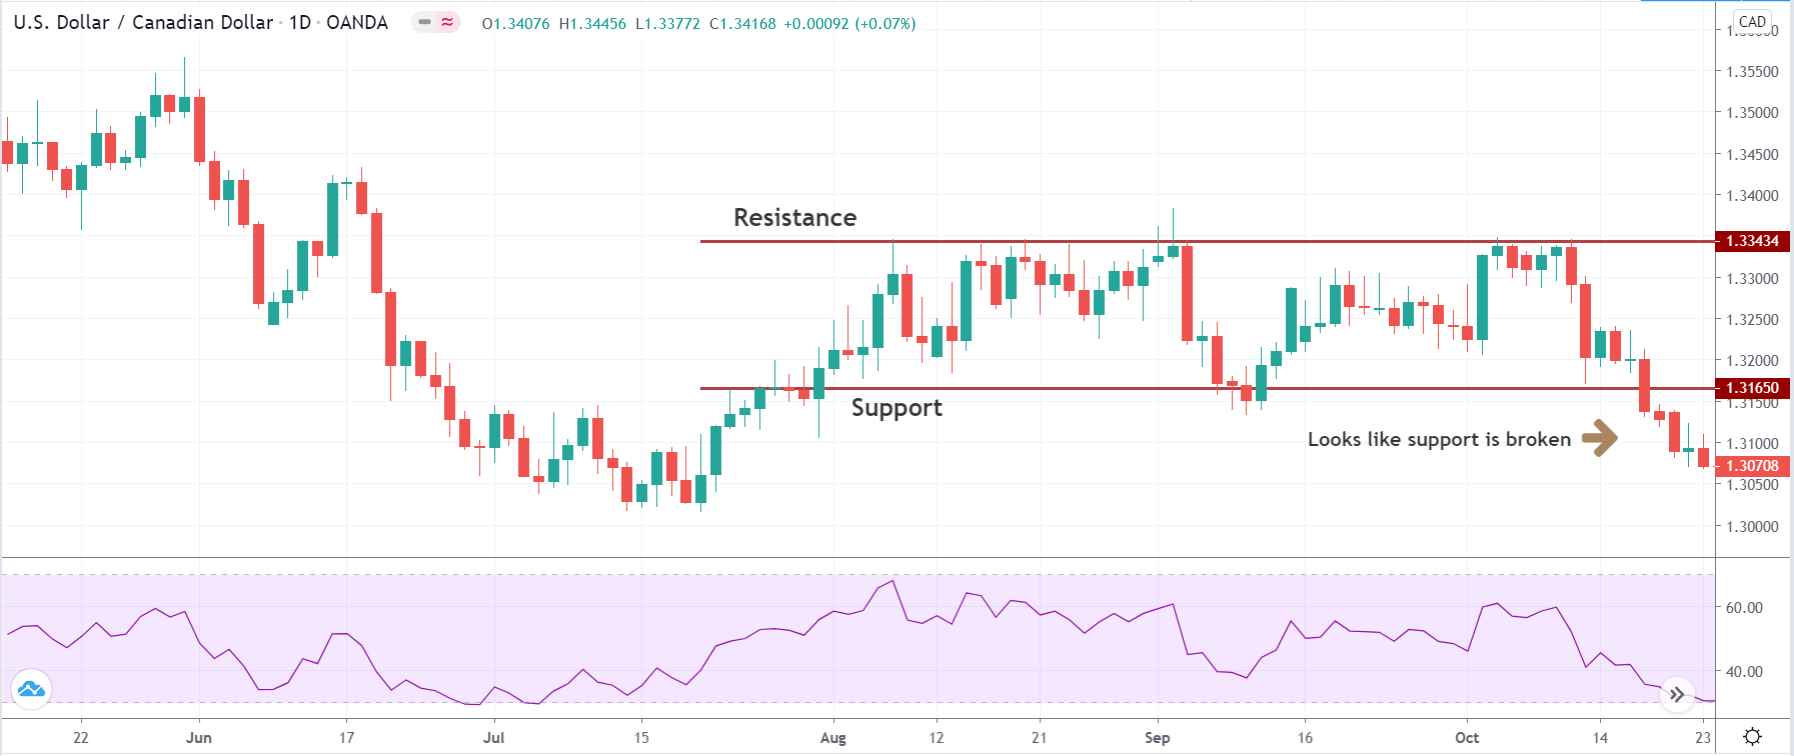
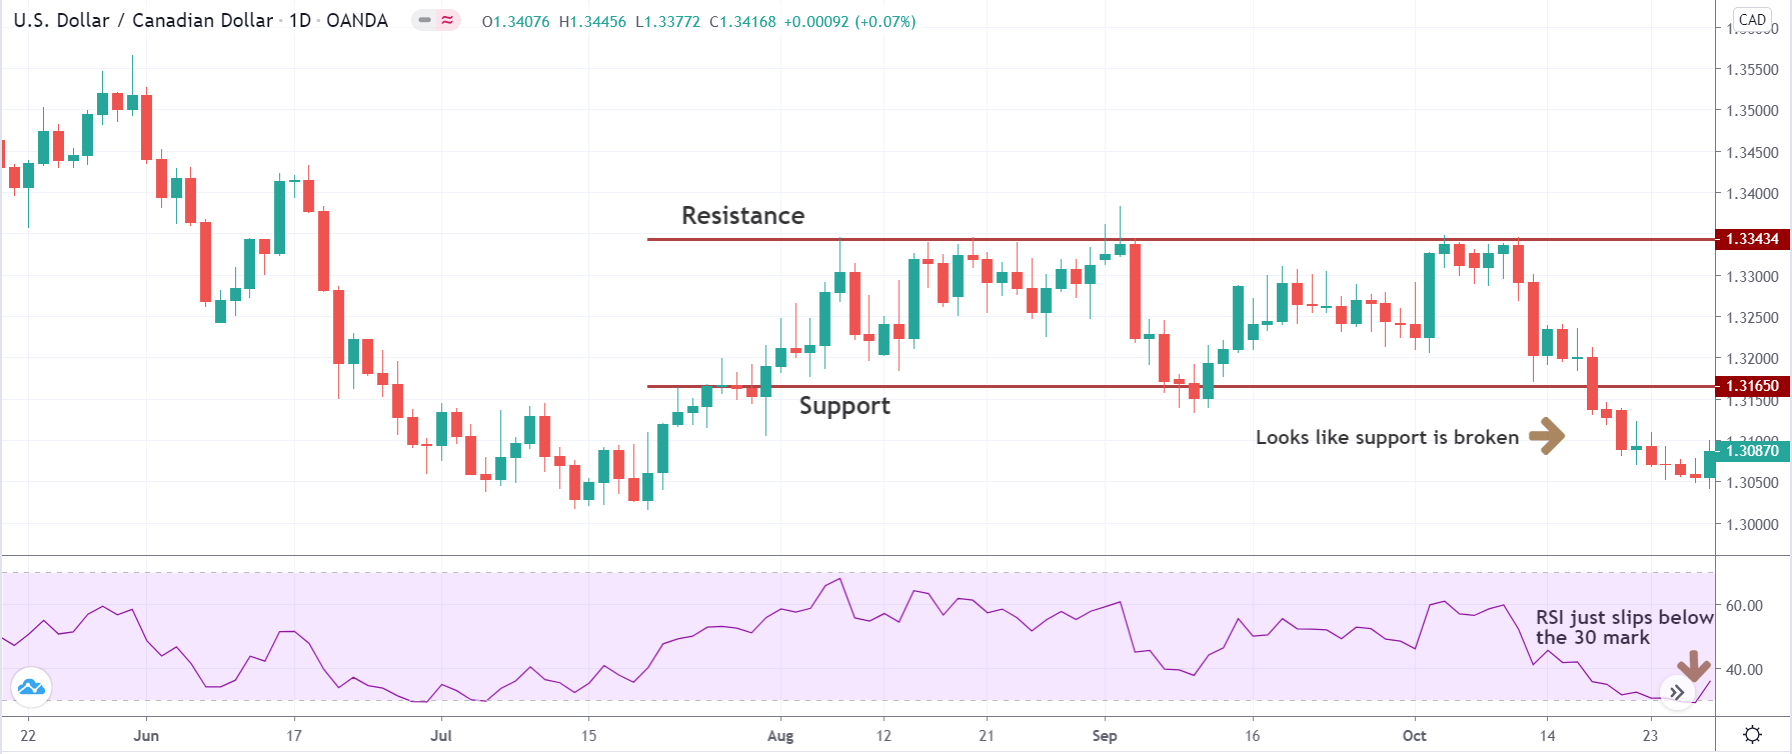
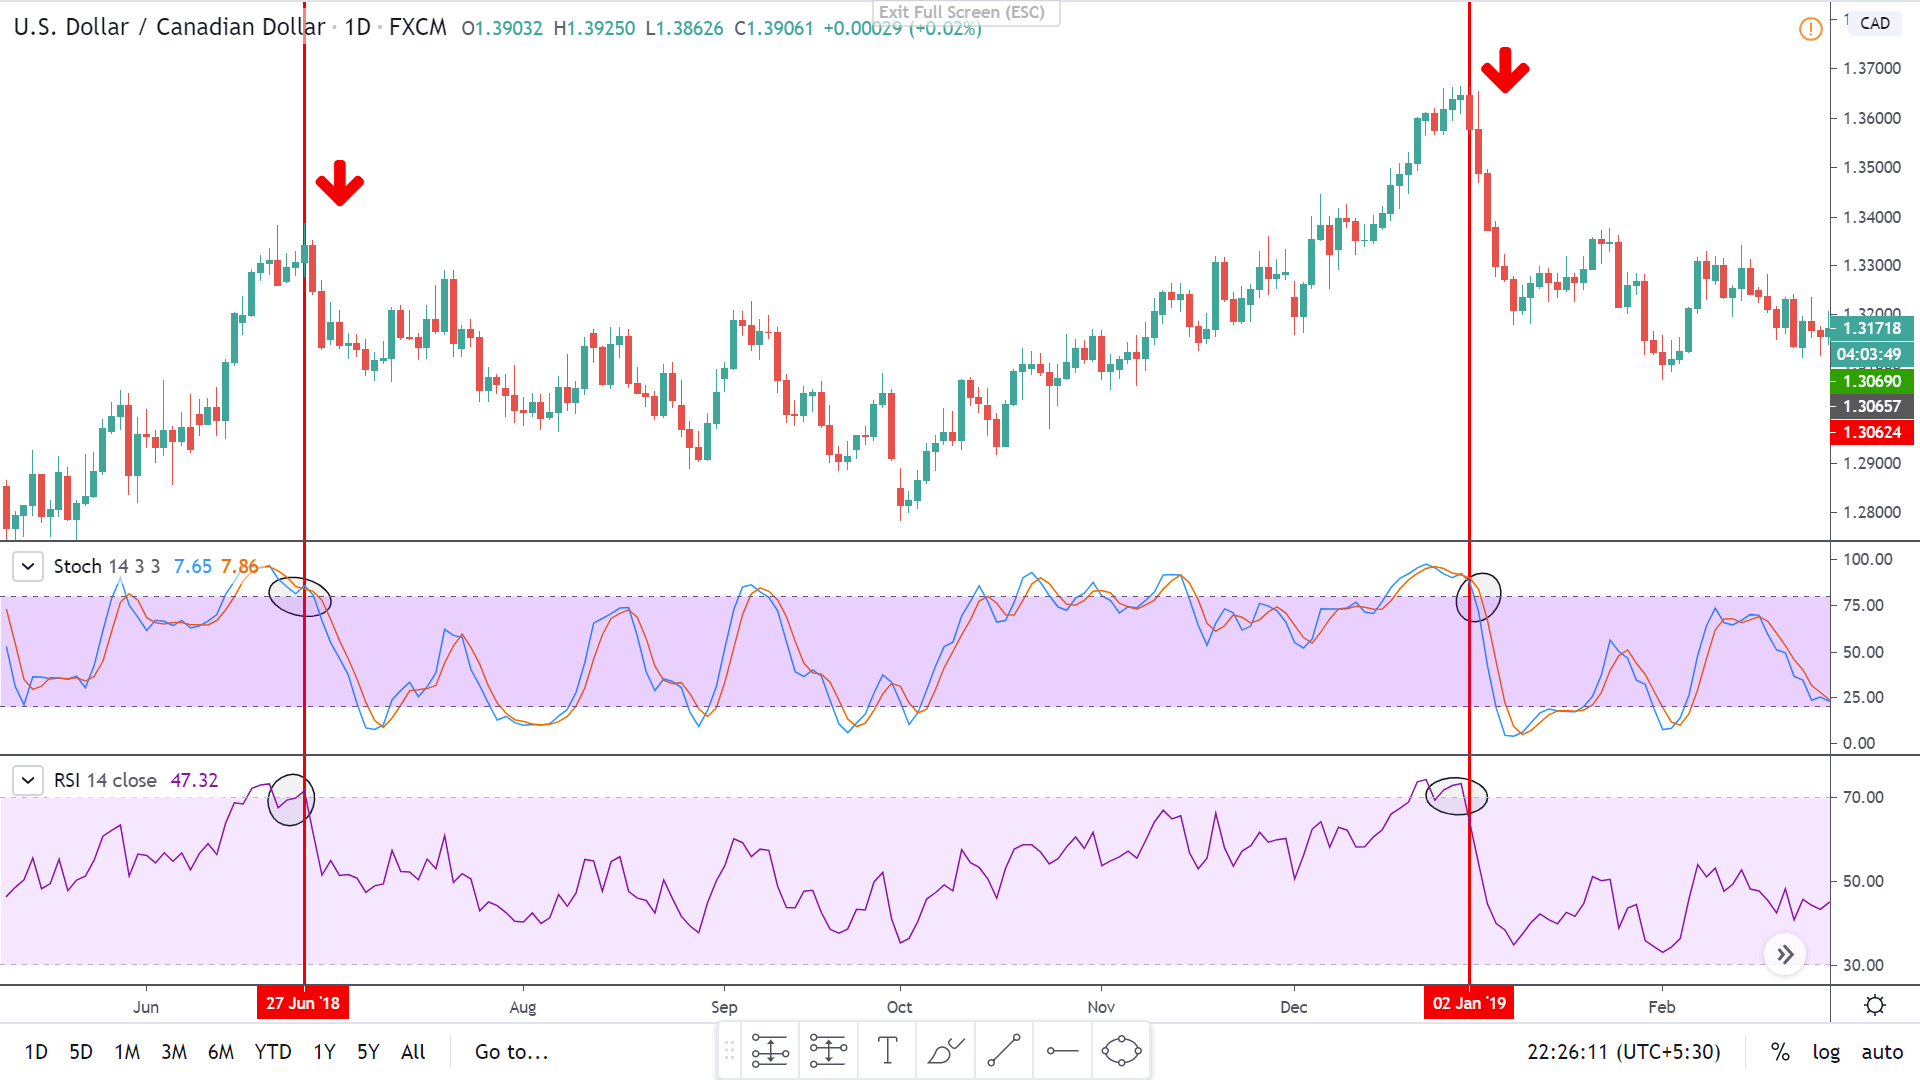
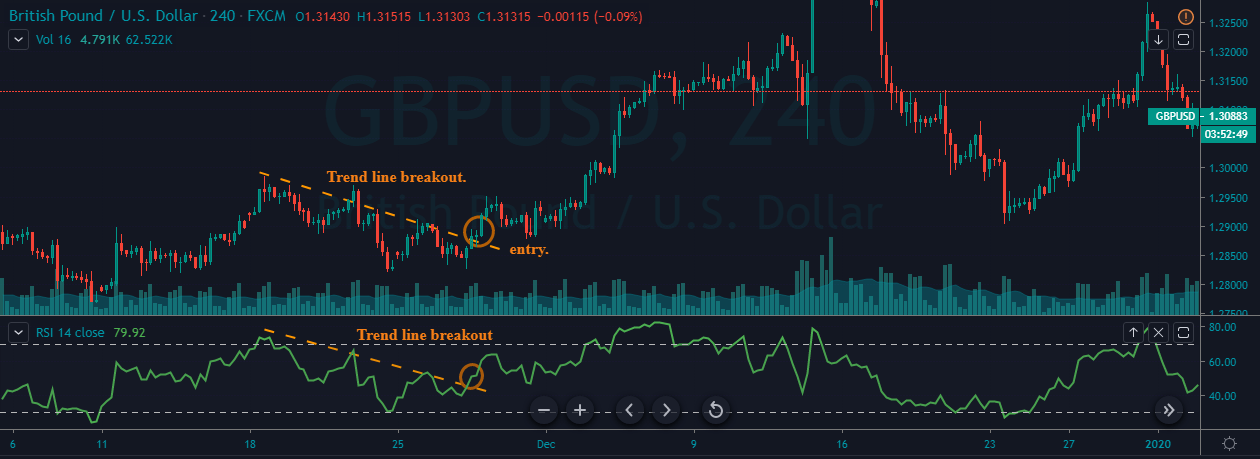
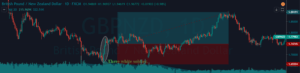
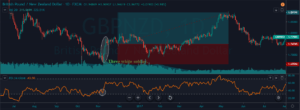
Fig. 2 shows a stochastics used in a downtrending market (NZD/YSD). We may observe that, mostly, good signals come from the overbought side of the market that trigger signals with the trend, even when those appear before %K and %D approaches the saturated region. This is common with strong trends. The market doesn’t reach the overbought ( or oversold) level before returning to the primary trend. The only potentially profitable buy signal comes at the end of this long downtrend when the oversold condition permeates several time frames.
LeBeau and Lucas said in his book: “Remember: The trader who coined the phrase ‘the trend is your friend’ was not using stochastics”.
Divergences
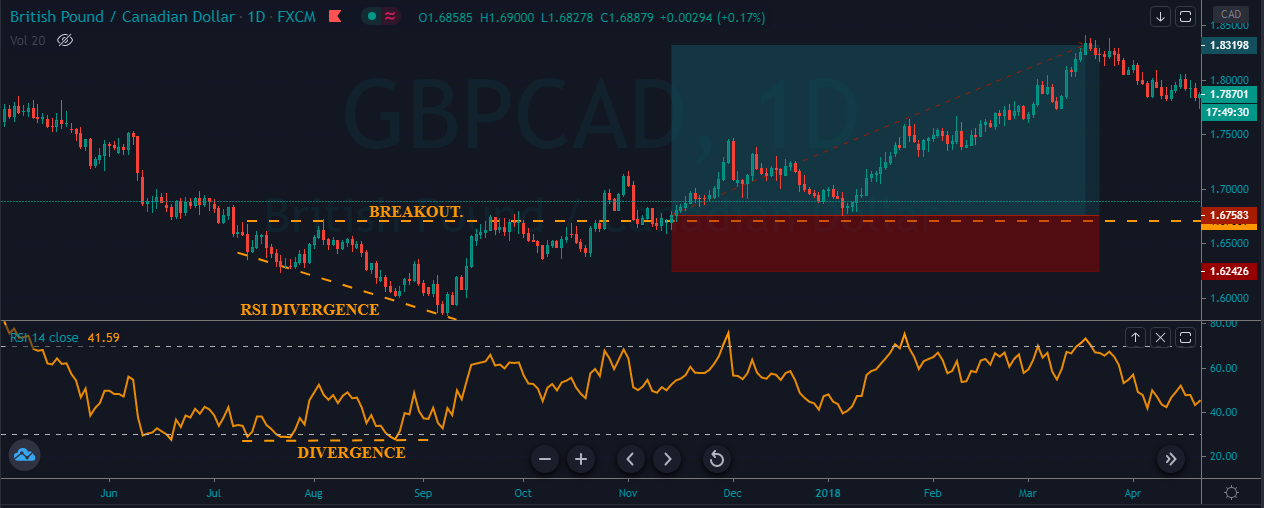
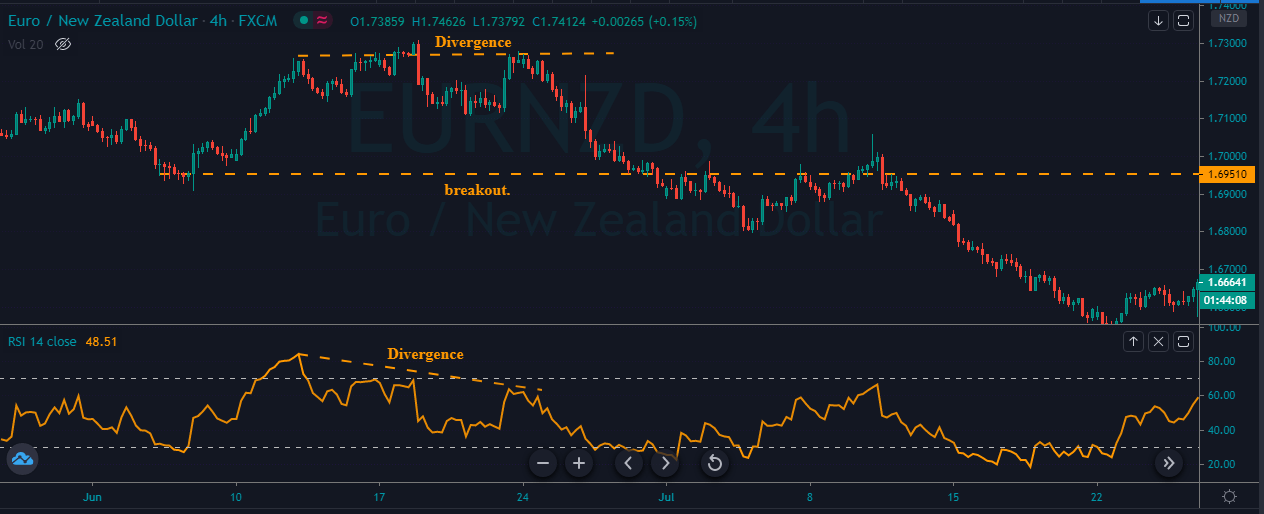
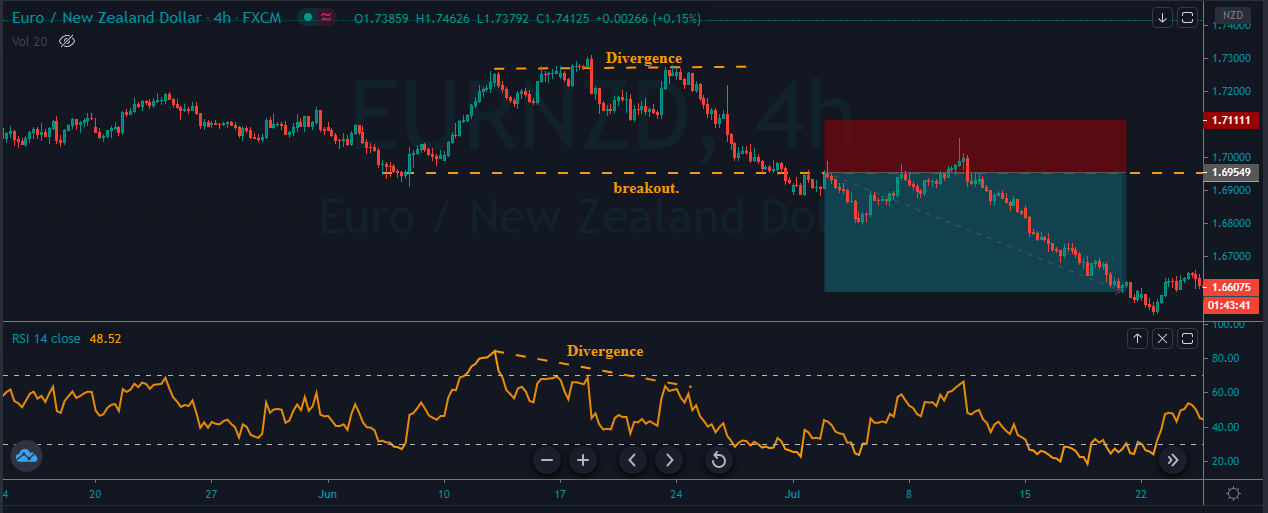
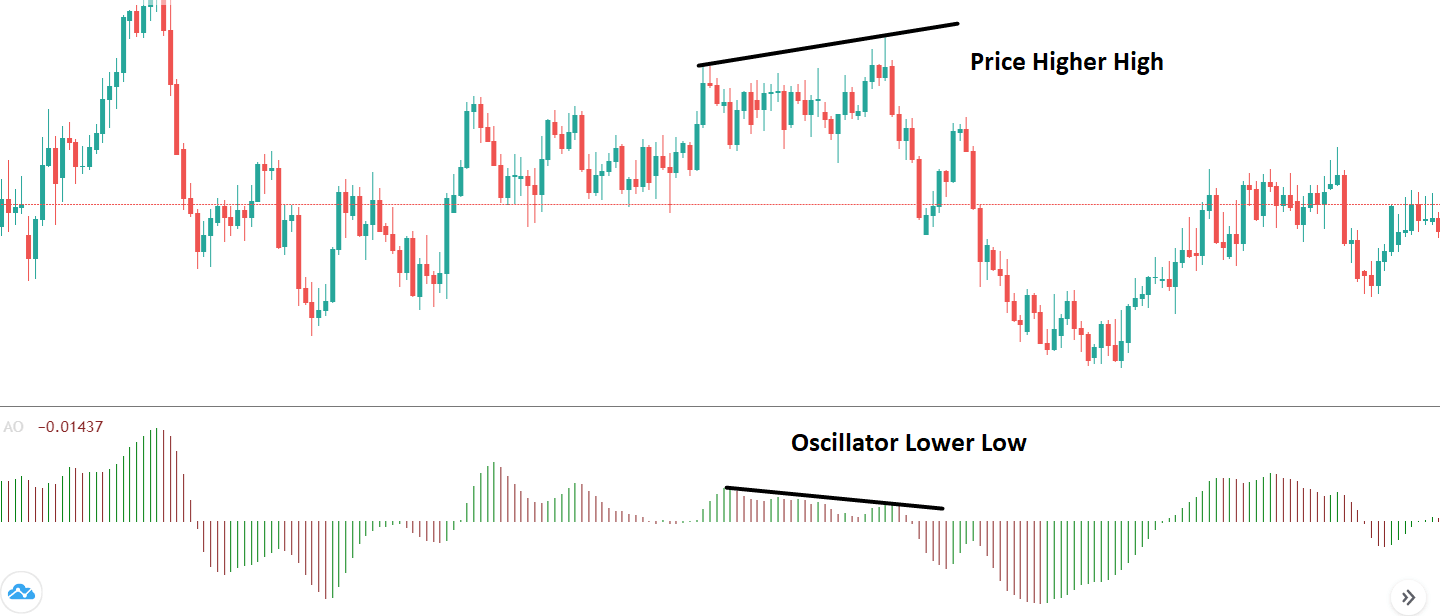
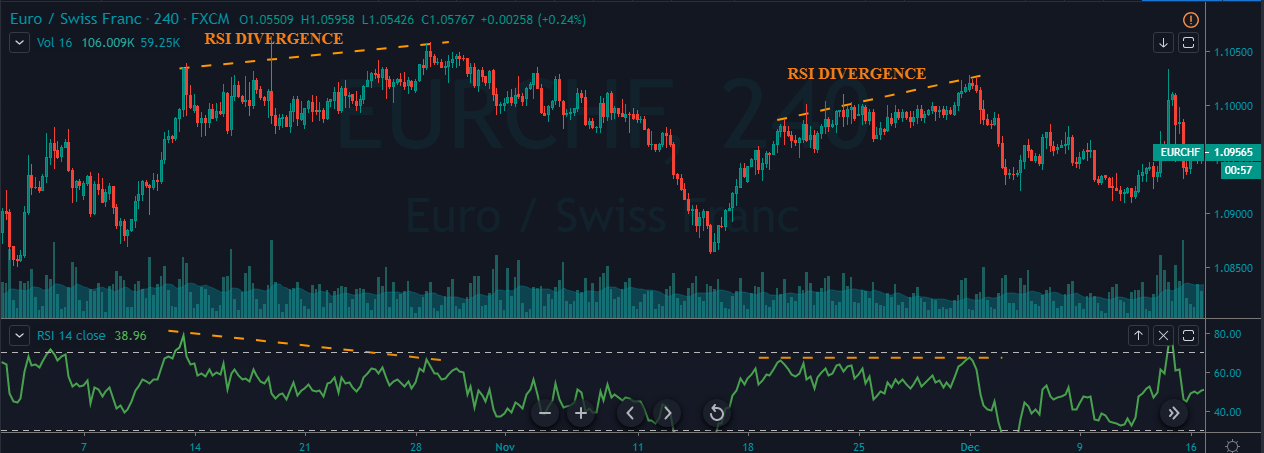
Several authors agree about the fact that divergence between prices and stochastics is one of the most powerful signals.
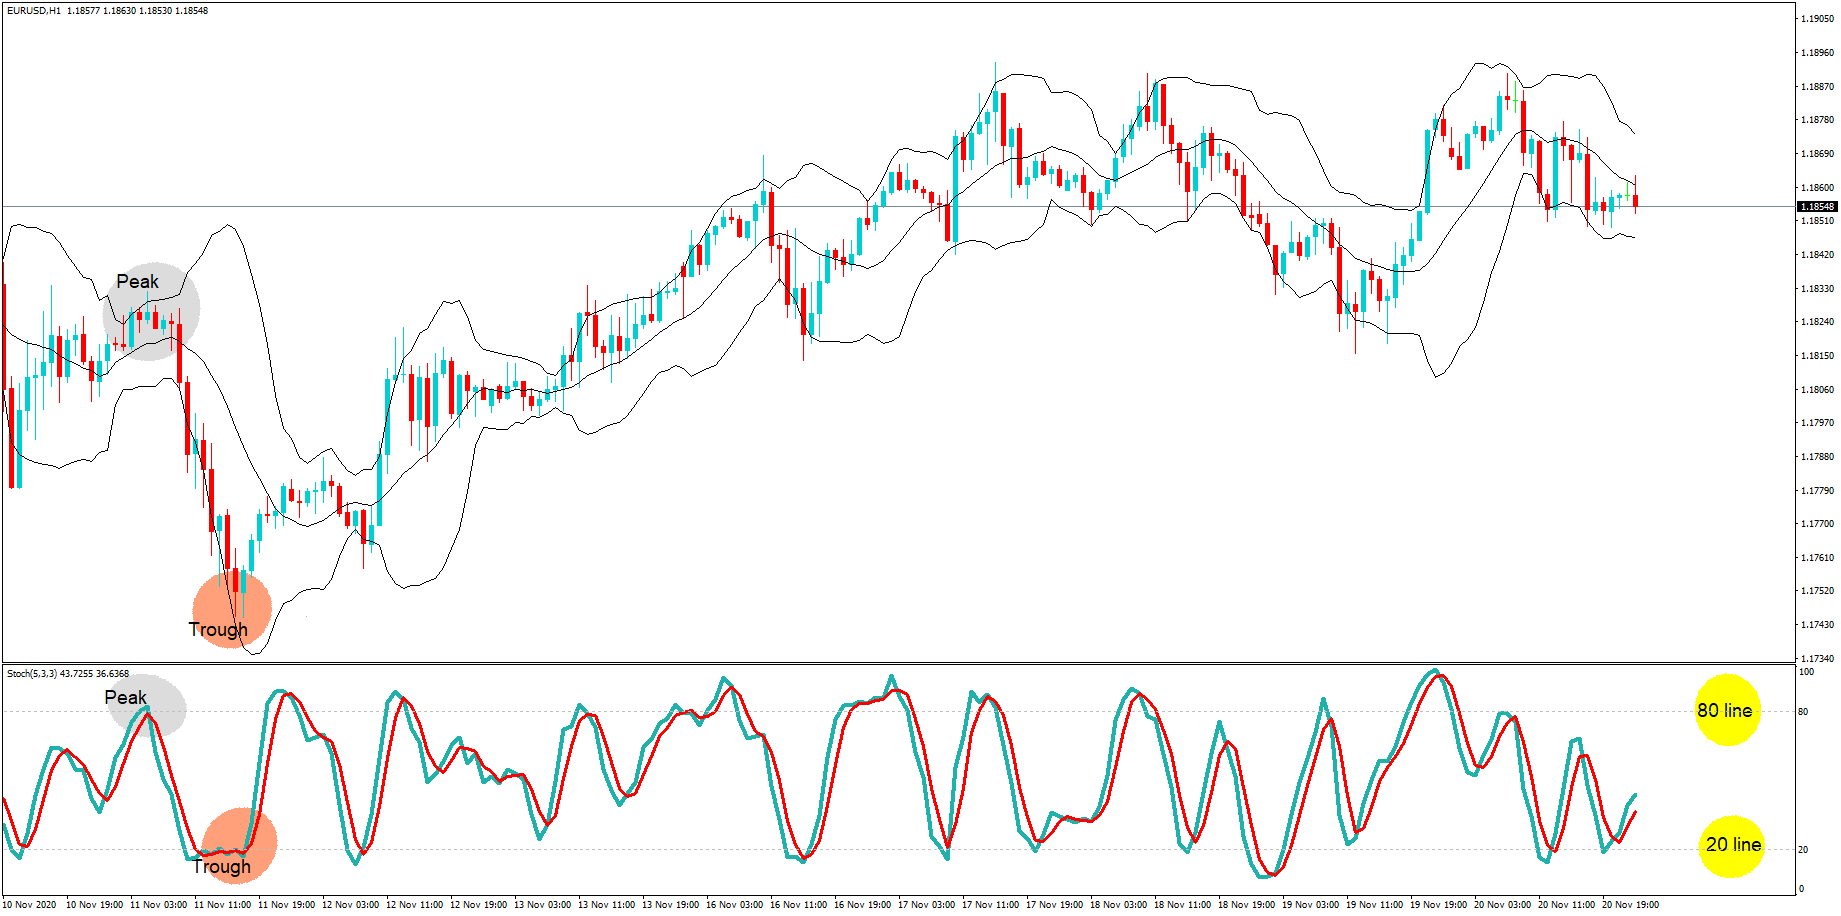
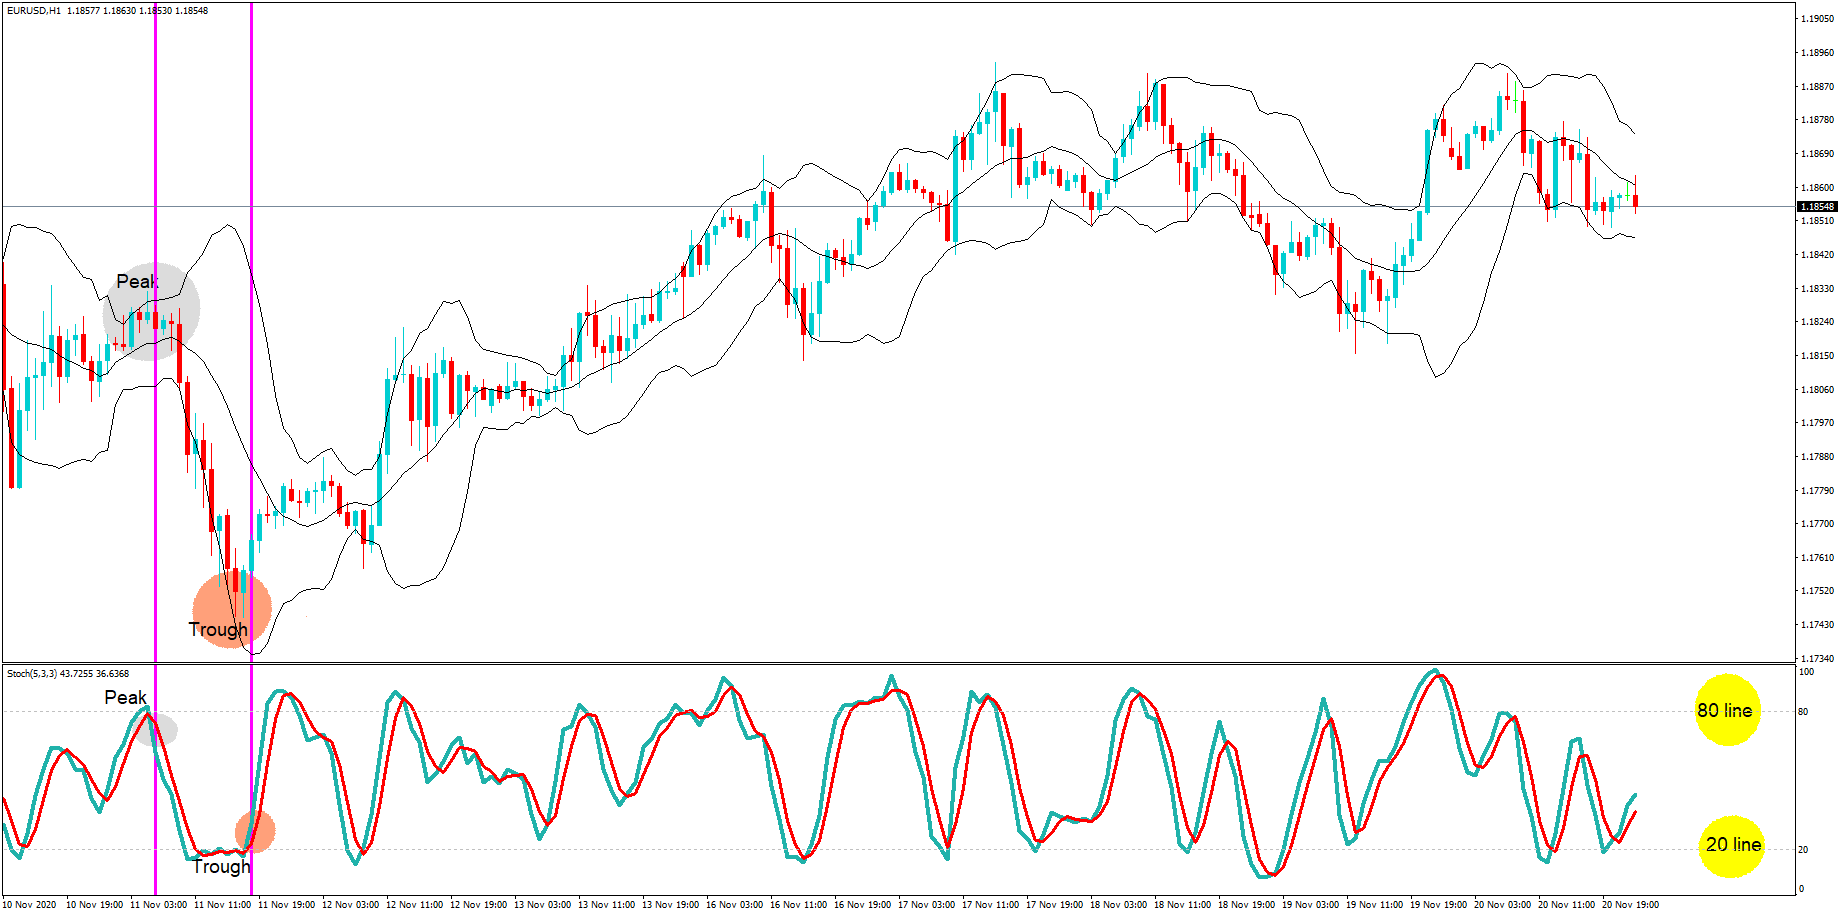
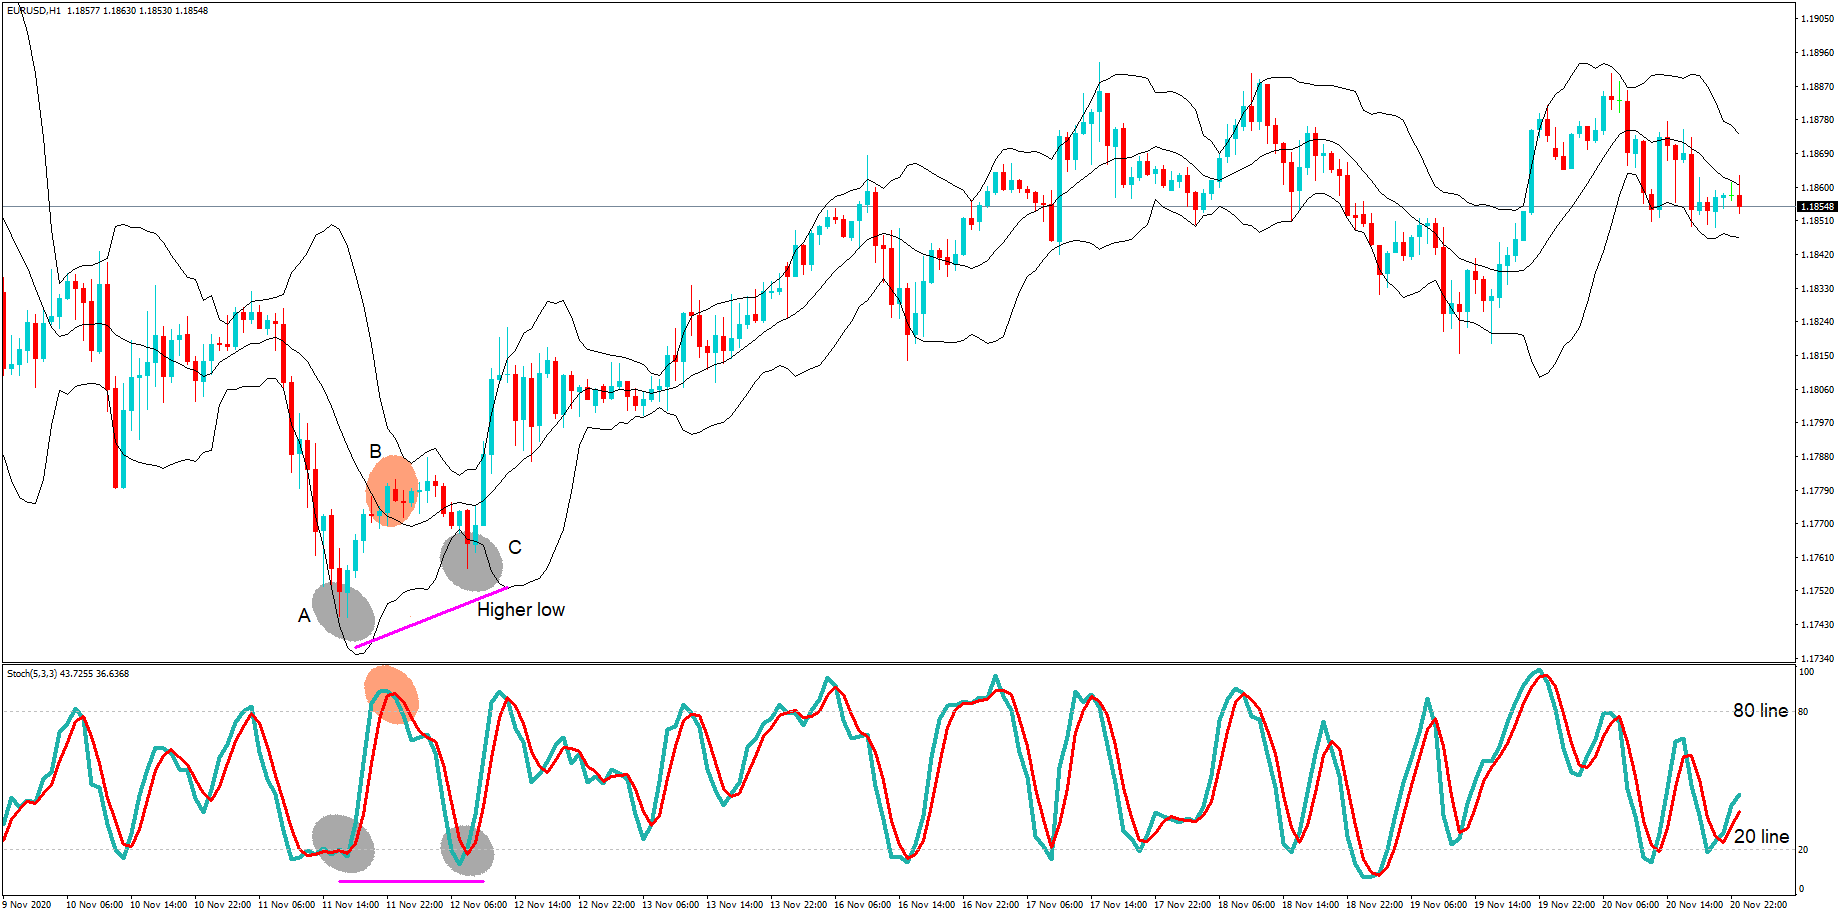
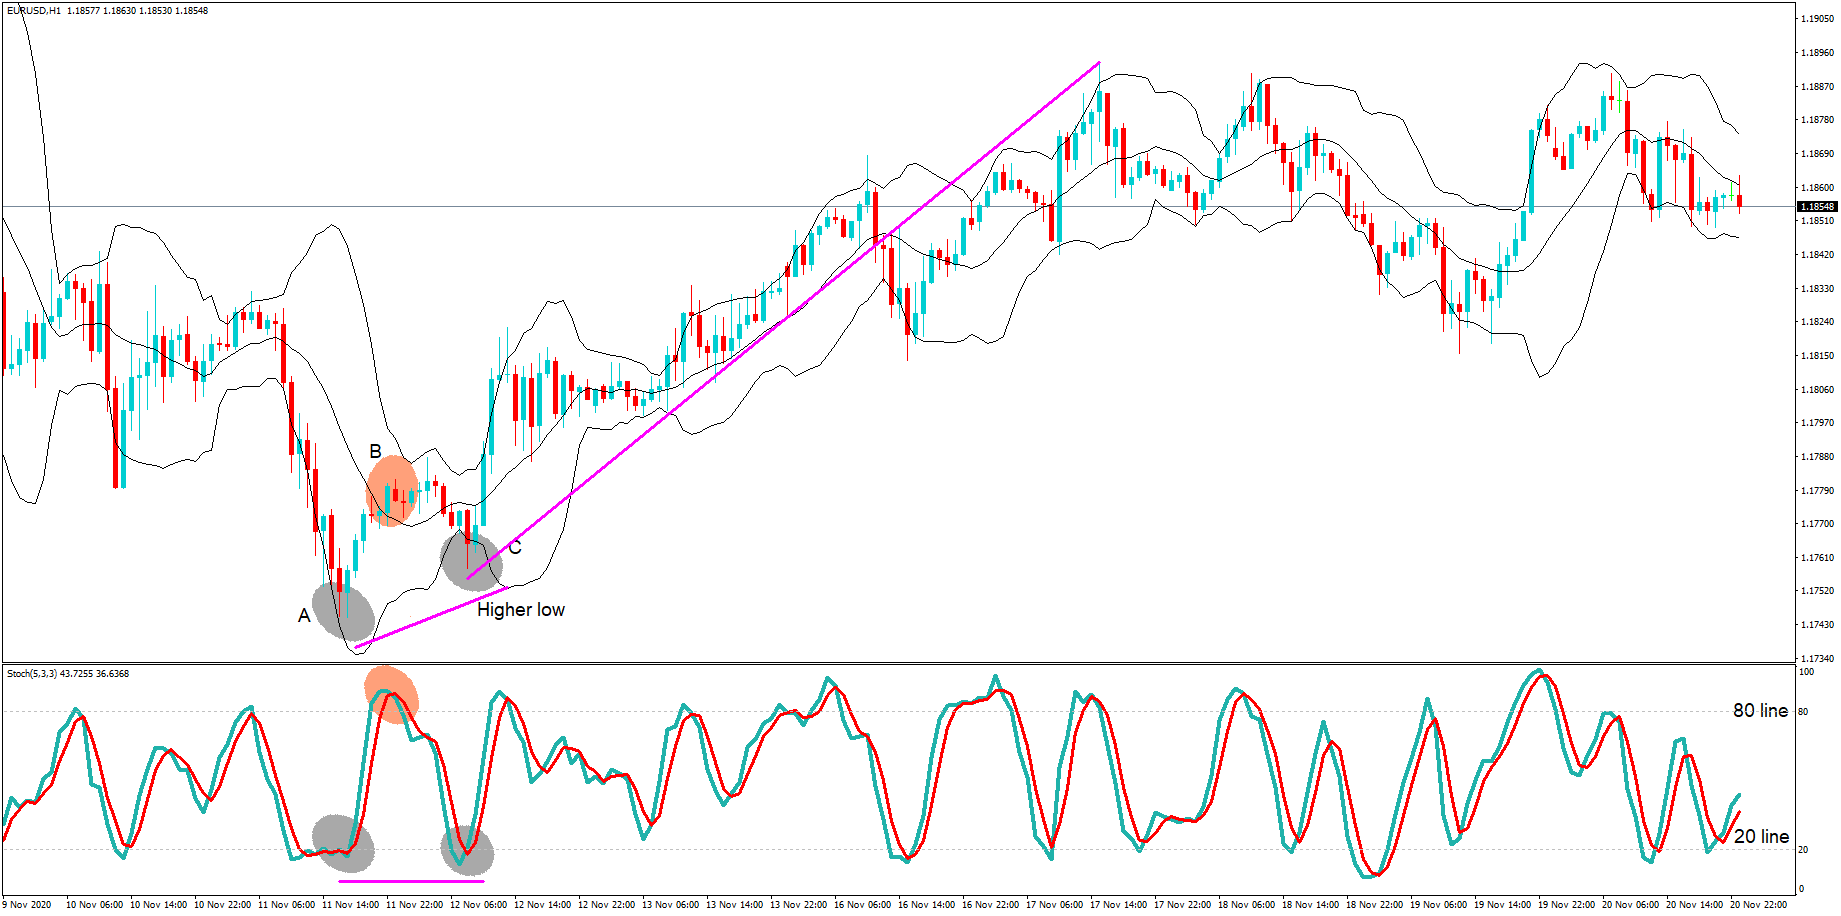
A bullish divergence occurs when a price makes a new low and the stochastic fails to do so, drawing a higher low.
A bearish divergence arises then prices are making new highs but stochastics lines draw a lower low.

A word of caution about divergences: It may work or not. I don’t know for sure. What’s sure is its performance is very challenging to test. I’d rather like those signals that I’m able to back-test, such crossovers, departures from an overbought or oversold level, etc.
Knees and Shoulders
When %K has crossed over %D and, then, pulls back, but, without another %D crossing to the downside, and, next, it resumes its up movement, Mr. Lane calls it a knee. If the movement is from overbought to the downside, he calls it a shoulder. According to Mr. Lane, it shows a continuation with strength.

Anticipating a crossover
There are people that remark when %D flattens, call it a hinge. Also, there’s a warning hook, when both %K and %D turns at an extreme but still don’t cross.
According to LeBeau and Lucas, those observations focus, mainly, on anticipation rather than reliance on the signals, and they don’t recommend them. It’s better to wait for a crossover.

Bear and bull setups
Another unique tool by George Lane.
A bear setup happens when prices make a series of higher highs and higher bottoms, but the Stochastics oscillator produces a pattern of lower lows when prices are rising. This pattern indicates there will be a top soon.
Bull setups are the specular pattern to bear setups, indicating that a bottom will happen soon.

Williams %R
Williams Percent R is a momentum indicator developed by Larry Williams, very similar to the Stochastic indicator, but in this case, it computes the level of the closing price in relation to the highest high of the period, instead of the lowest low, and it doesn’t depict a smoothed %D line.
Therefore, this oscillator moves from -100 to 0. Values below -80 are oversold levels while from -20 to 0 are overbought levels.
Some charting packages shift these values to positive 0 to 100 by adding 100 to the formula. In this case, oversold levels are between 0 and 20, and overbought condition happens from 80 to 100.
%R is noisier than Stochastic %D, but with less lag, so together with a confirming pattern, it usually allows for a better reward to risk ratio and tends to show more trade opportunities than Stochastic does.
This indicator is very good at detecting oversold conditions at an uptrend, or overbought levels at a downtrend, therefore, it’s well suited as a signal, to add to a position or enter a new one on pullbacks.
Advanced topics:
Adaptive Stochastics Indicator
John Ehlers introduced the idea of an adaptive indicator in his book “Cycle Analytics for traders.” Ehlers proposes to, first, find the dominant cycle first, and then use half of that cycle as the period for the stochastic calculation.
So, the adaptive Stochastics starts by computing the dominant cycle using an autocorrelation periodogram, which Ehlers describes in chapter 8 of his book (I will refer the interested readers to check it).
In his book, Ehlers showed the complete algorithm, as well (although written in easy-language, it may be transposed to any language). The main steps are:
- A low pass roofing filter to eliminate unwanted noise from the price data
- The periodogram calculation
- The instantaneous period is used to compute the current value of %D.
- No %K is computed.

As we observe from fig. 8, the adaptive stochastic is much less noisy and it adapts to the dominant cycle.
Center Of Gravity
John Ehlers describes this oscillator in chapter 5 of his book “Cybernetic analysis for stocks and futures, cutting edge DSP technology to improve your trading”. He states that this study is unique because his smoothing has virtually zero lag, therefore, enabling a definite identification of turning points at the same time.
The center of gravity of an object is, basically, a weighted center of its mass, a balance point. In a trading environment, we can define a kind of rule of weights on an observation window. A fast and upward moving price shifts the center of prices to the right, while a downward move, shift it to the left.
The following formula computes CG:
CG = ∑i=0 to N (xi +1) * Pricei / ∑ i = 0 to N Pricei
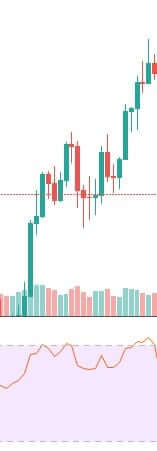
Fig 9 shows the EUR/USD 10-minute chart with Center of Gravity. As we clearly see, the CG is almost free of noise, so a signal can be picked directly from its crossovers if they happen relatively far from its zero line.

Cyan and pink boxes on Fig.9 show the result of scalping on a 10-min EUR/USD chart using CG crossovers. Nothing is perfect in trading, but we clearly observe that CG crossover signals catch the turning points with accuracy, allowing a highly probabilistic approach to scalping.
Stochastizing indicators
Stochastizing indicators is another development by John Ehlers, which he introduced in his book Cybernetic analysis for stocks and futures.
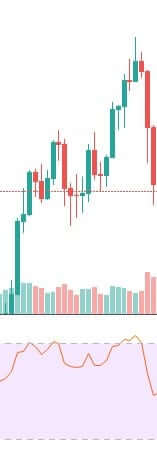
We may “stochastize” any indicator by computing its value in comparison with its lowest value of a period. Below, is an example of Stochastics RSI, much easier to use than in its original form.
The example in Fig. 9 shows entries and exits following the trend, discarding those against it, depicting high accuracy and early signals that allow for good reward-to-risk ratios. If we take the complete bull and bear signals, the stochastic RSI signal is still quite reliable. Just the trades against the trend do not present such good profits, but do not show significant losses either.

Inverse Fisher Transform Percent R
The idea of a transform is to map some domain into another domain. The Inverse Fisher transform maps an indicator, %R in this case, into another kind of domain that allows us to alter its probability density function (PDF).
Market prices don’t fit on a Gaussian PDF, the familiar bell-shaped normal distribution, instead, prices have fat tails, meaning that large bull and bear events are more probable than a normal distribution allows. The Fisher transform can be applied to prices, such that it makes the resulting distribution nearly Gaussian.
The following equation defines the Fisher transform:
y = 0.5 x ln [ (1+x)/(1-x)]
This function compresses prices, to cut the fat tails, making the resulting price distribution Gaussian.
The inverse Fisher transform, instead of being compressive, is expansive. Its equation is:
x = (e2y – 1) / (e2y +1)
The shape of the transfer function of an inverse Fisher transform is a kind of sigmoid function. The resulting output has a higher probability of it being +1 or -1. This -almost saturated- function makes the inverse fisher transform behave like the output function of an artificial neuron. The resulting shape shows trend changes very early.

To conclude, we have seen that the use of advanced signal processing is a way to improve classic indicators, for them to show less lag or behave in ways not achieved by conventional means.
To do so, we are required to do a bit of programming, to translate the algorithm into our trading platform. It may be useful to do an internet search because there are lots of free translations of popular indicators to major trading platforms.
This article section was just, the starting point for those with interest in advanced indicators.
A very good article, including MT5 code, is https://www.mql5.com/en/articles/288, where you may get actual code to implement the ideas sketched here.
References:
Computer Analysis of the Futures Markets, LeBeau and Lucas
Cycle Analytics for Traders and Cybernetic analysis for stocks and futures, cutting edge DSP technology to improve your trading, by John Ehlers.
Charts created using MT4 and Multicharts trading platforms.
©Forex.Academy
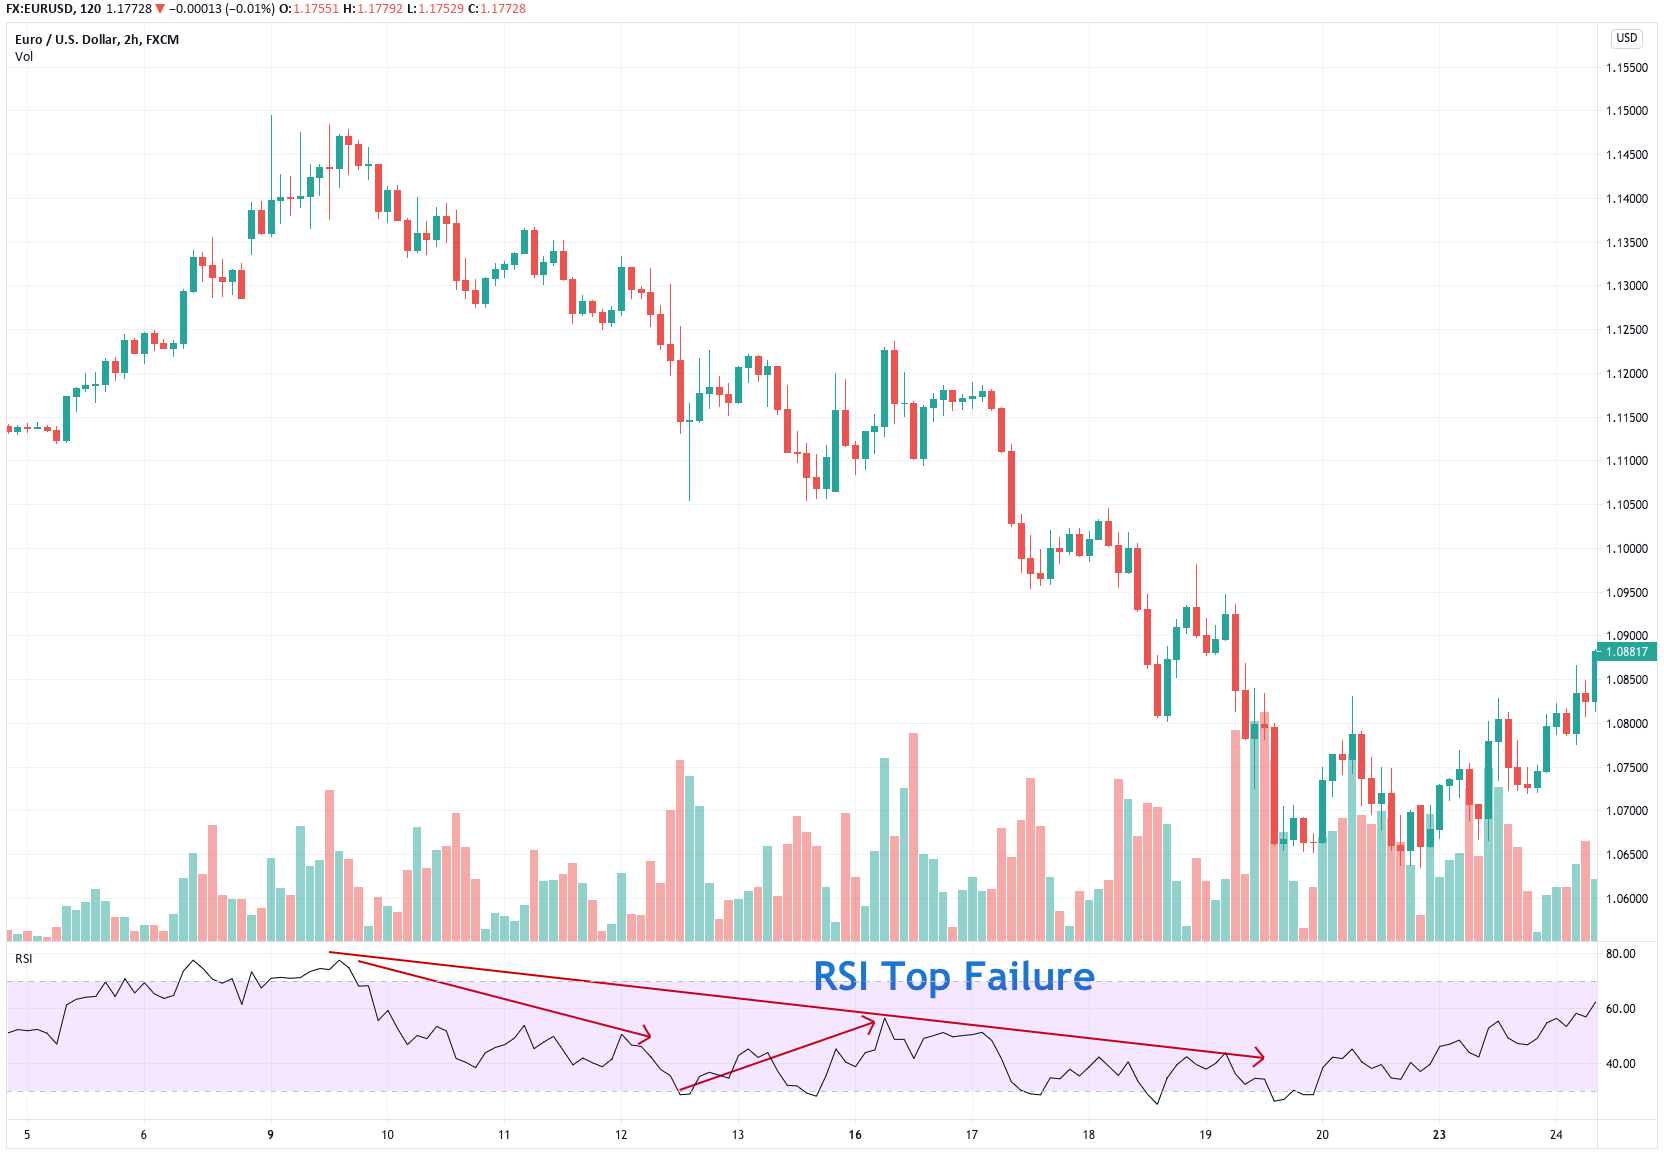
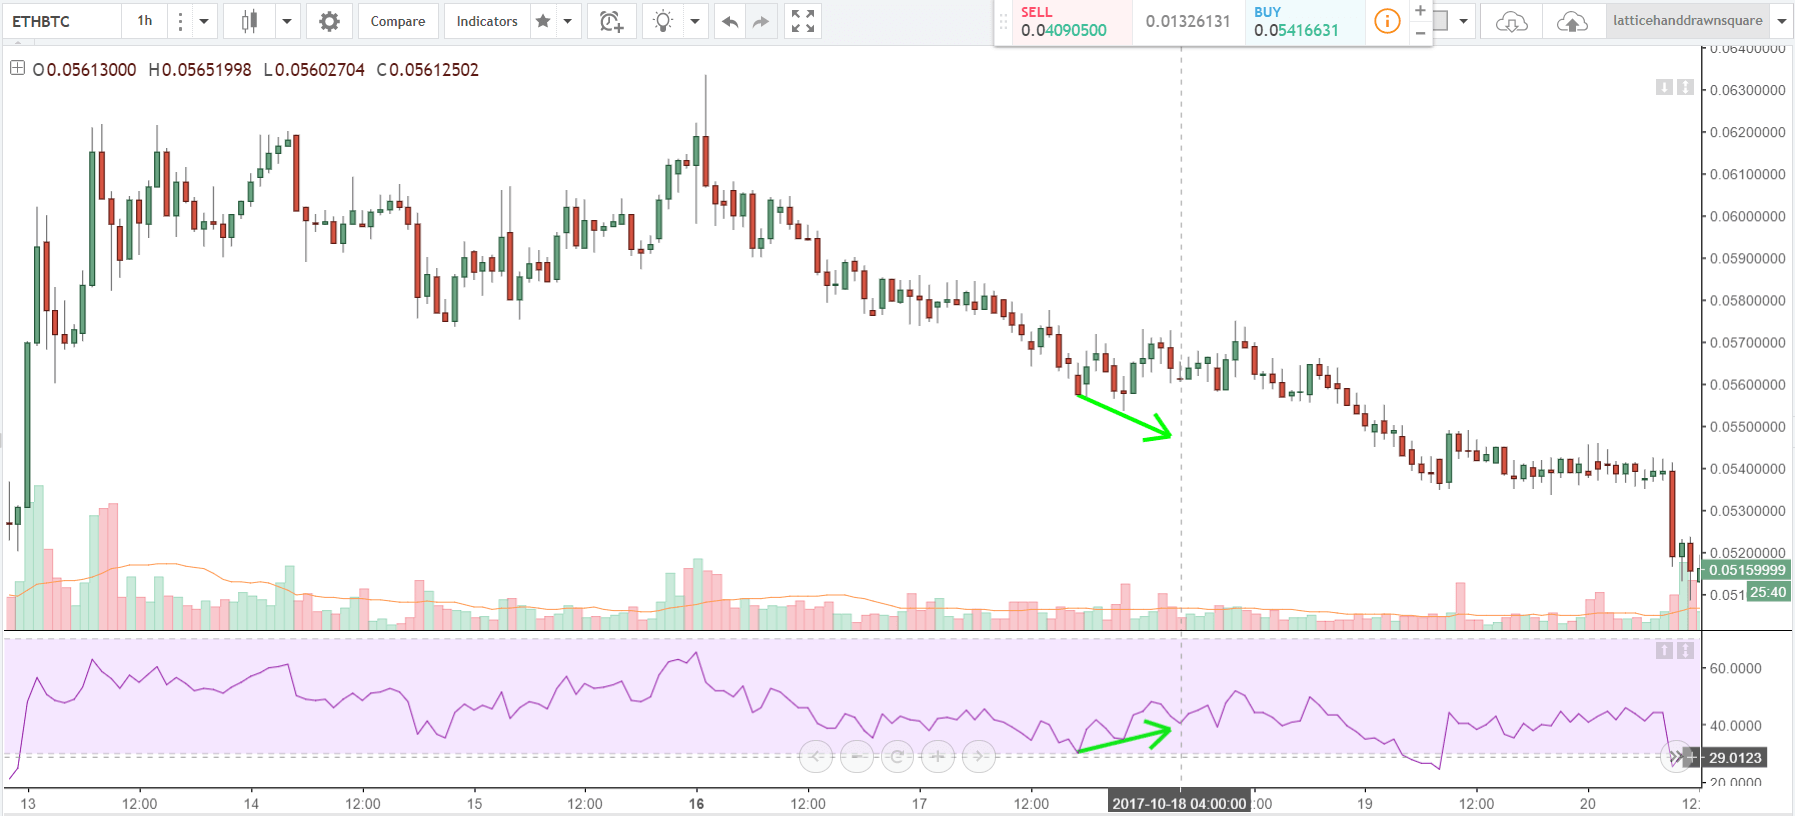
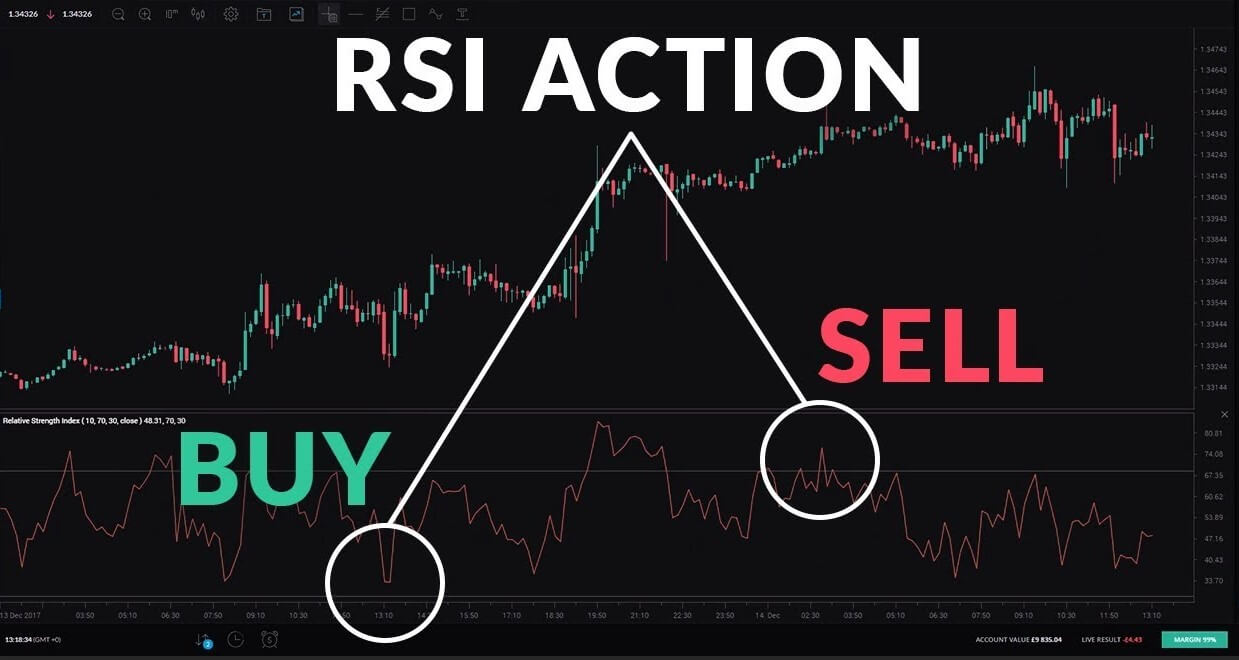
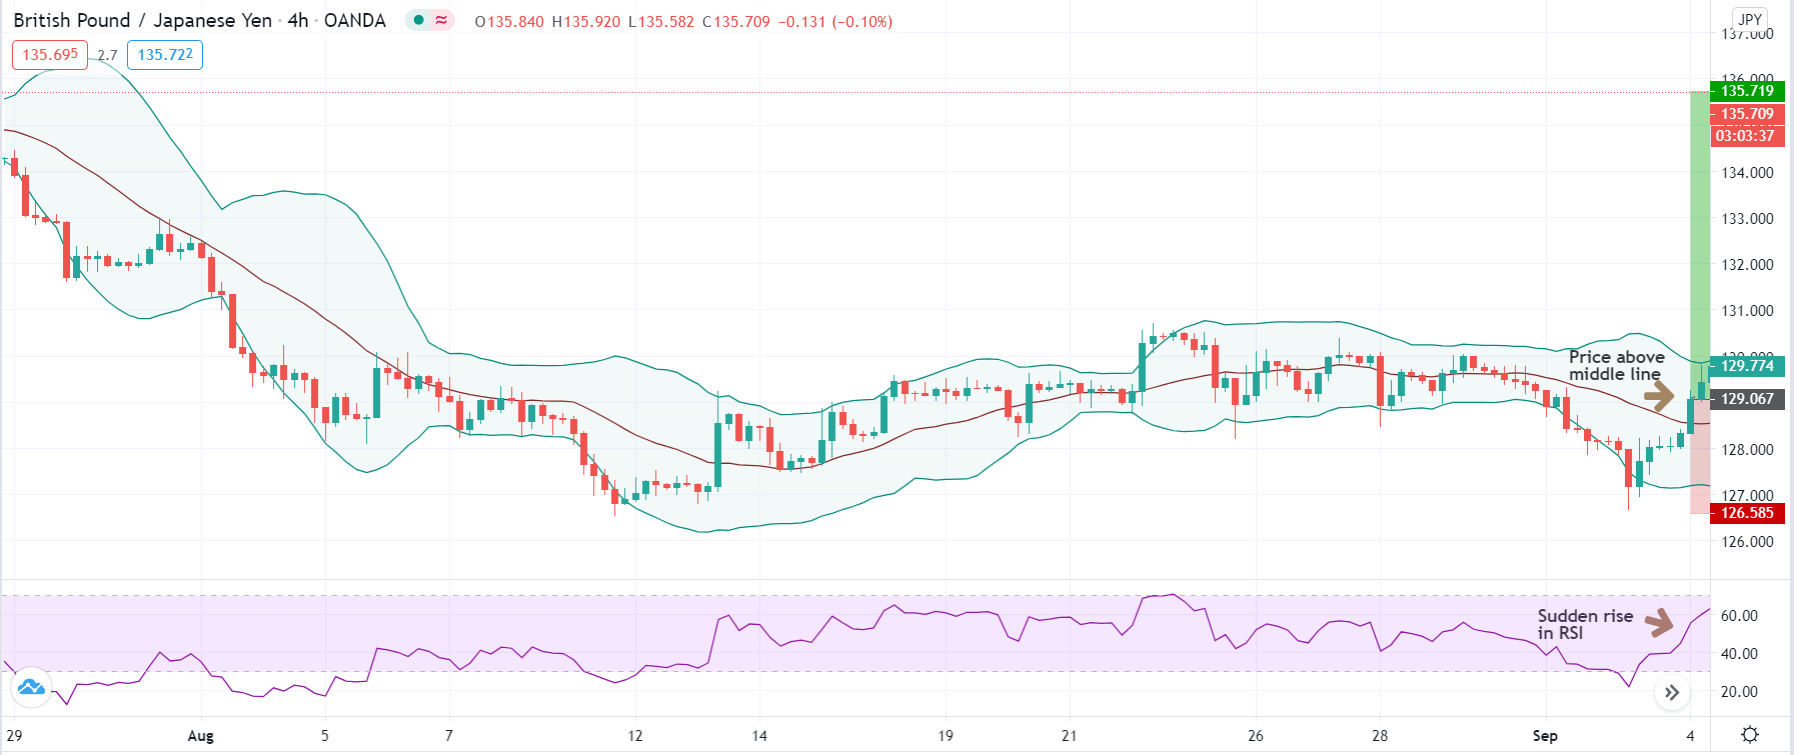
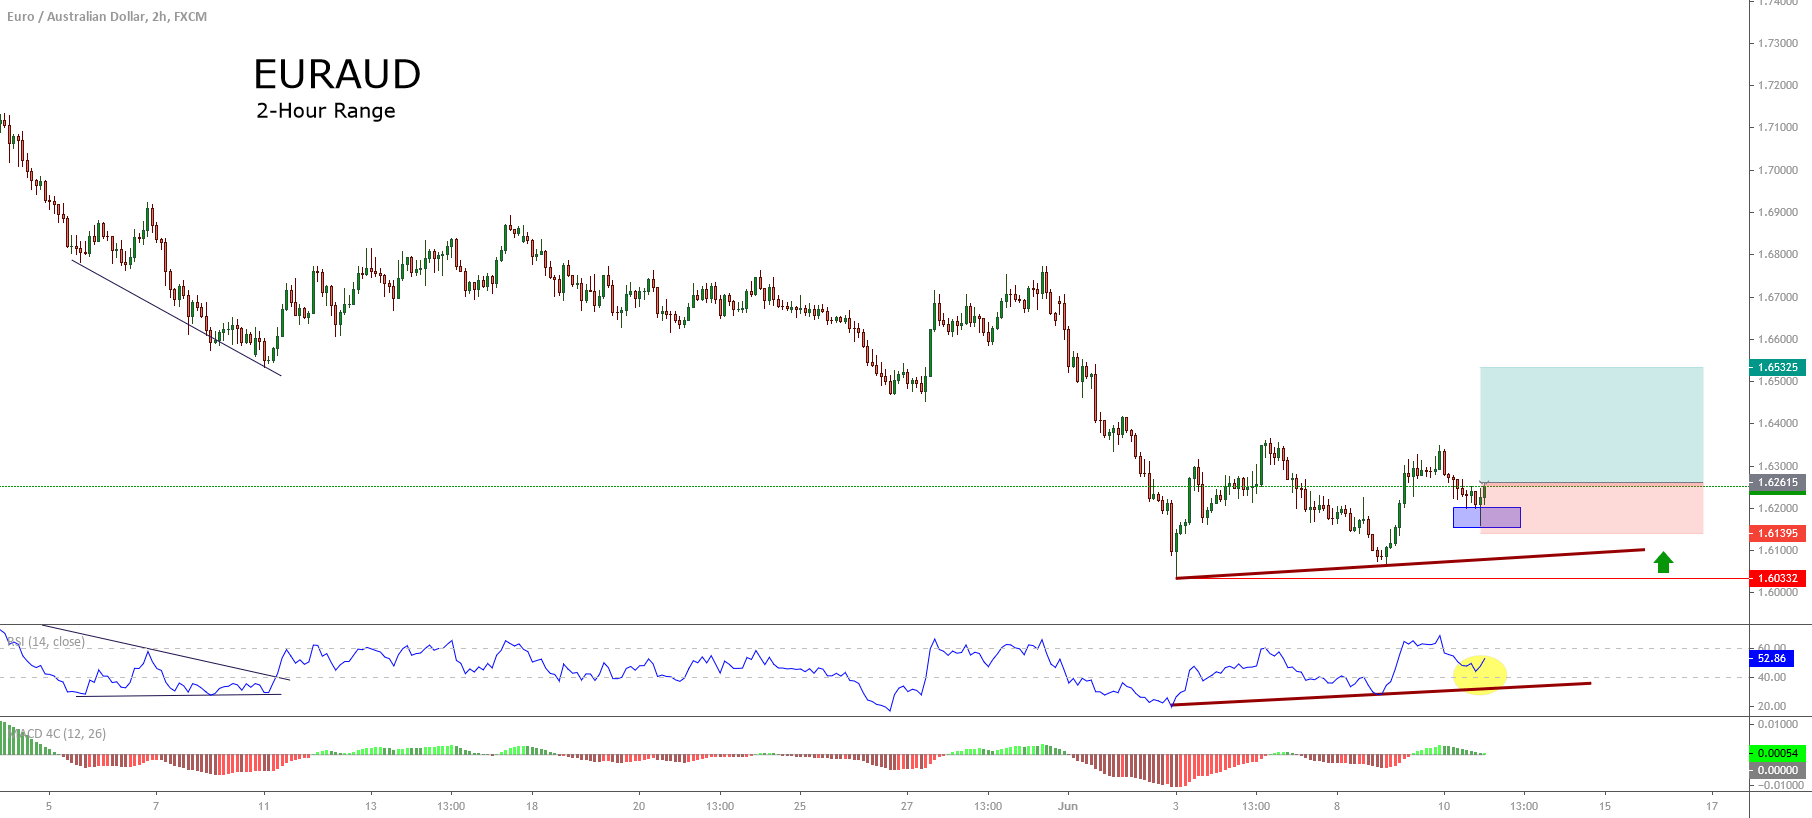
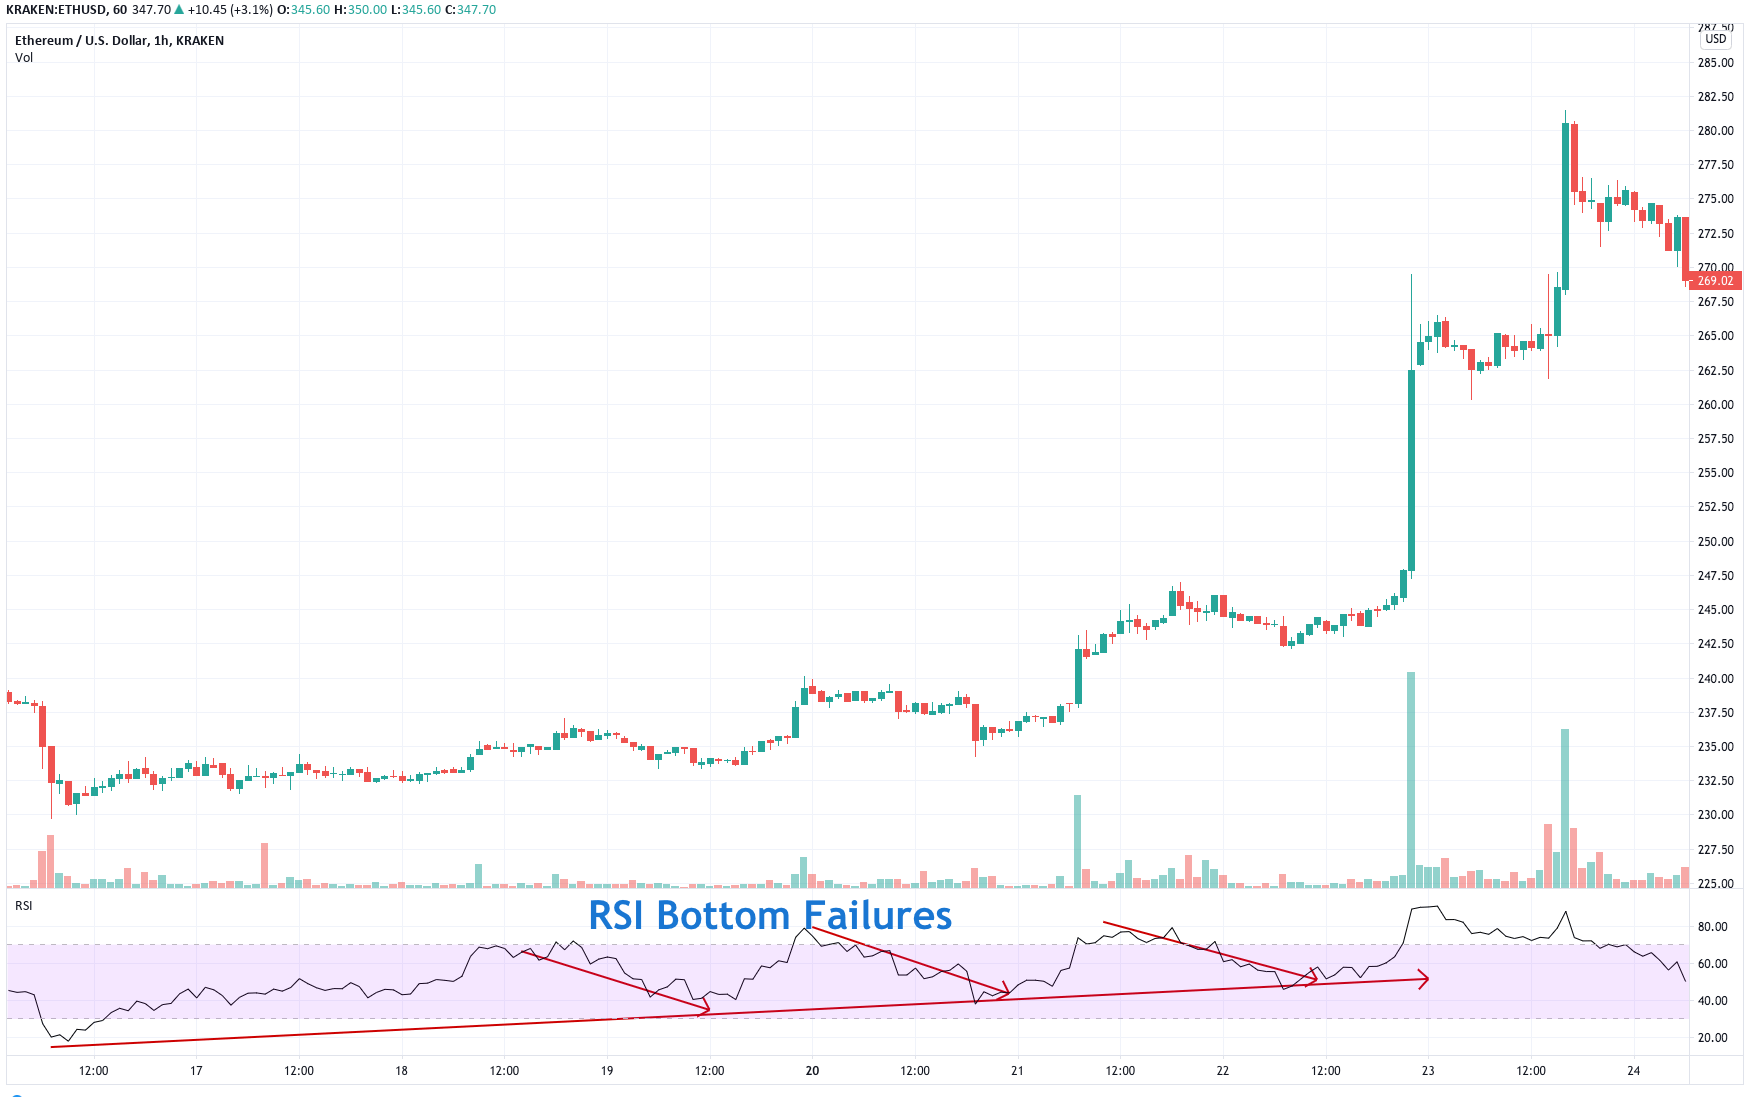 Fig 2 – RSI Bottom failures in the ETHUSD 1H Chart.


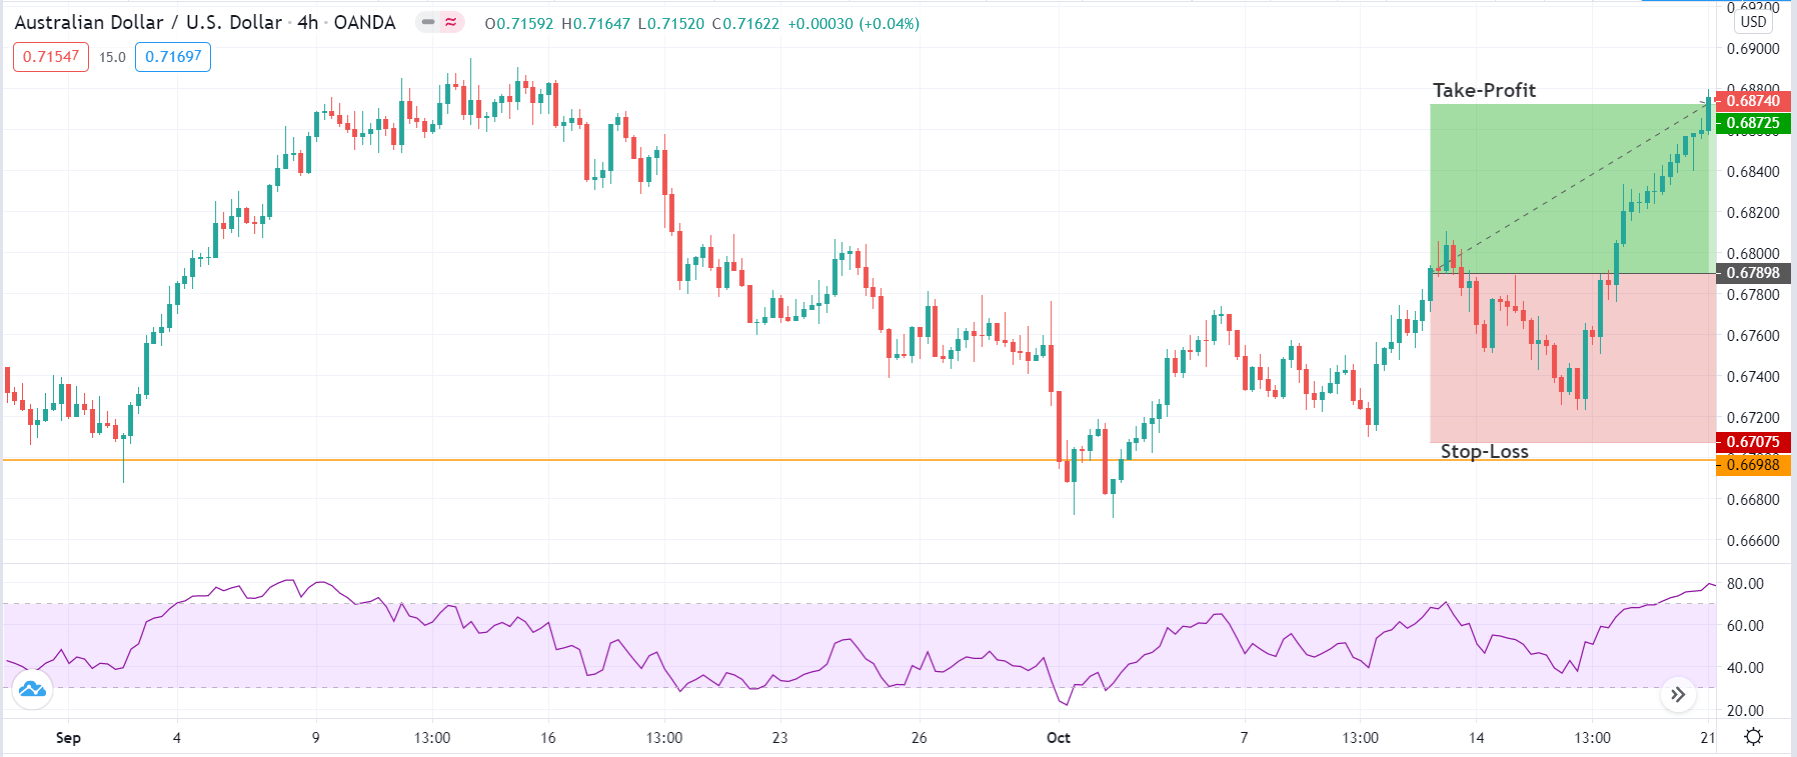
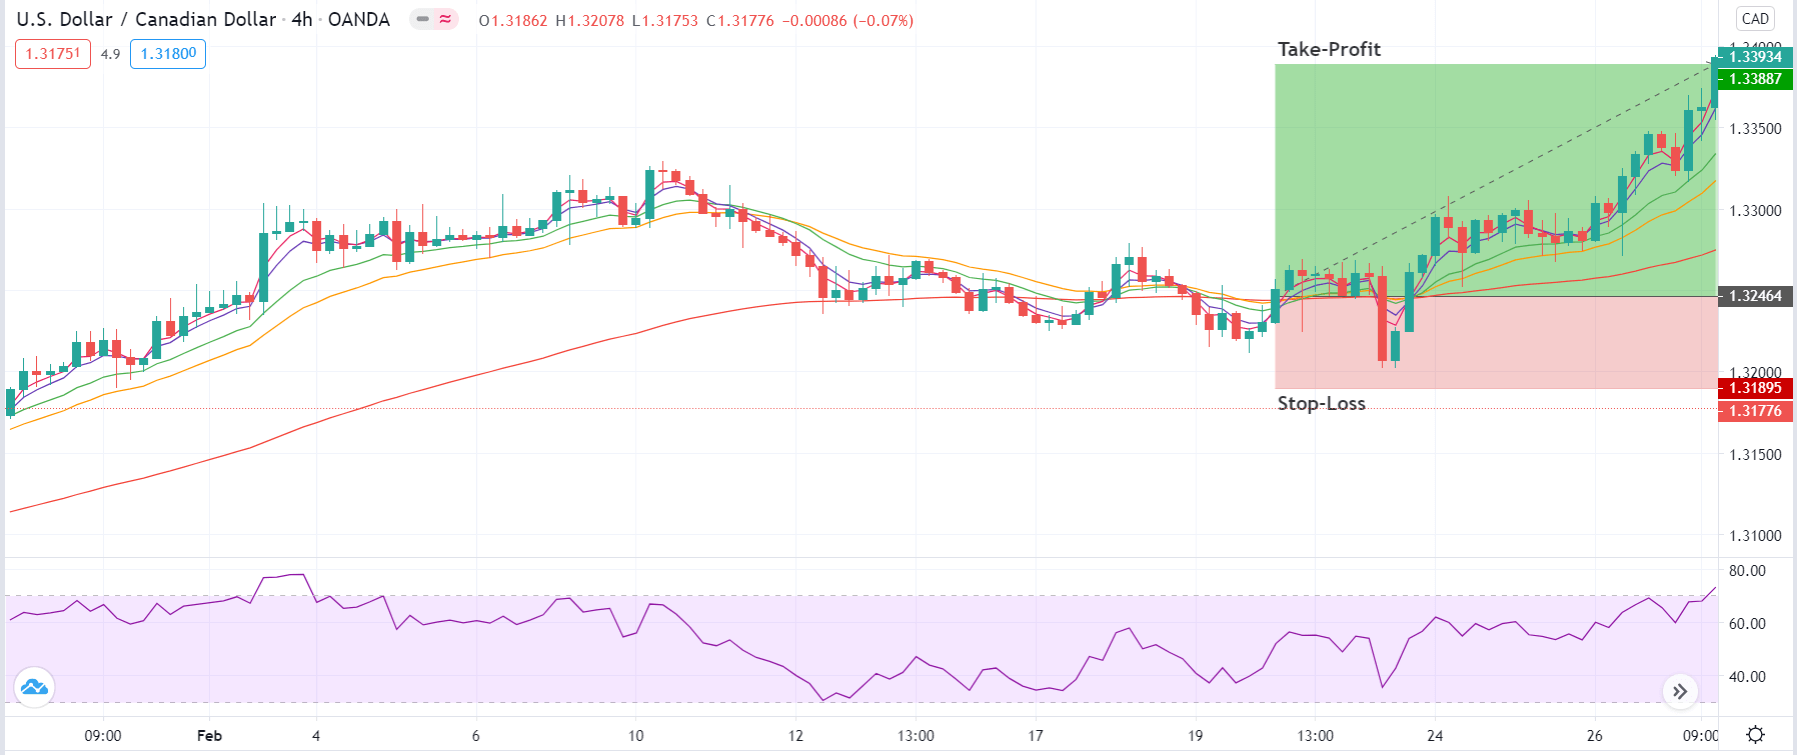

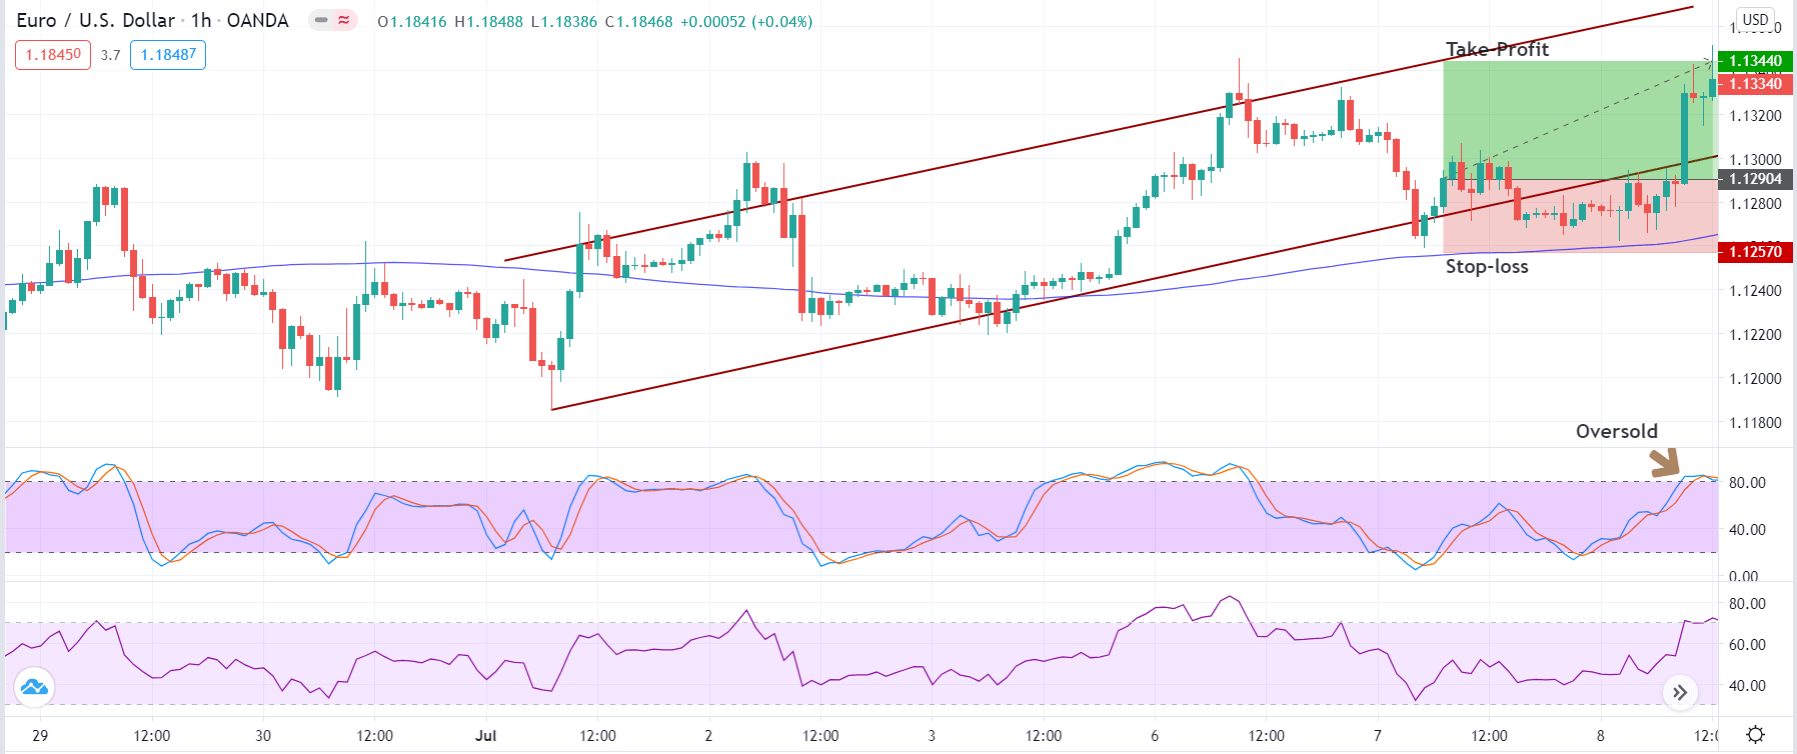
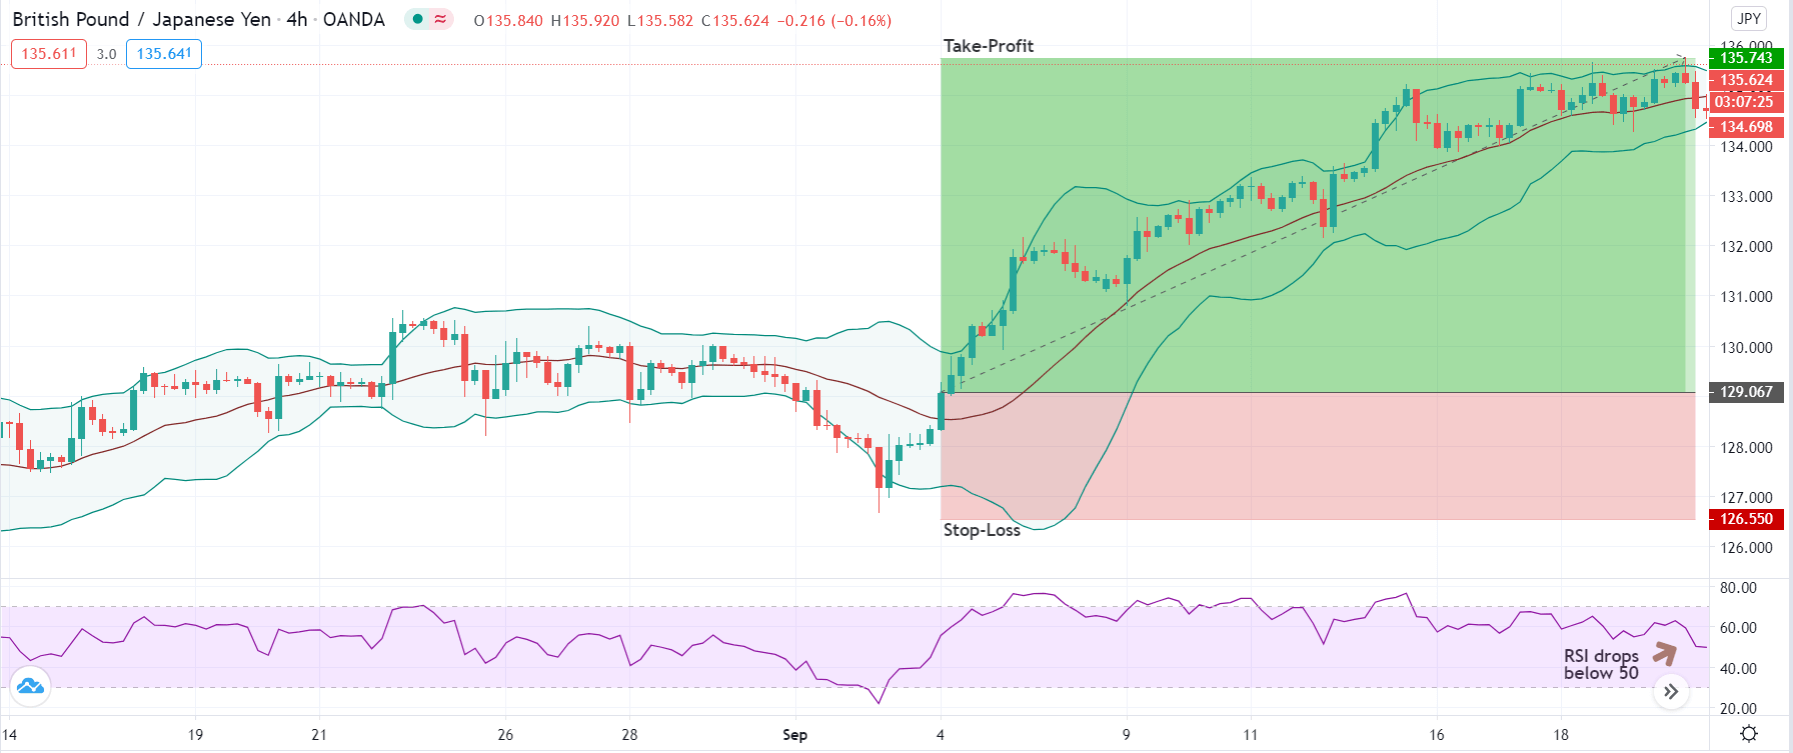


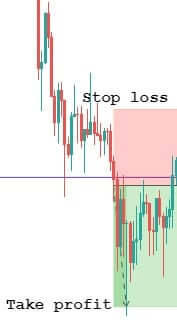
 Step 3 – Step Loss & Take Profit