The following strategy example is similar to our previous Heikin Ashi strategy, however, this one is more radical in noise reduction. It is the Renko chart strategy. Besides, it is made for scalpers. Without further ado, let us dive into what is so special about this one that made it on our list of successful trading examples.
This tool that transforms the classic chart view is not very popular since it cannot be used for Price Action analysis, at least not in a classical way. It is the ultimate solution to noise reduction and it will also make plan following easier for a beginner trader. It does not mean it is a less effective tool, just not well understood, and therefore underrated.
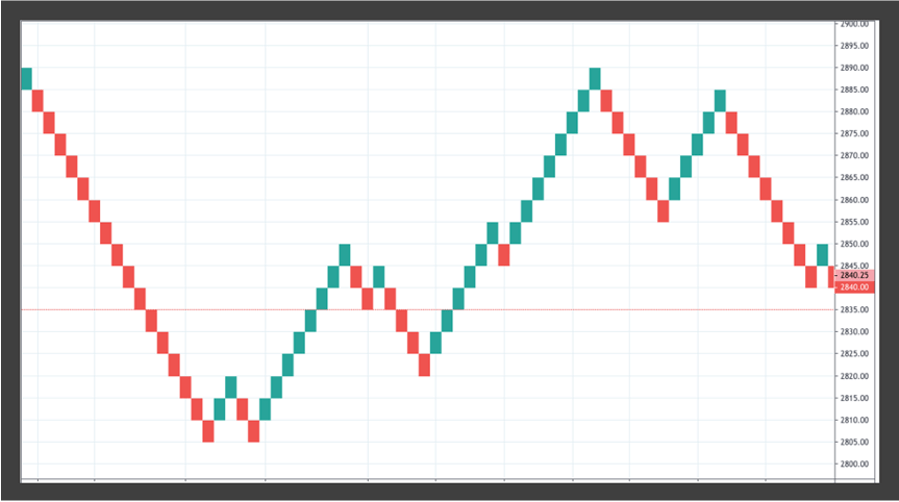
Renko chart looks like a digitalized, low-resolution classic candlestick chart, making small price waves blend into one brick. The bricks are all of the same shape and height forming up and downtrends at the same angle. Renko does not have a defined timeframe but a pip dependency when a brick will form, meaning until the price moves a certain amount of pipis up or down a new brick will not be formed. It is up to the trader to set the range for the brick size and ultimately traders will rarely see a flat period with Renko. Renko could be considered as the pure trend charting, and this is great since trend trading is proven to be one of the best ways to trade.
Setting the Renko box or brick size depends on your trading style, some traders who like to swing trade will use a 10-pip box setting, more active traders will like a 5-pip resolution, but Renko will serve equally well on all if you balance all strategy tools to work in tandem. Of course, optimization will require a lot of testing.
Here are a few hints on how to set up a box size, it is the only setting for the Renko.
- Fixed box size is a classic way to adjust Renko’s strategy. It can also be in cents or ticks units, not only pips if you want other assets besides forex currency pairs. For scalping, intraday, action-packed trading use smaller sizes such as below 5 pips. Trading on a longer-term, a comparison to the daily timeframe and higher in classic charts, 10-pip box size settings is recommended. The settings you set here have the biggest impact on how your strategy will work out. Just remember Renko is a noise canceller, setting it too low will just make it a pointless tool. The ideal box size is hard to find, however, once you find it your work on optimization will be 90% done.
- ATR box size setting might be superior to the standard fixed box setting since volatility is counted in. Average True Range measures volatility for 14 periods by default and it is measured in pips. This pip value is your box size setting. Now, on smaller time frames, ATR is lower and vice versa, but consider daily chart ATR value first for swing trading.
Some traders do not like ATR adjustments to the box size, simply because Renko brick stamping and chippiness can change during the day and volatile periods. You can try both ways and see if it makes any difference. Note that the daily ATR chart is not changing too much that it disrupts the flow of Renko movements while smaller time frames can change 20% in just a minute.
Renko boxes tend to resist the trend change. To explain, if you set the box size to 5 pips any trend-changing box will appear only when 10 pips move in the opposite direction. 9 pips will not be enough for a correction brick. If you see a drawdown that is not reflected on a Renko, this is why. To give this drawdown information back to Renko, you can enable wicks that reflect this price action. Of course, by doing this you allow some noise back in. Since we want Renko to fulfill its purpose we do not use wicks.
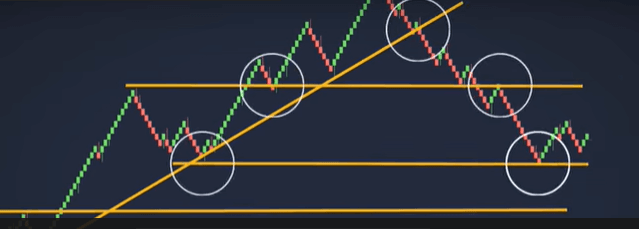
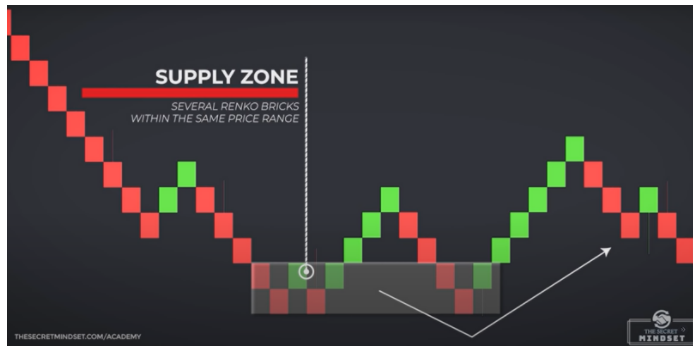
Price Action style analysis can still be applied, but now it will be much clearer with Renko. Note the Support and Resistance lines will be on a higher grade, meaning anything analyzed zoomed-in cannot be precise enough, so use Price Action only to see the bigger picture, not based on 10 or even 20 bricks alone. Pivot points, higher high, lower lows make it easy to plot trend lines and patterns with increased reliability than with classic charts, they just require more past data. This is especially true with Support/Resistance lines since Renko boxes will not form on flat markets thus effectively marking pointy markers for lines. Even if you do not want to use Renko for trading decisions, it will help you on finding key levels on classical charts. The picture below explains how to find supply zones with alternating Renko bricks on the same price level:
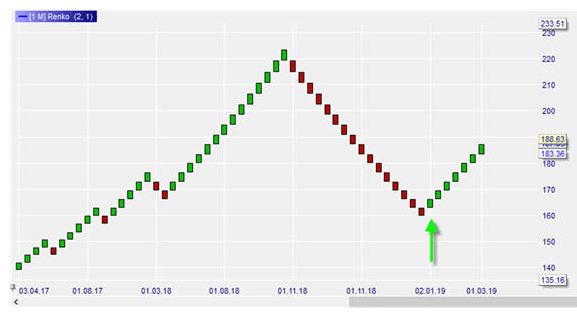
Now that we know the best practical examples of how to set up and use Renko, let’s see how we can use it to enter and exit positions. Trends are easy to spot with Renko, any two consecutive Renko bricks in the same direction could be a trend. Of course, if you managed to get most of the noise out with optimal box size setting and filter only trends that have a high probability to trigger your first Take Profit, then you would not need any additional trend confirmation indicators, it may only be a distraction. Our example still uses an MA to eliminate beginner traders’ problems.
We will keep it simple – apply a rule when you consider something trending, is it two consecutive boxes, 3, 5? In our experience, exiting on a single changing brick out of the trend might not be a good idea, a scale-in could be a better option. All this depends on the price action levels. We typically set Renko so it does not filter trend corrections since we want to get back into the trend.
Exit point rule can be based on the PA levels, on a first changing brick, but only when the price is very close to support or resistance zone. Sometimes this rule might force you to wait for some time if the market is not trending, therefore consider using Renko on volatile currency pairs, indices, crypto, or trending stocks.
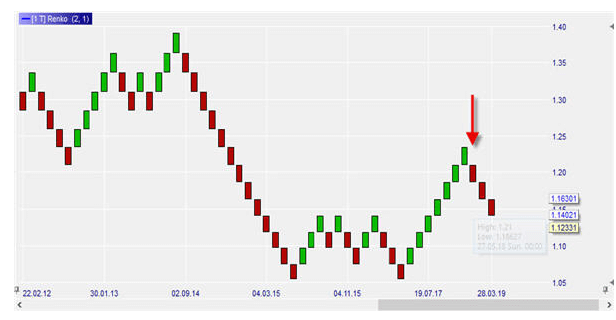
Adding a Moving Average as a trailing stop is a great fool-proof solution with Renko if you do not want to rely on Support/Resistance zones. Beginner traders that have trouble with exit points can plug in any MA that does not stick to the price too much (not too sensitive). Understand the MA uses Renko bars for calculation, not the ordinary chart. Moving Averages are doing the same thing as Renko, they give filtered trend information. Consequently, you do not need a slow-moving one. Also regarding MA on Renko, our best practice is not to use MA crossovers but Renko brick crossing for an entry signal. Entering a trade once the MA and the entry rule gives a green light is simple and effective. Finally, our strategy template will look like this:
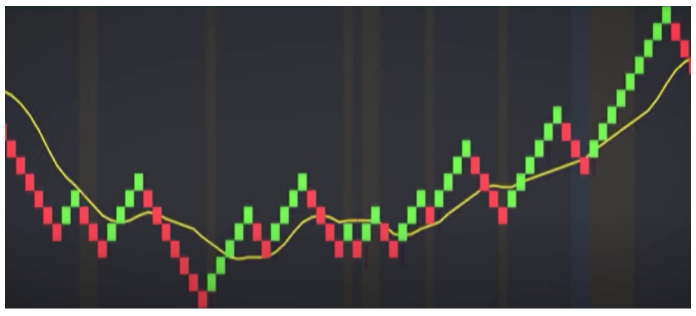
If you analyze the picture above you will also notice the limitations of this strategy. Unless you trade on stable trending assets or markets you will not benefit much. Exit points might be too late or entries false. Now, our attempt to fix this is counting consecutive bricks to get the picture of trend quality/choppiness. 6 consecutive bricks in a few rows might be enough for a strategy to be at break-even, and all above is a good market to trade. After a while traders do not have to count and spot a good ground for this Renko strategy right away.