With this publication, we will look at an incredible method of market analysis based on the volume Volume Spread Analysis (VSA), developed by the famous American financial analyst Tom Williams and published in the book «Master the Markets». This is an unusual view that deals with how market makers manipulate crowd behavior.
With this publication, we will look at an incredible method of market analysis based on the volume Volume Spread Analysis (VSA), developed by the famous American financial analyst Tom Williams and published in the book «Master the Markets». This is an unusual view that deals with how market makers manipulate crowd behavior.
With this publication, we will look at an incredible method of market analysis based on the volume Volume Spread Analysis (VSA), developed by the famous American financial analyst Tom Williams and published in the book «Master the Markets». This is an unusual view that deals with how market makers manipulate crowd behavior.
Not to recount the book, so in this series of articles, we will focus on the practical side of the method with a traditional reference to cryptocurrency trading. You can apply this method to any financial instrument, my examples will be in the BTCUSD pair.
Now, let’s discuss the theoretical principles of price formation in the market and how large capital traders influence the market. I will define the main concepts that I will use throughout the course. Therefore, you should study this article if you are interested in VSA and want to better understand the actions of large traders.
What are Trading Volumes?
Even if you’re just starting your trading career, you’ve probably found the following phrase: “The market goes up when demand prevails oversupply. And, on the contrary, the market will suffer a decline at the moment when supply is surpassing demand”. We need to study the principles suggested by this phrase in order to better understand what the volume of trade means.
For those who could not find a similar term, I must explain that, in trading, is the number of lots traded on the market within a specific period. Firstly, it should be understood that the volume taken in isolation does not provide much information. But, if what we do is compare the current volume with the previous day’s volume, or a week earlier…, you will see clearly the changes in business activity.
To better understand market processes, let us compare a change in volume with the price differential. This will show the feeling of the great players: bullies or bassists. Remember, the spread is the difference between high and low prices during a particular period.
In practice, price movements do not always correspond to current market activity. There are often cases where, after a small increase in volume, the price increases sharply, confusing many traders. But if you have already studied the concept of inertia, then you will have everything clearer. Then, in this situation, the market can be compared to a car in which driving at high speed will go uphill for a while, even if the driver has taken his foot off the accelerator.
What is Volume Spread Analysis?
The VSA method provides a complex approach to market analysis, which defines the relationships between asset price, spread, and volume. The last indicator shows the activity in the market. While the spread speaks of the amplitude of the price movement.
In establishing the relationships between these two characteristics, we strive to identify the imbalance between demand and supply. For the most part, it is a consequence of transactions opened by large operators, and in the trading environment, it is considered one of the most significant reasons for the market to move in one direction or another. In turn, knowing the imbalance and the true causes of its occurrence, we can easily predict the direction of future price movement.
Principles for the Movement of Assets
Volumes, like stock market trends, are also divided into bullish and bearish. The bullish volume increases the volume in the upward movements and decreases the volume in the downward movements. Consequently, the bearish volume increases the volume in downward movements and decreases the volume in upward movements.
Now let us examine the concepts of accumulation and distribution…
Cumulation means buying as many shares as possible, without significantly increasing the price compared to your own purchase, until there are few or no shares available at the price level you have been buying. This purchase usually occurs after a bearish move in the stock market and there are the best prices to buy.
Once most shares have been removed from the hands of other traders (ordinary natural persons), there won’t be much action left to sell at an additional price. In other words, resistance to the bullish movement has been neutralized. Then, in this situation, we can expect a steady increase in prices until syndicated traders perceive prices too high to sell those assets that just bought.
Distribution is the sale of assets, which should ideally be achieved without lowering the price against the sale of the market maker. This operation is done to take advantage of the profits of selling at the conditional peak of a bullish market. At the same time, most of these great players place large orders not even at a fixed cost, but at a range of prices.
If the total volume of transactions is so large that prices are forced to fall, the sale is suspended. Traders have another opportunity to sell securities profitably in the next wave upwards. Once professionals have sold most of their holdings, a bearish market begins because markets tend to fall without professional support.
Now, you understand that big forks see both sides of the market at the same time, which gives them a big advantage over common traders. To better understand the market, study the concepts of strong and weak holders.
Strong forks are professionals who have convenient positions and are able to easily read the market. Despite their ability, they can open more unprofitable operations than profitable ones, but close them quickly, considering losses as inevitable trading costs.
Weak holders are often new market amateurs, tied to their capital and therefore make emotional decisions, which are often at odds with common sense. They are often subjected to market pressure when prices turn against them, which is why they suffer heavy losses.
If we combine these concepts with those described above, we can summarize that: a bullish market is like this when a significant transfer of shares from weak holders to strong holders, usually with a loss for weak holders. A bearish market occurs when there has been a substantial transfer of shares from strong holders to weak holders, usually with a gain for strong holders.
When the market moves from one major trend state to another, an event called a buying or selling climax will occur. As a definition, it is an imbalance of demand and supply that causes a bullish market to become a bearish market or vice versa.
The climax of the purchase arises at a time of high demand for the asset and the active dumping of securities by the big players, which makes continuous growth impossible. In addition, in the bullish bar, the volume looks exceptionally high, accompanied by a new maximum and a widespread. At the end of the purchase climax, the market will close in the middle or high of the candle.
The selling climax, as seen in the name, is the exact opposite of a buying climax and usually occurs at the time of high sales. It presents an extremely high volume in downward movements, accompanied by wide spreads, with the price entering the local minimum. In the last phase of the sale climax, the price will close in the middle or under the candle.
Causes of Price Reversal
There are only two main reasons why there is a reversal of long-term trends in the market:
Most traders panic after observing substantial drops in a market (often from bad news) and usually follow their instinct to sell. Professional traders, in turn, think differently, asking a question: “Are big market players prepared to buy mass stock at these price levels?” If this is fulfilled, this will be a sign that indicates the strength of the market.
After substantial increases, usually for good news, most will get angry by missing the upward movement and will rush to buy. At this point, their professional colleagues are only interested in the willingness of big players to sell enough securities at the current price to meet demand. As you’ve already guessed, mass sales are a sign of market weakness.
Fundamentals of Market Reading
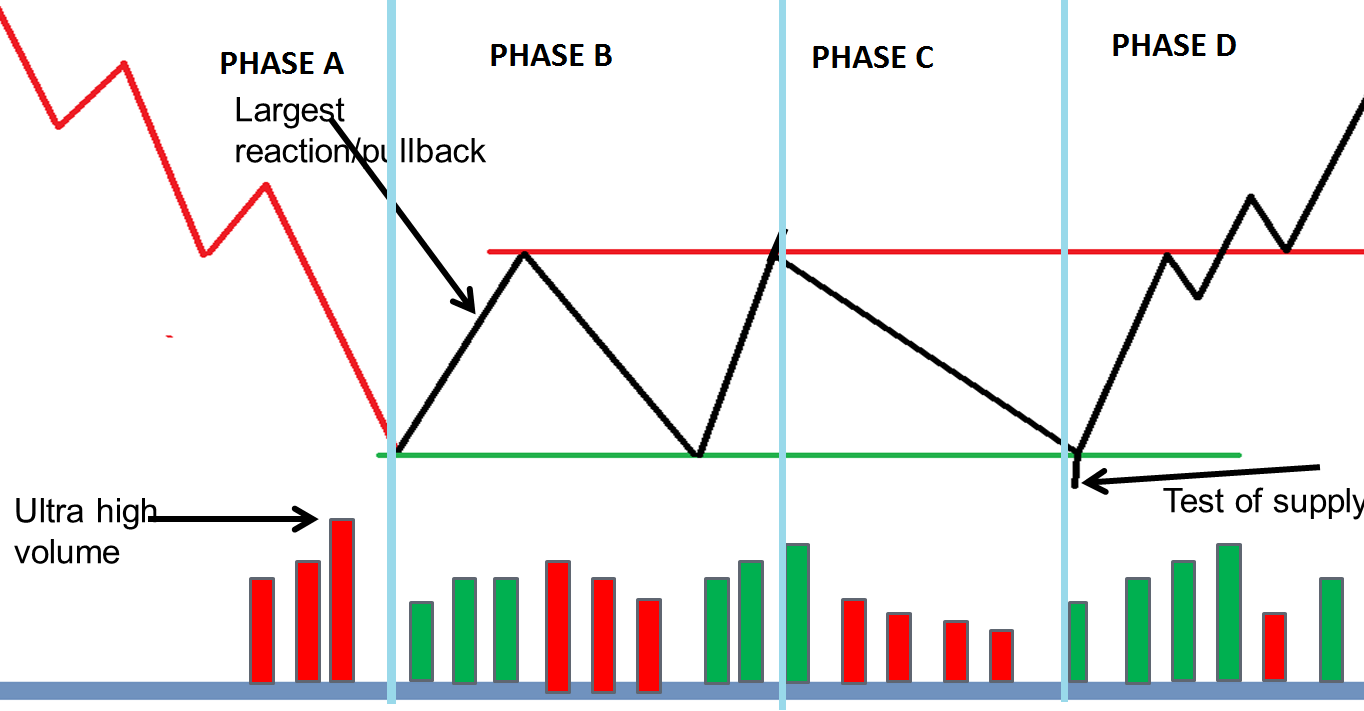
First, it is necessary to understand that markets move in so-called phases. Looking at the changes in volumes and price spreads, we can see that the market builds a cause for the next phase. The duration of the phases may vary. At the same time, it is normally assumed that short phases lead to small changes, while long ones lead to serious steps. In addition, we will group spreads in width, narrow, or simply average, which will allow us to delve into the current processes.
Definition of Market Strength
Marketers generally process and match purchase and sale orders from traders around the world. It’s your job to create a market. To perform its functions, the creator must have sufficiently large participation or values. If you do not have enough quantities on your books to trade at the current price level, you can move the price to a more appropriate level.
Often there are situations in which the bullish movement manages to get a better price from the floor of the bag. Why are you getting a good price? Incredible kindness from the creators? The reason is different. In fact, the market value perceived by market makers is much lower than theirs, because they have already received enough sales orders and want to get rid of them quickly, expecting a reversal of the trend or at least the transition from the market to the uncertainty stage.
Such action, repeated many times with any other buyer, will tend to reduce the spread of the day towards contraction. In other words, the upper price limit will be minimal. If, on the other hand, market makers have a bullish view, they will increase the price on their purchase order, giving you what appears to be a low price. This, repeatedly, causes the spread to expand as the price is constantly marked during the day.
Then, by simple observation of the extension of the bar, we can know the references of those who can see both ends of the market.
Another example is when you find market gaps or price gaps. This term in the technical analysis refers to a situation where there is a gap between the closing of the first bar and the opening of the next bar. For example, the market opens when market makers trap as many traders as possible in a potentially weak market and lose trades and create additional stress. As a rule, weak gaps are always in the zones of new highs, when the news is good and the bullish market seems to last forever.
It should be noted that gaps can be seen in strong markets. However, in such cases, a serious difference can be noticed in the form of an extended plane. Traders who have been trapped inside the channel will panic, convulsively trying to exit the trade at a price very similar to what they first entered. Some of them expect a break in price after having bought assets close at the upper limits of the channel. Others bought at the bottom, but do not see any serious upward movement.
In turn, professional traders are aware of the situation and, looking for the time it takes to sell their own assets, to keep the bullish sentiment raise prices, or open a new candle with a gap up. The volume increases, substantially supporting the movement. This leads to the conclusion that the movement of price is not a deceptive maneuver and the big players really see the strength of the market.
Broad spreads in most cases are designed to block most traders out of the market rather than trying to absorb them. This will tend to postpone, as it goes against human nature, buying something today that could have been bought cheaper yesterday. Such manipulations also frighten market participants who opened short positions near the last minimum in the constant bad news that appeared during this period.
So we draw an obvious conclusion. The volume that usually shows a healthy increase is the bullish volume. However, excessive volume is never a good sign, this indicates that supply can saturate demand. The low volume warns you of a clearly misleading upward movement. In this case, professionals perceive the market as weak, refusing to participate in the bullish movement. The amplifier of this signal will be the presence of a flat before the price jumps to low volumes.
We must also pay attention to the low volume rates in the downbars. This is a sign that the strength of the upward trend remains high, and the upward movement will continue in the foreseeable future.
For a bearish movement, the indications are the opposite. A bearish trend is strong when the falling bars have a high volume. However, excessive volume warns that the fall in price may not be natural and that demand may affect supply.
If the volume is decreasing on bearish sails, the sales pressure is also decreasing, which means that professionals are not interested in a further drop in prices. The market may be declining for longer due to inertia, but, soon, the price may increase due to insufficient supply.
According to the dictionary, someone or something is volatile when it changes or varies easily and unpredictably. Speaking of a financial asset, its volatility or standard deviation is a statistic that describes simply with a number how much the price moves over time. That is the more volatility an asset exhibits, the faster and more extreme its unpredictable fluctuations are.
According to the dictionary, someone or something is volatile when it changes or varies easily and unpredictably. Speaking of a financial asset, its volatility or standard deviation is a statistic that describes simply with a number how much the price moves over time. That is the more volatility an asset exhibits, the faster and more extreme its unpredictable fluctuations are.
According to the dictionary, someone or something is volatile when it changes or varies easily and unpredictably. Speaking of a financial asset, its volatility or standard deviation is a statistic that describes simply with a number how much the price moves over time. That is the more volatility an asset exhibits, the faster and more extreme its unpredictable fluctuations are.
“That morning no one could imagine that John Appleseed would decide, instead of going to his office, to go to the mall with his AK-47 and murder for no apparent reason a dozen of his neighbors. Later, a friend of his commented in tears to the news channel: We don’t understand what happened to him, he seemed so normal, so non-volatile…”
The adjective “descriptive” here is key, as volatility only gives us observable information of past price variations. It tells us nothing about the nature and risk of the underlying process that produces it. This distinction is essential and is often ignored, mistakenly identifying risk with volatility. The adjective “descriptive” here is key, as volatility only gives us observable information of past price variations.
Risk is a difficult, complex, and multidimensional concept. Meanwhile, volatility and other descriptive statistics are a comfortable attempt to reduce their many faces to a simple number. As if the speedometer of the car gave us all the necessary information regarding the risk of driving. Even the CNMV uses a risk scale between 1 and 7 depending on volatility to classify IFs. Thus, a “1” fund has virtually no risk, and a “7” fund is very risky.
“Even the CNMV uses a risk scale between 1 and 7 depending on volatility to classify investment funds… This doesn’t make any sense.”
This doesn’t make any sense. If we imagine a fund that loses exactly -2.00% every month, its volatility according to the standard deviation formula would be zero (it has no volatility) and could be considered “risk 1” on the scale. Perhaps avoiding these contradictions, on the CNMV website they heal in health and hide saying that even if a fund is classified as “1”, it does not mean that it does not have risk. But they don’t explain why.
The Volatility of the Crocodile
Investors seized on the back of a financial product of low volatility. To better understand why it is a mistake to make equivalent risk and volatility, let’s look at the example of the pelican and crocodile. If we observe for a long time the quiet movement of a crocodile by the river, it transmits to us the information that there is no danger, that its movements are slow (little volatile) and we can predict and adapt to them easily.
So, our sympathetic pelican can ask the crocodile to take him to the other end of the shore and trust that he will continue to behave as he has done so far. In this example, the pelican is equating the very low observable volatility of the crocodile with very low risk.
Why does the pelican think there’s no danger? Because if we do not know its underlying nature and only know its volatility (which is observable), the risk of not getting safely to the other shore should be minimal. But all who know the nature of the crocodile know that there is a great and silent (unobservable) danger.
“Why does the pelican believe there is no danger? Because if we do not know its underlying nature and only know its volatility (which is observable), the risk of not getting safely to the other shore should be minimal.”
Crocodiles move most of the time very slowly (they are very few volatile), but occasionally and unpredictably, their behavior changes radically: they move extraordinarily fast (much faster than its past volatility could even make us imagine) to trap in its jaws its trusting victim. Therefore, the mere empirical observation of the behavior of an asset, product, or strategy (its track record) is not sufficient to know the risks we face when investing.
The volatility of a fund or product is not a good measure of risk because it only tells us how much it moves over time, not about the nature and risks of that movement or where the underlying strategy can take us. Risk is too complex and profound a concept to be reduced to a simple and comfortable (for clients and quantitative analysts) number.
The volatility of a fund or product is not a good measure of risk because it only tells us how much it moves over time. It is in the nature of the underlying strategy that the risk of investment funds and products lies, not in their volatility. There are very risky and non-volatile strategies (investment crocodiles). An extreme example is the sale of options out of money.
This strategy produces positive monthly returns over long periods with hardly any volatility, which makes them very easy to pack and market (its track record of continuous increases without volatility, for example of approximately +1% per month, sells very well). Eventually, a crash happens in the markets, causing the investor to lose, if not all, virtually everything previously invested and earned in the fund.
High volatility stock market investment, but harmless in the long run. On the other hand, there are very volatile strategies with little risk, which we might call the Chihuahua investment in our zoo: They move a lot and make a lot of noise, but they are totally harmless.
The trivial example is the investment in diversified stock exchange globally through ETFs or low-cost fund, considered as very risky because of its high volatility (we can temporarily lose half of the investment), but that in the long run will give us a return around double the world’s GDP growth. Paradoxically, it is the risk-averse investors who give up profitable and low-risk long-term investments, preferring low-volatility products that sometimes hide crocodiles.
The reason is more psychological than rational: they can’t bear to see that they are losing money for a while (a key point I already talked about in Volatility and Emotional Accounting). The industry knows this and gives the customer what he asks for, even if it’s not what’s best for him. That is, mostly crocodiles of low volatility instead of (noisy) chihuahuas of high profitability.
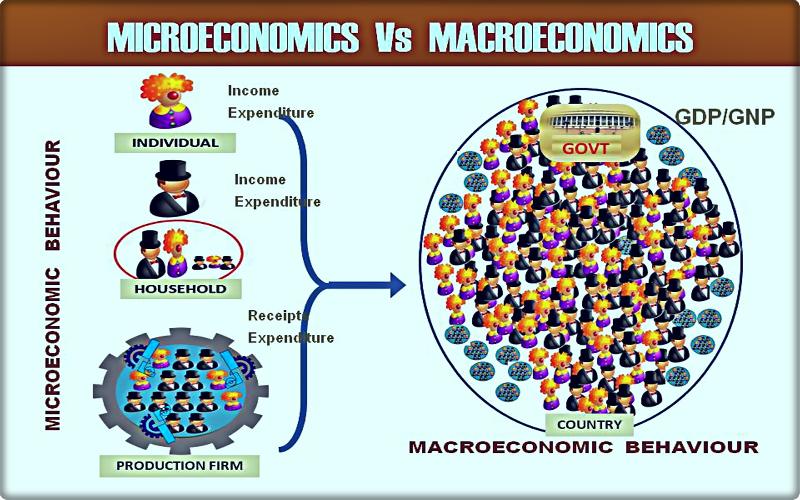
If we want to take our Forex trading to a higher level, it is necessary to have some knowledge of microeconomics and macroeconomics. Perhaps the macroeconomic aspects are more relevant for the trader, but here we will show you everything you at least need to know about both disciplines. Many people who approach the world […]
If we want to take our Forex trading to a higher level, it is necessary to have some knowledge of microeconomics and macroeconomics. Perhaps the macroeconomic aspects are more relevant for the trader, but here we will show you everything you at least need to know about both disciplines. Many people who approach the world […]
If we want to take our Forex trading to a higher level, it is necessary to have some knowledge of microeconomics and macroeconomics. Perhaps the macroeconomic aspects are more relevant for the trader, but here we will show you everything you at least need to know about both disciplines.
Many people who approach the world of Forex or the financial markets in general wonder if they have the right preparation to carry out such activity and some wonder if it is necessary to have a university degree or studies in economics to be able to trade in a market like Forex.
In reality, online broker platforms open the doors to everyone, but having the possibility to invest a certain capital in a particular market is simply an opportunity: does not in any way mean that more specialised knowledge or information can be dispensed with.
On the other hand, a short-term operation like most that takes place in the various currency markets tends to be influenced to a large extent by what happens in the world.
For example, news about a country’s politics makes its currency more or less stable.
But what is Microeconomics?
Microeconomics analyses the decisions of individuals and different economic agents in a theoretical way. This discipline proposes simplified models of reality in order to understand the implications of personal decisions and how to decide.
Is Microeconomics the Economy of the Small?
Not exactly, Microeconomics studies the decisions of the different economic agents from the individual point of view. For example, Microeconomics analyses the decisions of companies, large or small.
How does Microeconomics analyze decisions?
Microeconomics connects the objectives of economic agents with their possibilities. These economic actors will try to achieve their objectives to the maximum extent possible, but bearing in mind that other economic actors will also try to do the same.
What kind of economic agents study microeconomics?
Microeconomics studies the decisions of both individuals and groups as a family, a company, an association… Thus, for example, it stops at the decisions of the State, but also at those of individuals who make decisions within the State.
What forms of expression does Microeconomics use?
It uses three forms of expression: the intuitive way of expressing itself through spoken or written words, the graphical form, and the use of mathematics.
Intuitive: Analyzes decisions through discourse, offering greater proximity to unfamiliar audiences. It has a didactic interest since what is understood either graphically or mathematically must be explained.
Graphs: Very useful when making comparisons and understanding the effects of a certain type of situation on the decisions of individuals.
Mathematics: They are a tool for calculating, but above all for thinking. They provide rigor and conciseness, favoring the analysis of how many factors influence decisions. Many discourses can be replaced with an equation.
Does Microeconomics Help to Understand the Financial World?
Much, more every day. Finance involves many decisions such as how much to save and how much to consume, what to invest in, or how to cover that risk. It also provides tools to understand the strategies that occur in the interrelationship of the actors involved in the financial system.
What about the company world?
One of the growing interests of Microeconomics is to understand the decisions of all kinds that take place in the company. Aspects such as commercial, financial, human resources decisions, etc.
What is the macroeconomy?
Macroeconomics analyses and studies the overall functioning of the economy, in order to explain the evolution of economic aggregates.
What is macroeconomics good for?
Macroeconomics is useful because it allows us to analyse how best to achieve a country’s economic objectives. Economic policy is the tool that governments have to achieve these goals. Objectives such as achieving price stability, achieving economic growth, promoting employment, and maintaining a sustainable and balanced balance of payments.
Some questions we can ask ourselves…
– What are the data that usually have the greatest impact on financial markets?
-Could an increase in consumer prices affect currencies and other instruments?
-Why is economic growth important to investors around the world?
An important part of the fundamental analysis is related to the publication of macroeconomic data. While some indicators have a greater impact than others, the publication of data that takes the market by surprise – either by being published in advance or by exceeding expectations – can cause considerable market volatility.
Employment, the pulse of an economy
Probably the most relevant indicator of an economy’s health is the employment figure. This is because employment directly influences all aspects of economic activity, from supply to demand.
Unemployment rates inform us of the percentage of the total workforce that is unemployed but active in employment and willing to work. A steady rise in unemployment levels is a manifestation of the country’s deteriorating economic situation, negatively perceived by financial markets as a signal to withdraw from the currency. Normally, the market concludes that the higher the level of unemployment, the weaker the currency.
Non-Farm Payroll (NFP)
One of the most important data with the greatest impact on markets is the non-agricultural payroll of the United States. Non-agricultural payrolls are released every first Friday of the month and inform us of new jobs in all sectors except agriculture, as well as the unemployment rate of the previous month.
Given that consumers account for approximately 70 percent of a country’s economic activity, the state of the labour market is of vital importance for the generation of the overall well-being of countries. An improvement in the NFP data indicates that the US labor market is strengthening, improving the outlook for the US economy, and therefore a positive effect on the US dollar.
Inflation, the key to central bank decisions
The main objective of central banks is to promote price stability in the economy. Price stability is measured as inflation changes, so investors monitor inflation reports to determine the future course of central bank policies.
CPI is probably the most important indicator of inflation
Here we are talking about a statistical estimate calculated on the basis of the use of prices of a significant sample of representative products whose prices are collected on a regular basis. The CPI simply measures the rise in the prices of goods and services and is calculated for different categories and subcategories.
If the publication of the CPI is above expectations, this means that inflation pressure is high and the central bank could raise interest rates, which could lead to an increase in the value of the currency.
In general, central banks try to counteract an increase in inflation with higher interest rates, which can lead to a strengthening of currencies. A low inflation rate on the other hand is offset by lower interest rates, which can lead to a weakening of the currency.
GDP – the true color of an economy
It is the largest indicator of a country’s economy and shows the total market value of all services and goods produced in a given year. Impacts of GDP on personal finance, investment, and employment growth. Investors look at the growth rate of a country or economy to decide whether to adjust their asset allocation. They also compare countries’ growth rates with each other to decide where the best opportunities might be. This strategy includes the purchase of shares of companies in fast-growing countries.
When you start in the world of negotiation and trade, it is very convenient to focus on the indicators we have mentioned before, before you want to move forward and delve into other data such as consumer confidence, business surveys, or even retail sales.
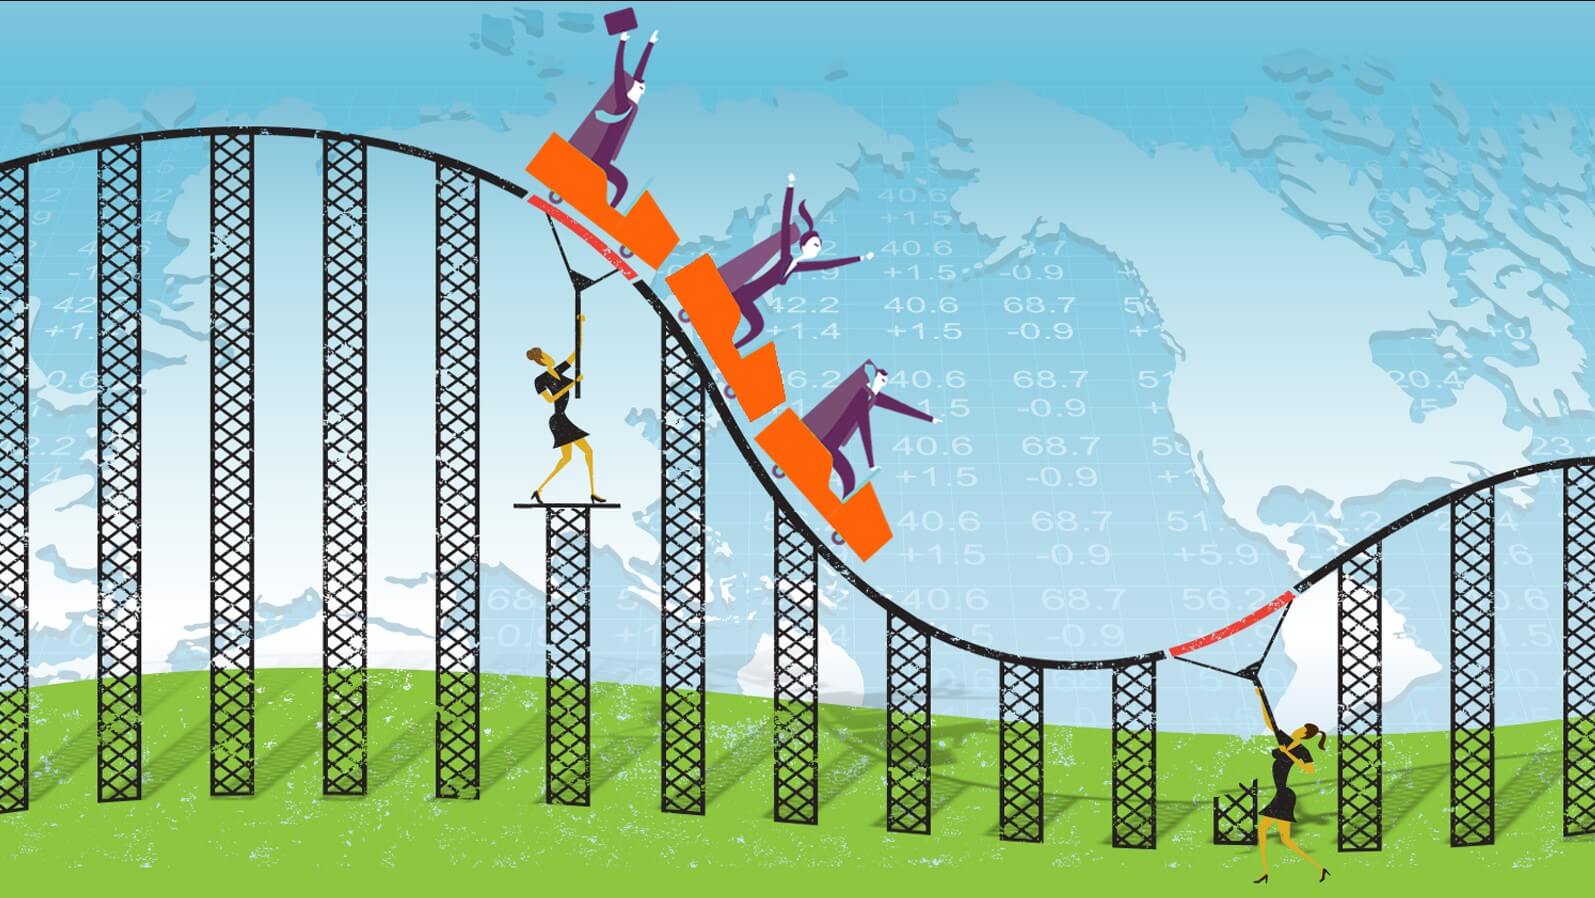
Sometimes currency markets can become extraordinarily volatile. In fact, any market can, depending on what’s been going on. You can be on a good bullish trend, just so a headliner crosses the wires that turn things upside down, causing massive losses. In this article, I will look at the special challenges when it comes to […]
Sometimes currency markets can become extraordinarily volatile. In fact, any market can, depending on what’s been going on. You can be on a good bullish trend, just so a headliner crosses the wires that turn things upside down, causing massive losses. In this article, I will look at the special challenges when it comes to […]
Sometimes currency markets can become extraordinarily volatile. In fact, any market can, depending on what’s been going on. You can be on a good bullish trend, just so a headliner crosses the wires that turn things upside down, causing massive losses. In this article, I will look at the special challenges when it comes to trading in a volatile market.
First Things First: Managing Your Risk
The first thing you need to do is to pay attention to your risk. In that case, it should be the first thing to pay attention to in any business environment. Ultimately, if you do not manage your risk, you will come out of commercial bankruptcy and lose all your capital trading. That’s always gonna be the first thing that comes to mind when you put money into an investment.
If situations continue to become very volatile, then you are considering a situation where protecting your risk becomes even more important, and then you should consider the size of your trade. For me, one of the most effective ways I’ve found to protect capital trading in a volatile situation is to reduce position. In other words, if you normally trade with 0.5 lots, then you may want to trade with 0.25 lots because of the inherent risk in a market that can move very quickly.
Understand that risk managers will also force professional traders to reduce their position. In this sense, professional traders tend to trade with much less leverage than retail traders. It is not uncommon for a professional trader to use leverage 1:6 instead of the 1:200 that many retail traders will use. Part of this is because the trader who trades professionally has an account with a lot of balance, which sometimes has millions of dollars depending on the situation and/or the bank they are working for. When you earn 5%, it means much more in that account than in a 2000 USD trading account in a volatile market.
The Trend Becomes Even More Important
When trading in a volatile market, the general trend becomes much more important. While volatile markets usually indicate some change in trend, the reality is that the long-term trend tends to be what the market is generally set. With this situation, if you are trading in a volatile market, you can want to trade only in the direction of the longer-term trend, which means you should sit on your hands from time to time. I think at this point, it’s probably best to wait for the bigger money to come in and push in the right direction, in addition to keeping your trading position smaller, because of the potential for losses.
Usually, a lot of volatility comes into the hands of fear and possible occasional traders, but when you look at a Forex card, the vast majority of the time the trend is for years. There are times when things come and go drastically, but overall, I think most of these movements end up being value propositions for those who are willing to jump into the fire. That does not mean that it should do so vigorously, it only means that the long-term trend remains largely valid. However, it must have a “line in the sand” when it comes to the longer-term trend and recognizes that a breakdown below or above that line represents a change.
Once the long-term trend changes, the overall strategy changes when it comes to transactions, but this as a rule should be something based on monthly graphs. Knowing that this could cause a lot of short-term pain, the truth is that over time the long-term trend is reaffirmed most of the time.
Sometimes It’s Best to Stay Out of It
Unless there is some kind of important geopolitical or global event, the reality is that you can almost always find a pair for trading that is much less volatile. Ultimately, many traders marry a particular pair of currencies, without understanding that they all operate the same. In other words, if you are normally a trader of the EUR/USD pair, then perhaps you should look in another market if you have become too volatile. Exactly what prevents you from changing the pair and starting to use the EUR/CHF pair? Just stay away from the too volatile currency pair, because it’s not worth it. At the end of the day, he’s simply trying to make a profit, not become a genius in a particular currency.
Higher Frames of Time
Another thing you can do when things get a little volatile is simply going to higher time frames, which will naturally make you reduce the size of your position. For example, you can usually change the graph per hour and risk something like an average of 50 pips. However, if you are forced to exchange the daily graph, you probably have to risk 100 pips on average. Despite everything, you still want to risk the same amount of money for each trade, so it is advisable to start with a smaller position for the market to work its magic over time. This will force you to focus on a more general overview and pay attention to the overall market attitude rather than the everyday noise.
Turn Off the News
You should be careful when paying too much attention to headlines, as they don’t matter. What matters is where prices go, not what a politician says in Brussels, says Donald Trump, or no one else. The markets are true, and the truth can be found in the prices. Beyond that, when things become too volatile, the analysis is much more likely to be deficient, as even the best analysis of the world can be of very little use after a few hours. You should look at the big picture in these situations and just relax.
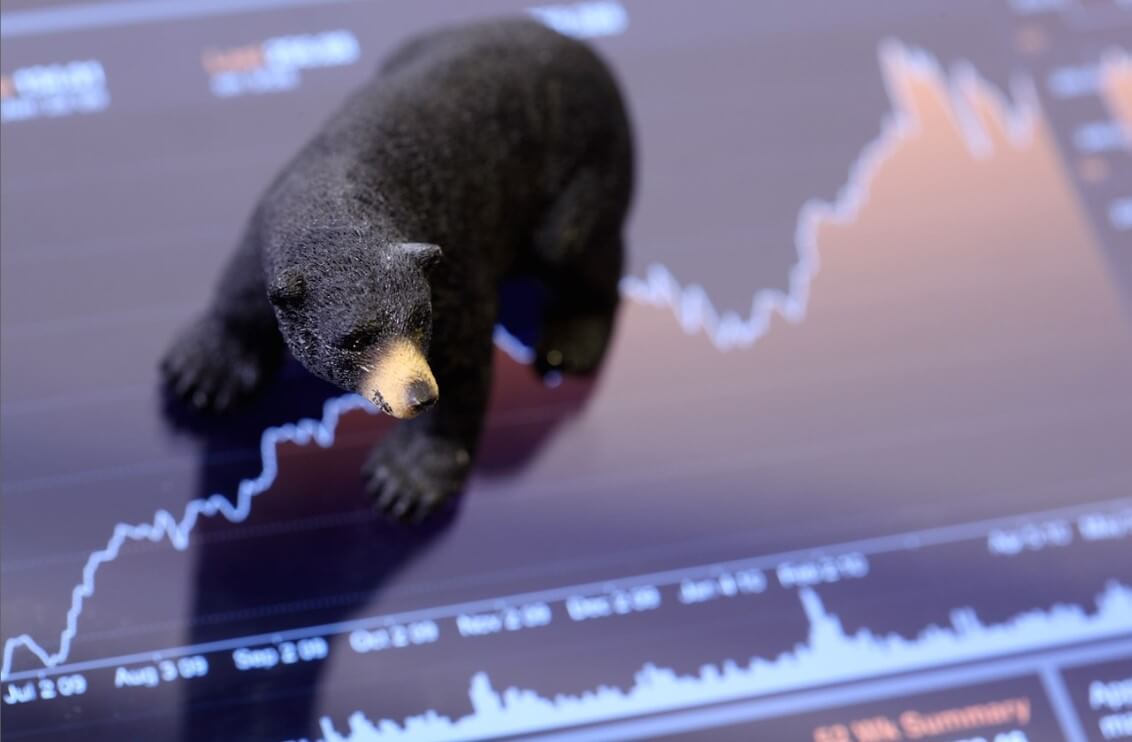
In a bear market, prices are trending downwards, with the most accepted definition being that the market declines more than 20% in value. The opposite of a bear market is a bull market, where prices have increased in value by more than 20%. Although most people prefer to trade in a bull market, it is […]
In a bear market, prices are trending downwards, with the most accepted definition being that the market declines more than 20% in value. The opposite of a bear market is a bull market, where prices have increased in value by more than 20%. Although most people prefer to trade in a bull market, it is […]
In a bear market, prices are trending downwards, with the most accepted definition being that the market declines more than 20% in value. The opposite of a bear market is a bull market, where prices have increased in value by more than 20%. Although most people prefer to trade in a bull market, it is often said that the best traders are made in bear markets when the pressure is on. Still, it can be intimidating to trade in a bear market and some traders avoid this situation altogether. Regardless of whether you have or haven’t traded in this type of market before, you should take a look at our tips for surviving in a bear market below.
Tip #1: Diversify Your Investments
Rather than focusing on one or two instruments, the best strategy in a bear market is to diversify your portfolio by investing in other currency pairs.
It’s best to stick with majors & minors. Avoid exotics.
Consider hedging your trades by trading pairs that usually counter one another so that you can make a profit either way or reduce your loss.
Consider adding other instruments like stocks to your portfolio for more diversity.
Tip #2: Invest in the Right Currency Pairs
In order to trade successfully in a bear market, you’ll need to be able to spot which pairs are worth trading. This may seem difficult at first, as it will seem as though every pair is down.
Look for signs that the market is undervalued and will change soon.
Invest in a pair that is likely to recover soon and you will be able to sell your position at a good price because it was undervalued when you purchased it.
Tip #3: Buy Low and Sell High
This might seem obvious, but the best money-making strategy in a bear market is to buy once the market is close to the lowest price and to sell once the price rises. However, this can be risky because the market could continue to decrease in value.
Look for confirmation that the price is going to rise before buying low. The best indicator of this is a bullish candle.
Be sure to figure out how much you’re willing to risk first and use a stop loss along with your risk-management plan.
Consider using indicators to better trade the trends in the market
Tip #4: Larger Timeframes are Best
You’ll want to look at larger timeframes when trading in a bear market because they can last a long time and shorter timeframes just don’t get you a view of the bigger picture.
Hello and welcome to this latest edition of courses on demand, brought to you by Forex.Academy. In this course, we will be discussing how
[embed]https://youtu.be/JHf9964Cdr4[/embed]
Hello and welcome to this latest edition of courses on demand, brought to you by Forex.Academy. In this course, we will be discussing how
Hello and welcome to this latest edition of courses on demand, brought to you by Forex.Academy. In this course, we will be discussing how to assess market conditions. Just before we begin to explain what’s involved in this Webinar, please take a quick moment to familiarize yourself with our disclaimer. Moving on to our webinar outline, we’ll start with an introduction to market conditions. We’ll then progress on to looking at the three different types of market conditions. We’ll have a look at the role different time frames can play when it comes to identifying market conditions, which is quite important. We’ll have a look at techniques that can be used to objectify market conditions, of course, being objective in the market is a really important skill to have, so we look at that in some detail. We’ll then have a look at the principal of a price cycle and how it can impact market conditions. We’ll finish this Webinar by looking at how to incorporate market conditions into one’s personal training plan, so we’ll make it very relevant and very practical for you as well.
Let’s start with an introduction to market conditions. Before we define what market conditions mean, it is important firstly to note that it is impossible for a trading strategy to work all the time, which is also known as indifferent market conditions. The reality for profitable traders is that, unfortunately, losses are inevitable, and there is no getting away from that basic principle. Now, the reasons for this are often that every trading strategy approach will be built on specific characteristics, which can from time to time contrast with the conditions of a particular market. It’s a case of certain approaches, suitable for certain market conditions, and invariably you will experience times where there’s actually a clash between the market condition and the strategy that’s looking to be adopted. It’s important to take note of the fact that with a trading strategy, it is unrealistic to expect that strategy to work in every different type of muscle, market environment, and market condition. To give you a brief definition, this is the state in which a market trades. In simple terms, markets typically transition between states, or different market conditions, on a regular basis. It is important to note that each state, or market condition, possesses its own unique characteristics, which we will have a look at shortly.
Now, there are three different types of conditions which a market can experience, and I’m sure you’re probably quite familiar with some of these terms. They can be Range Bound, or also known as consolidating markets, but they can also become Break Out market conditions, which have very unique characteristics as well, and also Trending markets. What’s important to take away is that they all have specific characteristics when it comes to the best time to buy or sell, which we’ll be looking to discuss in some detail very shortly. To give you a very quick snapshot, looking at this first graph, we can identify what’s called support and resistance levels on this chart. With the blue lines, we can clearly see and identify that the market bounces off these levels, and it does so on a number of occasions. That presents those that are range-bound traders the opportunity actually to sell. When the price gets up to these levels up here, they look for opportunities and see if they can sell these markets and drive the price lower. They do so on numerous occasions, so that’s how a range-bound trader would look to capitalize; create a trading edge when they trade these markets. The same applies to buyers when they look to trade these market ranges when the price reaches a low. There are certain characteristics which can be used to define a trading opportunity, but in principle, and broadly speaking, they would be looking for opportunities to buy at the lower end of the range and looking to sell the market at the higher end of the range. So, that’s the approach a range-bound trader would like to take when trading a market like this.
Another type of market condition is referred to as a break-out of the market. This is when you receive, or you experience a certain confirmation – which suggests to you that this market is no longer looking to move and stay within a range. So what you find, you need certain confirmation to actually make this trading decision and a trading strategy. Just looking at this candlestick here, you can clearly see we break through with momentum, and we get a close beneath this level. That is a little bit of a game-changer for those that look to trade breakouts on this particular occasion. So, what you will experience is that it will provide an opportunity, in this example, to potentially look to sell this market to the downside.
Now, the third type of market condition. To sort of give you a very brief introduction to a trending market, and what’s important to sort of takeaway from a trending market. This just happens to be a bullish price trending market, meaning prices are pushing to the upside. When you look at a price chart, you will notice that for a trend to be bullish, what you’ll experience is often the price for the beginning of that particular trend to be very much towards the bottom left-hand corner of your trading screen. If the trend is to the upside, what you’ll often experience within that trend is higher prices on the right-hand corner of your trading screen. There are additional characteristics, which we look at in so much more detail very shortly.
To give you a brief introduction and a general overview, you’ve got three significant phases. You’ve got your range-bound market, i.e., a market that clearly moves within a range, you’ve got your breakout markets, and you’ve also got your trending markets. These different types of markets can present traders with some interesting and very profitable opportunities. Let’s take a look at these three types of market conditions in a little bit more detail.
First, we’ll look at range-bound market conditions and the fact that they do possess some very unique characteristics. For a range-bound market to exist, you will need to see the market respect both a clearly defined level of support resistance and see prices bounce off those levels on multiple occasions. I’m just looking at this price chart and using this as a first example. We can work with what’s called genuine levels of support resistance, and you can identify those levels fairly easily. What we can see is a clearly defined range-bound market, which moves from highs to lows and back to highs. It does this on many occasions and therein lies the opportunity for a range-bound trader to, like we’ve alluded to before, look for opportunities to sell the highs at this top edge, and look to buy the lows, which is the bottom edge of this particular range.
Another example to go through would be identifying the price action. Again, looking to determine the range, and there are some specific characteristics that would need to be seen and achieved. When we work with genuine levels of support resistance, we can identify these levels relatively easy. It’s never important to be incredibly precise with the positioning of these supports and resistance because what you can clearly see is the market respecting roughly that sort of level. That gives traders some incredible opportunities to trade.
The three conditions that need to be met for a potential for a range-bound market to actually be performed are as follows; first is with regards to the move. By this, we mean this market is clearly moving to the downside. It creates an initial low, and that low is actually the first important part of the formation of a range-bound market. The second characteristic we are now looking for is actually with regards to the recovery point, and we just refer to it as a point because it does create a high in the market. Initially, the move has been very aggressive and very bearish in this particular example, and it creates a low. Then, we normally get a bit of a recovery point, or a pullback on this market, which creates a recovery point. That’s what range-bound traders look for; they look for these points, wanting the market to behave accordingly in and around those levels. The third characteristic, which would be required to effectively look to establish a range-bound market, would actually be the range-bound trade. This is when your range-bound traders would look to effectively identify an opportunity to actually look to push prices higher, as far as this particular market is concerned.
Again, that gives us some very useful information. If we take it over to the next example, we can go through that same process again, except this time the move is coming from down to up. So, we’re now in a bit of a bullish market, up to this point it creates a high. We get the recovery point, which can be located at this level in here I located at number two. As you can see, the price continues to behave around this level for a reasonable period before, effectively, we get our range bound trade. This is where your range-bound traders would look for opportunities to sell this particular market. If they get an opportunity, they would look to exit around the lower band, whereas on the left-hand side example, a range-bound trader will be looking to buy this market, and they’ll be looking to exit at the top edge. In this particular example, we’ll be looking to a range-bound trade, looking to sell the market at this point and looking to exit roughly around the lower edge, so it obviously presents some very interesting opportunities for traders. That is effectively range-bound market conditions and how traders interpret them.
The next type of market condition we’re going to look at is our breakout market condition. Again, these possess unique characteristics. Firstly, for a breakout market to exist, you will need to see an initial break out of a range-bound market. All breakouts occur from range-bound markets, so straight away, hopefully, you can see the transition from one market condition to another. You will also need to see explosive momentum and volatility in favor of the direction of that particular breakout. To give you a little example, there’s your support resistance levels, and you can clearly see this market breaking above this level. We have the confirmation that we’re looking for, we get to confirm the break. It’s always nice to see the market come from a much lower position. It certainly gives lots of time to look to try and capture this move when we get that breakout trade above that level, looking to drive prices to the upside and that’s what we’ve seen in this particular example. It’s very important that we identified a potential for a breakout and we use our range-bound levels to do that. When we get a breakout of those levels, we can clearly see that we experienced explosive momentum and volatility in favor of the direction of the breakout. If we’re breaking to the outside, we want to see a nice explosive move and look to capture that as a breakout trader.
To give you another example, this time to the downside, we’ve got a slightly different formation in terms of our range. This is effectively a descending triangle, so it’s actually creating a little bit of downward price pressure looking to push prices lower when prices reach these levels and of course we get our breakout trade, which is what we’d be looking to do in this particular example.
The two conditions in this case that need to be met for the potential for a breakout market to be formed; the first one being the initial explosive move close are the momentum closure, should I say above or below the range. If this is our range to the upside, you know, do we get an initial explosive move to the upside? The answer is, we certainly do. In this case, it’s above the range. Do we get continuation with a series of new highs on this particular occasion, where we’re getting this constant sort of pushing or prices? The answer is yes, we do. This is a classical understanding of a breakout market, and it ticks those particular boxes. Now, with this trade to the downside, we’re seeing exactly the same thing, so we’re getting a confirmed close. On this occasion, beneath the range low, we ask ourselves if we get that initial explosive momentum close to the downside below the range. The answer is yes, we do. The continuation can take a variety of forms. As you can see, we’ve got a nice continuation with the following candlestick and a little bit of a pullback before the market starts edging lower. As long as it conforms with seeing an explosive move above or below the range, then it constitutes a great opportunity for breakout traders. Just looking at the final version would be looking at trending market conditions.
Again, they possess quite unique characteristics as well. First, for a trading market to exist, you will need to see an initial break out of a range-bound market, so you will also need to see continued momentum and volatility in favor of the direction of the trend. Most importantly, you will need to see a series of what are called higher highs and higher lows in an uptrend and lower highs and lower lows in a downtrend. To explain this in more detail, we’ll have a look at this particular example on the left-hand side. To identify the fact that this market moves from the bottom left to top right means that we are in a confirmed uptrend pushing prices higher; however, you will also need to see periods of momentum and volatility in the direction in which we’re wanting to trade. There are numerous opportunities where you get nice and green explosive candlesticks in this particular example, pushing prices higher. That should give you more confidence to know that the likeliest response for this market to keep pushing prices higher.
As you can see on the screen currently, there are numerous examples of being able to see and identify that momentum and volatility in the direction of the trend, which in this case is pushing prices higher. What you would also need to see is what’s called a series of higher highs. These are quite easy to identify, and we will refer to it as in this particular example h/h. As you can see, as the market moves it up in favor, we get to experience a higher high, and this happens on numerous occasions, so these highs are actually higher than the previous highs. This is the classical definition of a trend, where you constantly see a series of higher highs back-to-back.
In addition to higher highs, what you would also need to see is the market being supported from the downside. What we mean by that, is you will also need to see what are called higher lows. We call these HL, for higher lows, and as you can see, these higher lows will be printed in a similar fashion to the higher highs. As the market pushes higher, we get a classical understanding of an uptrend, which prints a series of higher highs followed by a series of higher lows. I’ll just finish off these last few, and this is a classical definition of an uptrend, so hopefully, that makes sense. Prices continue to push higher, so in addition to that, we’ll move it along.
We’ll have a look this time at a trending market to the downside in this particular example. Again, what we want to see is the momentum and volatility to the downside, which is overriding the buyers in this particular example, and that’s showing nice continued strength. Keep looking to flush prices lower, so we can physically see the momentum and the volatility in this market. That’s the first thing, and we can see this as this market continues to drop lower now. We can identify this as a downtrend because the price this time is moving from top left to bottom right. What we can see is this market moving in this direction fairly consistently.
Another important characteristic of a downtrend is the fact that we will see it’s the same as an uptrend, but just reversed. We will see a series of what are called lower lows. As the market moves, it’ll print a series of lower lows on numerous occasions as this price moves in favor. This again is a classic definition of a downtrend, but you’ll also get support preventing prices from pushing higher, and these are lower highs. As you can see there, the higher the market, but they’re lower than the previous levels. Again, you get a series of these printed. These are lower highs and lower lows as this market moves down, so this is a classical sort of definition of an uptrend and a downtrend. As you can see, it’s just the polar opposite of each other.
That’s a good overview of the three different types of market conditions, and we hope you can begin to identify and see the opportunities that this can present for different traders whether you’re range-bound, whether you’re a breakout, or whether you are a trader that looks to trade the trend.
Another important topic to look at when we’re looking to identify market conditions is the timeframe in which you are trading. It’s important to note that all market conditions are relevant to the time frame you are wanting to trade, meaning you might experience, for example, a range-bound market followed by a breakout and a trend potentially on a one-minute chart, which you may struggle to see, or you might struggle to identify with on a much higher timeframe. For example, on a four-hour chart now to explain this in a little bit more detail, and let’s share with you a live chart at the point of this recording. I’ll try and explain this in more detail for you. Just looking at this bit of price section, what we can clearly see on a one-minute time frame, and this just happens to be the eurodollar, but what we can see is prices trending to the upside. We’re getting this sort of pattern, where range-bound traders may be looking for opportunities to buy and sell within this framework. As you can see, there would be multiple opportunities potentially, until something happens. At this particular area, we get a little bit of a breakout to the downside, and for that, there’s a level of support resistance, sort of sitting in this level. You can see that the market clearly breaks through that level with a little bit of volatility coming into it, which could present opportunities for breakout traders to look to see if they can push this market lower. This is just an overview effectively of an approach that might be taken from a range-bound trader in a much smaller timeframe.
Look what happens when we increase the timeframe. A lot of that analysis can subside very quickly, indeed. Now, we’re looking at a market which is clearly moving to the downside. It can be argued that there are some clearly defined levels of support resistance sitting in this market, and this market is breaking out to the downside. We’ve got a little bit of a pullback inside that level, so it’s a slightly more convoluted picture. All we’re doing is straddling what we thought was a level of support resistance, which can clearly be defined as actually being relatively close to being a significant level of support resistance, but as you can clearly see, the price action is bouncing above and below it. Now, the view could very much be that this is a range-bound market. Those that look to trade range might look at this price action and identify some opportunities, but let’s increase the time frame again and see what other information it gives us. Again, we are actually able to see a market which has bounced off a low. It’s created a new high and all we’re seeing at the moment is a little bit of a pullback, with some consolidation. At this moment in time, price is moving sideways for a relatively short period of time. Taking that analysis, a range-bound trader might look at this price action and suggest there are opportunities to trade this range. That would be down to the trader’s methodology, as to whether that’s the case. As we go through the different time frames, you can suddenly start to see how choppy this price action really is and that can give you some really useful information. Not only are there identify opportunities and much higher risk opportunities, the lower timeframe you go, and they can be based on a different rationale.
Looking at this hourly chart, you can see that the market has been moving above and below this particular level of support resistance on an hourly timeframe for a significant period of time. Again, if we go up into timeframes once more, the picture begins to change. What we’re looking at here is a pullback of the previous high, and this is for an hourly chart. This is where your pullback traders or your trend traders might look to get involved in this market. The breakout has already occurred. We get a pullback, and they might be looking to buy the pullback in a situation like this. On a daily timeframe, you can see what’s beneath it, which is a significant bull market; however, it must be addressed that market conditions can shift from one market condition to the other. Clearly, on a daily timeframe, we are getting a bull market, but it has to be said that since we’re looking at sort of mid-January, we have moved from a bull market into currently a range-bound market. We’re getting prices that move above and below our levels of support resistance, so therein lies the potential for different types of traders. The necessity really is for any trader to be able to identify the market conditions, obviously, prior to trading them. Hopefully, you found that useful in terms of the importance of timeframes. It can really look to give you a completely different complexion and outlook, depending on the timeframe that you are looking at.
Moving on to techniques that objectify market conditions, this is really about a trader looking to remain objective as much as possible. To give you a brief definition, objectivity is the lack of bias judgment or prejudice, and that can facilitate some significant benefits to traders. Now the question we need to ask, is how can a trader remain objective when assessing market conditions? There are a couple of ways in which we can do this. This is when technical analysts can come into their own because they can use certain training related indicators to help them remain as objective as possible when identifying these market conditions. We’ll go through three of them now.
The first one is just identifying support and resistance. I didn’t find genuine support resistance normally on bigger timeframes, and this will allow you to assess the market conditions properly. So, when we look at price action like this, it’s very choppy. We can literally apply a technique. It’s something that we’ve used in previous slides, and we’ve discussed it a little bit now in detail, we’re simply looking to identify a top edge or a top edge range in this particular market and a lower edge or a bottom edge range. We’re getting this market moving from highs to lows, and doing so in a relatively consistent manner when we identify these genuine levels of support resistance because that’s what’s happening. They’re supporting prices at the lows, and they’re resisting the price from pushing higher at the highs, and that is what can give traders some significant opportunities. As you can see, we have price action, which is slight and obviously slightly bearish to the downside, but very much moving sideways. That’s really what you would need to take away from price action like this, that you are clearly in a range-bound market. You have your range-bound highs and lows, and the market is bouncing in between them. If you happen to be a trend trader, this is not really the market condition in which you would be looking to execute trades. That’s how support-resistance can be used to remain objective. All you would need to do when using support resistance is to basically acknowledge what you are seeing and not psychologically talk yourself out of what is actually happening. That is just a little bit about support resistance.
Another technique that could be used is a basic understanding of Japanese candlesticks, and of course, this works hand in hand with support resistance. An understanding of Japanese candlesticks and their respective support/resistance will help you with objectivity. Again, we’ll have a look at this same chart. We’ll identify those levels of support resistance, as in the previous chart, and we can see that price is slowly moving down, making lower lows and lower highs. There’s a gradual grinding to the downside where we can look at the Japanese candlesticks and the information they’re telling us, which is that we are rejecting prices from moving higher at these levels. It’s doing so on a number of occasions, so that can give those that understand Japanese candlesticks a good opportunity to look to try and sell these markets at these levels. As you can see in this particular example, they can do so on many occasions, and the same applies to the downside.
So, we can identify if we understand Japanese candlesticks and how they respect and react with levels of support resistance. All of a sudden, we can pin this is a range-bound market. For those range-bound traders, this can provide really interesting opportunities to push higher. The reasons why they can make these decisions is because they’ve got a comprehensive understanding of market conditions. Again, you can see the rejection to the downside on many occasions within these areas. You can see the same again just recently, so your range-bound trader would be looking for an opportunity to look to take this price back to the upside. They’ll continue to do so until this range, the market condition that we’re currently experiencing, transitions to a new market condition, so that’s another technique that can be used to object to find market conditions.
When you apply this moving average, you can still identify visually your support-resistance. You can have a comprehensive understanding of Japanese candlesticks, but if you apply a very straightforward simple moving average to the chart (you can do so on any MetaTrader 4 platform), you can generally sort of identify. Don’t forget this is the moving average of each candlestick over a certain period over a certain number of candlesticks. As you can see, you should derive at the same conclusion, which is that this market is ever so slowly drifting slightly to the downside and is very much range-bound because we’re getting prices breaking above the moving average, and below the moving average. This is happening on many occasions, and that’s why a simple moving average can assist you with being able to remain objective about what is truly happening with this market. We can see this moving average, that prices are trading through it on many occasions and that is obviously a good thing for range-bound traders. It can provide them potential opportunities to look to sell the highs and buy lows, and this is just another technique that can be used to assist you with market conditions.
Moving on to price cycles and market conditions, price cycles can also be used by technical traders to support the identification of market conditions. There is cycle theory, and it asserts that cyclical forces both long and short, without doubt, drive price movements in the financial markets and that price cycles can be used to anticipate turning points in a particular market. These turning points can often be identified as periods of consolidation, or clearly defined in indecision, effectively allowing the market to pull back. Do not expect psychoanalysis to pinpoint reaction highs or lows necessarily. Instead, psychoanalysis should be used in conjunction with other aspects of technical analysis and to try to anticipate these turning points to a greater degree. To explain this in a little bit more detail, price cycles can also be used by technical traders to assist with the identification of market conditions.
I want to share this chart with you, this happens to be an S&P 500 daily timeframe, and you can see that the timeframe along the bottom is over the last four years. You can use price cycles, and it’s a well-known price cycle with regards to the S&P. There are a couple of caveats to this because this is a more recent chart. There’s been a number of developments within markets like the S&P 500, which has changed what used to be a little bit more reliable price cycle. Nonetheless, if we roll this on that there’s just a MACD down the bottom of this particular chart, which you can reference as well, and what this particular chart shows is a typical price cycle that you may experience in the S&P 500. The principal of the price cycle in the S&P 500 is that normally between November and April you’re likely to see prices push higher, and from May through to October you’re likely to see a price cycle where prices are squeezed lower. These can move to varying extents, which is why it’s important to make sure if you’re conducting price cycle analysis, that you are combining it with other, more reliable forms of analysis. Nonetheless, in each of these sections of the year, you’re likely to experience prices pushing higher, and you can see that in three out of four out of these periods, even though this middle one here has experienced a significant pullback. It has spent a majority of time retracing that particular pullback. The same applies from the upside, so it has been historically expected for prices to look to move lower during this particular cycle. As you can see, it doesn’t always ring true, but it is important to know that price cycle analysis should be combined with other methods of technical analysis. So that’s just a little bit about price cycle in conjunction with market conditions.
Let’s move on to how to incorporate market conditions into one’s personal training plan. The first thing to do is for you to decide the type of trader that you are. Do you prefer to try ranges, breakouts, or trends? That’s the first thing, because obviously there’s multiple opportunities, depending on your time availability and things of that nature. More experienced traders can trade multiple market conditions as well. Then, it’s just a case of looking to get really good at identifying the unique characteristics of each particular trading style. Whatever approach you want to adopt, whatever fits your personality, your capital, and your time availability. Then focus on the key characteristics of that style and take it on board; obviously, the timeframe that you would like to trade, and of course your tolerance to risk as well. Finish with a personal trading plan, to identify market conditions before executing a trade, something most new and experienced traders really struggle with. Please make sure you first identify those market conditions before you execute a trade. Don’t just jump into the markets blindly.
A basic trading methodology should look to revolve around things like deciding what markets you would like to trade, which is trade selection. Then, identify the market conditions of that particular market, and once you’ve identified that, and this is how it fits into a personal trading plan, then you can focus on the trade setup characteristics.
Let’s say we are a range-bound market. We need to set up the characteristics of seeing those top edges and looking at the Japanese candlesticks on whatever indicator you may be using, or whatever form of technical analysis you may be looking at, to adopt those characteristics and see if that trade conforms with those characteristics. The more criteria that are reached, the more confidence you should have in that trade and the more consistent you should become trading those particular setups. Then, your approach needs to focus intently on trade entry, what price are you actually looking to get into that market, and of course trade exit as well. So, we’re talking about risk management and making sure that you always draw that line in the sand, in terms of making sure that you mitigate risk obviously as quickly, or as well as you possibly can, and really have a strong focus on protecting your capital. The final part is obviously the trade management side, which will hopefully lead to a successful outcome for you. Within trade management, you’re talking about how you can mitigate risk. Can you look at a book and profit in that particular trade? Should we be looking to cover the position, or take profit? Whatever the case may be, you’re managing that trade as effectively as you possibly can. This is just an example to show you how identifying market condition fits in with an overall trading approach.
That just about concludes this particular Webinar. To review, we’ve introduced market conditions, and we’ve looked at the three different types of market conditions. We’ve looked at the importance of looking at different time frames, we’ve looked for some techniques to objectify market conditions, we looked at price cycle, and market conditions as well. Finish there with how to incorporate market conditions into one’s personal trading plan. All that’s left for me to do is to thank you very much for joining us on this latest installment of courses on demand, which have been brought to you by Forex.Academy. We hope you enjoyed it and we hope to see you soon. Do take care and we’ll see you soon. Bye for now.