Introduction
In any economy, the real estate market provides insights about households’ sentiment of the future and their present welfare. Policymakers, central bankers, businesses, economic analysts, and individual consumers track real estate data. They do so, to deduce, in one form or another, information about the state of the economy. The Existing Home Sales figure is estimated to account for up to 90% of total home sales. For forex traders, existing-home sales data provides an invaluable insight into the economy.
Understanding Existing Home Sales
Existing homes are homes owned and occupied before being listed in the market. Therefore, existing home sales as an economic indicator show the data on the sale of homes pre-owned and pre-occupied before being listed in the market.
Existing home sales data captures the prices and sales volume of existing homes in a country. It is worth noting that the existing home sales data strictly records transactions that have been completed. This record is unlike the new home sales, which includes data on partial payments and agreements of sale.
Calculating Existing Home Sales
Each month, a survey is done to determine the volume of existing-home sales and their prices. In the US, for example, a survey is done by selecting a nationally representative sample of 160 Boards and Multiple Listing Services. This sample represents about 40% of the total existing-home sales.
A non-seasonally adjusted data on existing home sales is derived by aggregating the raw data from the sample. The aggregated data is then weighted to represent the national existing home sales accurately.
A seasonally adjusted existing home sales data is arrived at by annualizing. This adjustment helps to smoothen out the disparities that arise due to seasons. Here’s how the disparity comes along. Research has shown that home resales are higher during spring and summer and slows down during winter. Therefore, from November to February, the resale of homes is lower. Typically, it is assumed that people tend to search for homes when the weather conditions are more agreeable, thus increasing demand and, with it, prices of homes. This seasonal difference is removed with annualizing, creating a more realistic trend in the existing home sales.
Note that the annualized existing home sales for a particular month show the resales the month represents if the resale pace for that month were to be maintained for 12 consecutive months.
Using Existing Home Sales in Analysis
As an economic indicator, existing home sales are regarded as a lagging indicator. However, since the data shows the changes in the number of home resales and the prices, it can provide invaluable insight into the trend of households’ welfare and the general economic health.
Most of the transactions in real estate involve mortgages. Let’s take an example of an increase in existing home sales shows that more households can afford and service mortgages. This increase could be for a number of reasons.
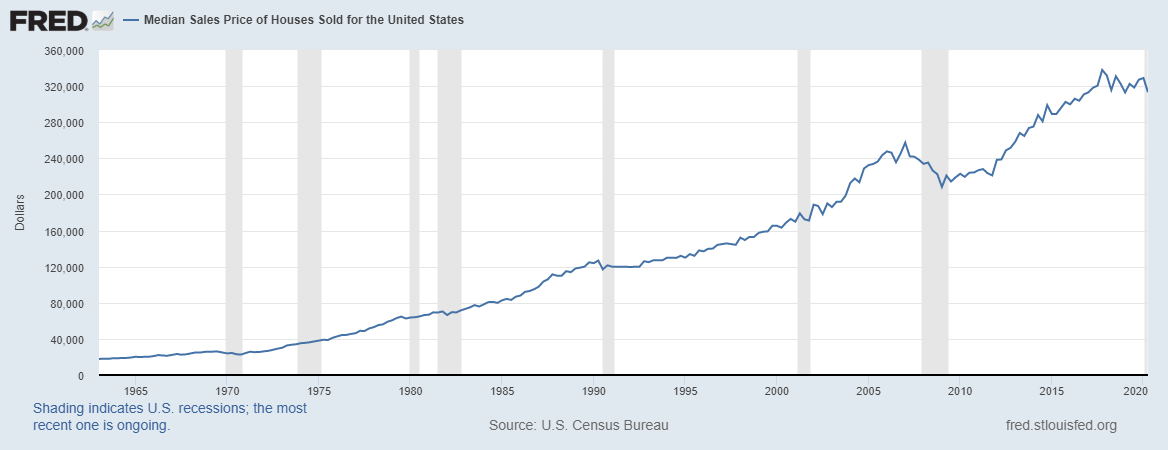
Source: St. Louis FRED
Firstly, it could show that the welfare of the households has improved. The improvement could result from an increase in disposable income or an increase in the rate of employment. Increasing disposable income means that households have more money to invest in the real estate market, whether speculatively or not. An increase in the employment levels, on the other hand, means that households who previously could not afford to buy a home are now eligible for mortgages. I both these instances, the existing home sales data shows that the economy is expanding and the welfare of households is improved.
Secondly, increasing home sales imply that interest rates are low, allowing more households to borrow cheaply. The availability of lower interest rates shows that the demand in the economy is bound to increase, which leads to economic growth.
Thirdly, since existing home sales involve the current homeowners selling their property, it means that they believe they can get better rates in the current market. This is especially true for speculative investors who participate in real estate to profit from price fluctuations over time. Now, a speculative homeowner buys a home at a lower price to resell when prices are higher. An increase in the price of homes means the economy is currently performing better than it previously did. Thus, an increase in the existing home sales shows economic improvement.
Similarly, current speculating home buyers offer the sentiment that they believe the economy is going to perform better in the near term. Therefore, existing-home sales data can be used to show periods of economic recoveries and forestall an impending recession.
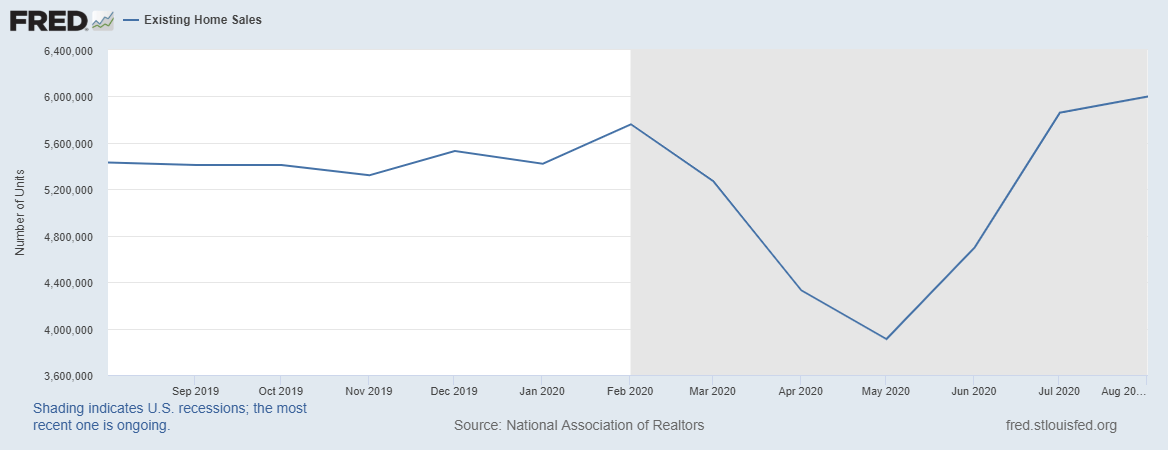
Source: St. Louis FRED
Impact on Currency
As we have seen, existing home sales can be used to gauge how the economy is performing. Although it is lagging, it can be used as a leading indicator for the aggregate demand in the economy as well as the general economic health. Let’s see how this analysis affects the forex market.
An increase in the existing home sales shows that the economy has been performing well. It also indicates that households’ welfare is improving, with higher employment levels and increased disposable income, which can further influence the growth of the economy. Similarly, since an increase in the existing home sales offers the sentiment of a perceived economic improvement, it translates to the increasing value of the country’s currency.
Conversely, a country’s currency will depreciate as the existing home sales reduce. Continually dropping existing home sales imply worsening economic conditions for the households. These adverse conditions could result from increasing unemployment levels, higher income taxes, or general anticipation of challenging economic conditions that force households to cut back on discretionary expenditures.
Sources of Data
The National Association of Realtors is responsible for the survey and the publication of the US existing home sales data. An in-depth and historical review of the existing home sales data, both seasonally and non-seasonally adjusted, is published by St. Louis FRED. Trading Economics publishes global existing home sales data.
How the Monthly Existing Home Sales Data Release Affects Forex Price Charts
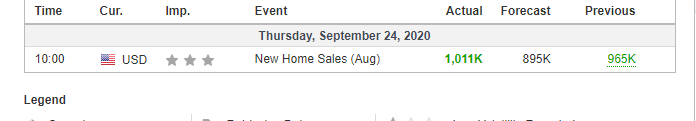
The most recent existing-home sales data in the US was released on September 22, 2020, at 10.00 AM ET and can be accessed at Forex Factory.
The screengrab below is of the monthly existing home sales from Forex Factory. To the right is a legend that indicates the level of impact the fundamental indicator has on the USD.
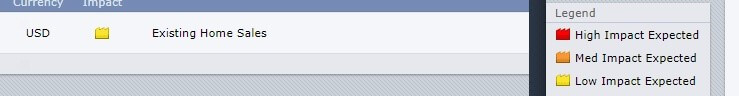
As can be seen, this is a low-impact indicator.
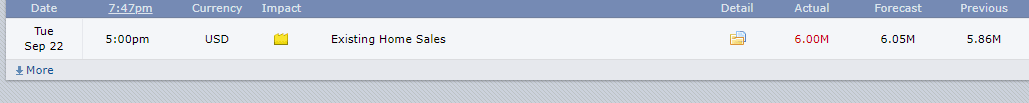
In August 2020, existing home sales were 6m compared to 5.86m in July. The sales were lower than analysts’ expectations of 6.05m.
Now, let’s see how this release made an impact on the Forex price charts.
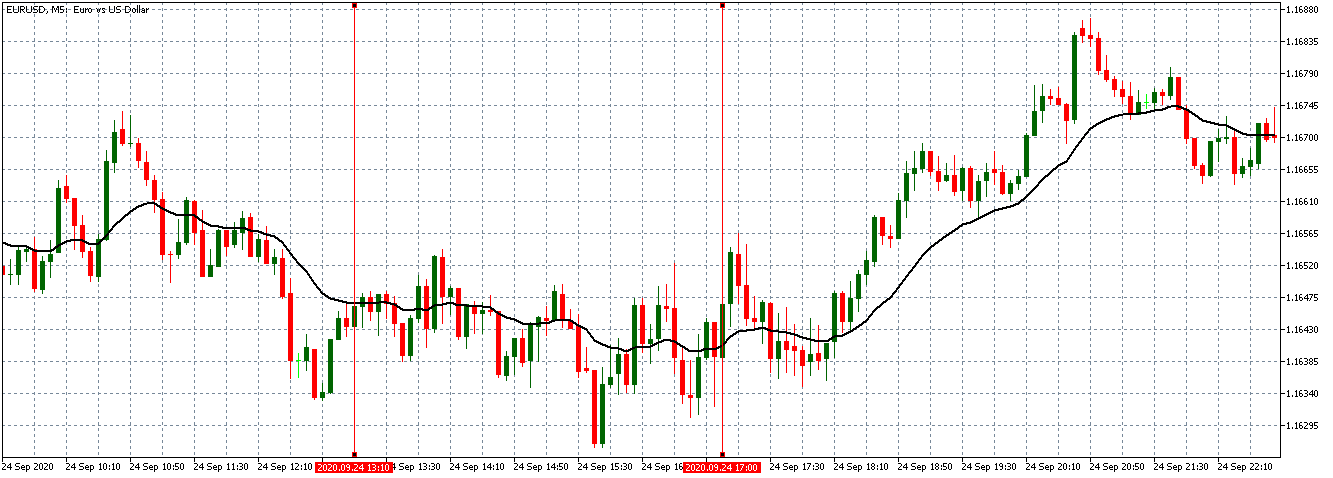
EUR/USD: Before Existing Home Sales Release on September 22, 2020,
Just Before 10.00 AM ET
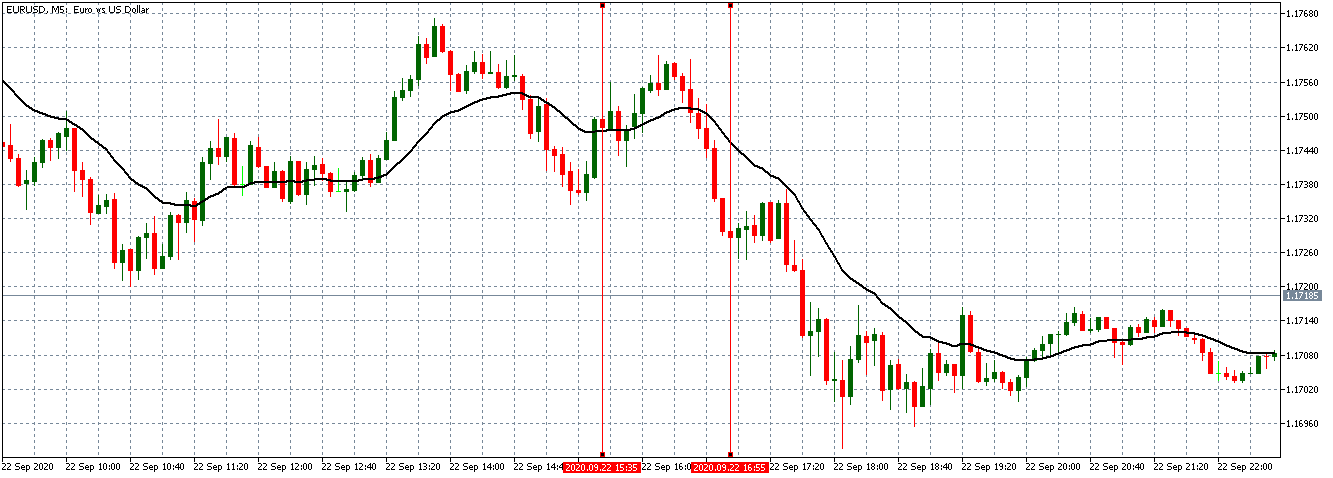
The pair was trading in a new-found steady downtrend. This trend can be seen with the 20-period MA steeply falling with candles forming further below it.
EUR/USD: After Existing Home Sales Release on September 22, 2020, at 10.00 AM ET
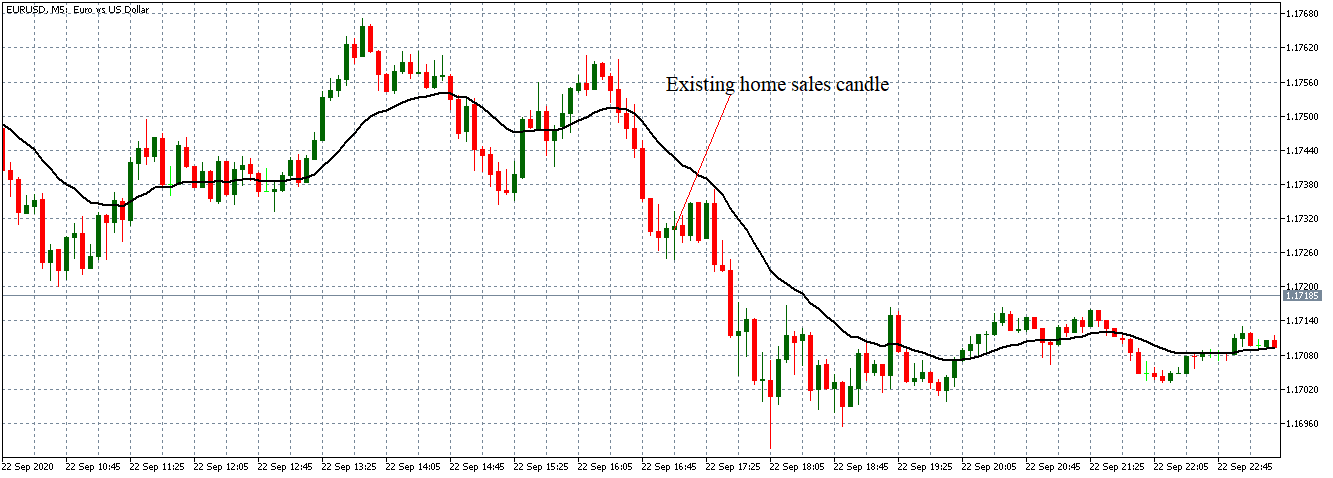
After the news release, the pair formed a 5-minute ‘Doji’ candle. Subsequently, the pair continued to trade in the earlier observed downtrend.
Bottom Line
As expected, the existing home sales release had a negligible effect on the EUR/USD pair. Therefore, we conclude that in the forex market, existing-home sales data is a negligible indicator.