Categories
Forex Fundamental Analysis

Understanding What ‘GDP Deflator’ Is & Its Relative Impact On The Forex Market

Introduction

Investors and traders are continuously trying to determine which country is growing relatively faster to make currency investment decisions. Assessing growth for capitalist economies that use inflation as fuel can be tricky to understand. The differentiation between nominal and real growth, effects of inflation, and the role of a deflator are necessary to understand to arrive at correct conclusions from statistics.

What is GDP Deflator?

Most of the economies that we have today are capitalist economies and use inflation as the primary fuel for growth. Currency traders want to go “long” on currencies of countries that are experiencing relatively higher growth than other countries. Hence, a correct assessment of growth is crucial.

The broadest and most widely used measure of the growth of economies is the Gross Domestic Product (GDP). The GDP is the monetary measure of all goods and services produced within a country for a given period (quarter or year). Although, before GDP, Gross National Product (GNP) was widely used to compare growth amongst economies. GNP measures growth beyond borders and has certain limitations in its usage as a growth measure.

GDP Deflator

It is also known as GDP Price Deflator or Implicit price deflator. It measures the price changes in all goods and services produced within an economy. It measures inflation at the macroeconomic (or national) level. As prices of commodities increase over time, the GDP values are “inflated” over time.

For instance, a country that has a GDP of 10 million dollars for the year 2019 and 12 million dollars for the year 2020 would appear to have grown 20%. If the inflation rate for the duration was 10%, meaning the prices rose by 10% for all the commodities, then 1 million dollars out of 12 million dollars came purely through increased prices and not increased production. Hence, in 2020, the real GDP was only 11 million dollars. Therefore, real growth was only 10% instead of 20%.

The Nominal and Real GDP figures are vital to understand and measure the level of inflation by calculating the GDP deflator. The following formula gives the GDP deflator:

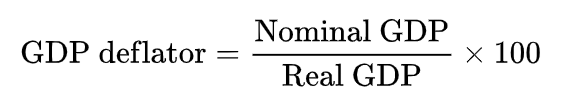
Here, the nominal GDP is the total dollar value of all commodities produced in an economy without accounting for inflation. It is a direct monetary measure of goods and services. Real GDP is the inflation-adjusted value of GDP. It strips away the effect of inflation from Nominal GDP to show real growth.

Deflators like the Real GDP also have a base year against which all other years’ figures are compared. For the United States, 2012 is the base year, meaning GDP deflator value for the year 2012 would be 100 (as nominal and real GDP would be equal due to zero inflation). Subsequent years will have higher or lower values accordingly to indicate inflation and deflation, respectively. The base year varies from country to country.

How can the GDP Deflator numbers be used for analysis?

It is essential to understand how inflation masks the real growth and leads us to make the wrong conclusions. As seen in the above example, countries may show higher and higher GDP figures, but in reality, they may have only achieved little or no growth at all. When comparing growth over several years, the GDP deflator is key to the analysis to strip away the effects of inflation. By employing the equation above, if we get a deflator score of say 110, it would indicate there is a 10 percent inflation during the observed period.

The Consumer Price Index (CPI) is the most popular and widely used indicator to measure inflation. The GDP deflator has some advantages over the CPI. As the CPI measures inflation for a fixed basket of goods and services, which does not change frequently, the GDP is a macroeconomic aggregate measure of inflation. The GDP deflator factors in any change in economic output and investment patterns. Any new change in the goods produced or change in the consumption patterns of people is accounted in by the GDP deflator, unlike CPI. The CPI basket is static and cannot account for commodities price changes that are not in the basket, whereas the deflator is all-inclusive in this regard.

It is also necessary to know that CPI includes the most commonly used goods and services that have an impact on the economy. It updates its basket as patterns change over the years. Hence, over time the GDP deflator and the CPI have similar trends and can be used interchangeably.

Impact on Currency

The GDP deflator is a basic measure of inflation that erodes currency value. It is an inversely proportional lagging indicator. High values of the deflator are bad for the currency value and vice-versa. Since it is one of the measures of inflation, it is a low-impact lagging indicator as it is not as popular and as frequent as the CPI. It is a quarterly statistic, whose effects are already priced in through more frequent inflation measuring statistics.

Economic Reports

The Bureau of EA releases quarterly reports of the GDP price deflator alongside the quarterly GDP figures on its official website for the United States. GDP and deflators are essential macroeconomic indicators, and therefore are available on the World Bank and many other international organizations like the OECD, IMF, etc.

Sources of GDP Deflator

The BEA releases its quarterly GDP deflator statistics on its official website for the public.

The World Bank also maintains GDP and GDP deflator statistics for most countries on its official website.

Deflator figures for most countries can be easily found on the Trading Economics website.

How GDP Deflator Data Release Affects The Price Charts

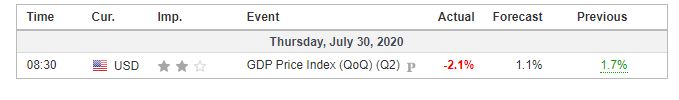
In the US, the GDP deflator is released by the Bureau of Economic Analysis quarterly, about 30 days after the quarter ends. It measures the annualized change in the price of all goods and services included in gross domestic product; and is the broadest inflationary indicator. The most recent data was released on July 30, 2020, at 8.30 AM ET can be accessed at Investing.com here. An in-depth review of the GDP deflator data release can be accessed at the Bureau of Economic Analysis website.

The screengrab below is of the GDP deflator from Investing.com. On the right, a legend indicates the level of impact the fundamental indicator has on the USD.

As can be seen, GDP deflator data is expected to have a medium impact on the USD after its release.

The screenshot below shows the most recent changes in the GDP deflator in the US. The GDP deflator changed by -2.1%, worse than analysts’ expectations of a 1.1% change. This change is expected to the negative for the USD.

Now, let’s see how this release made an impact on the Forex price charts.

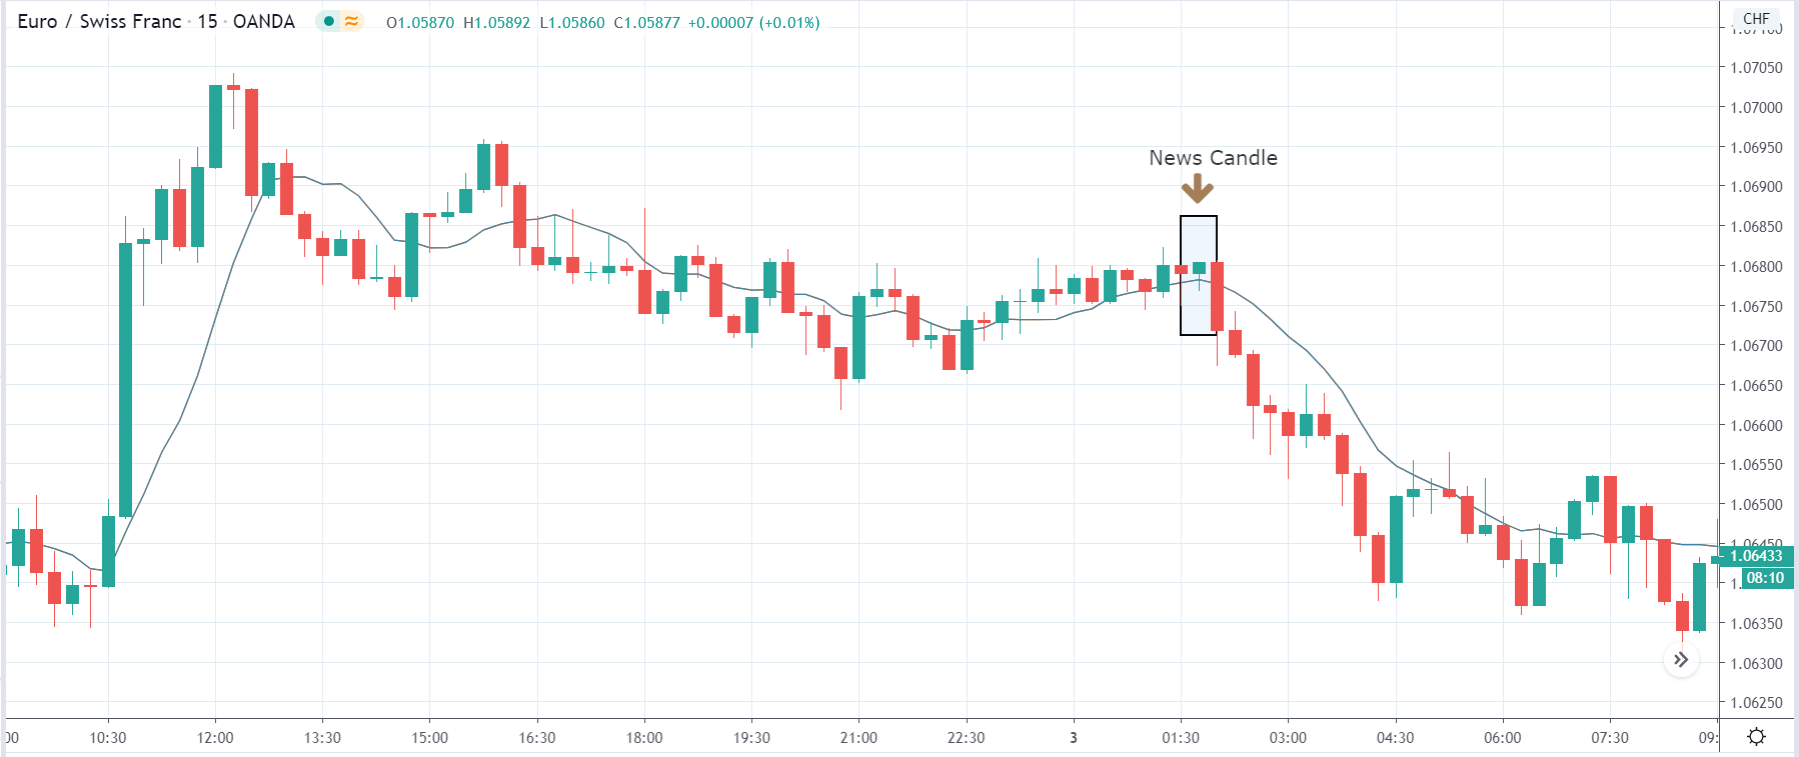
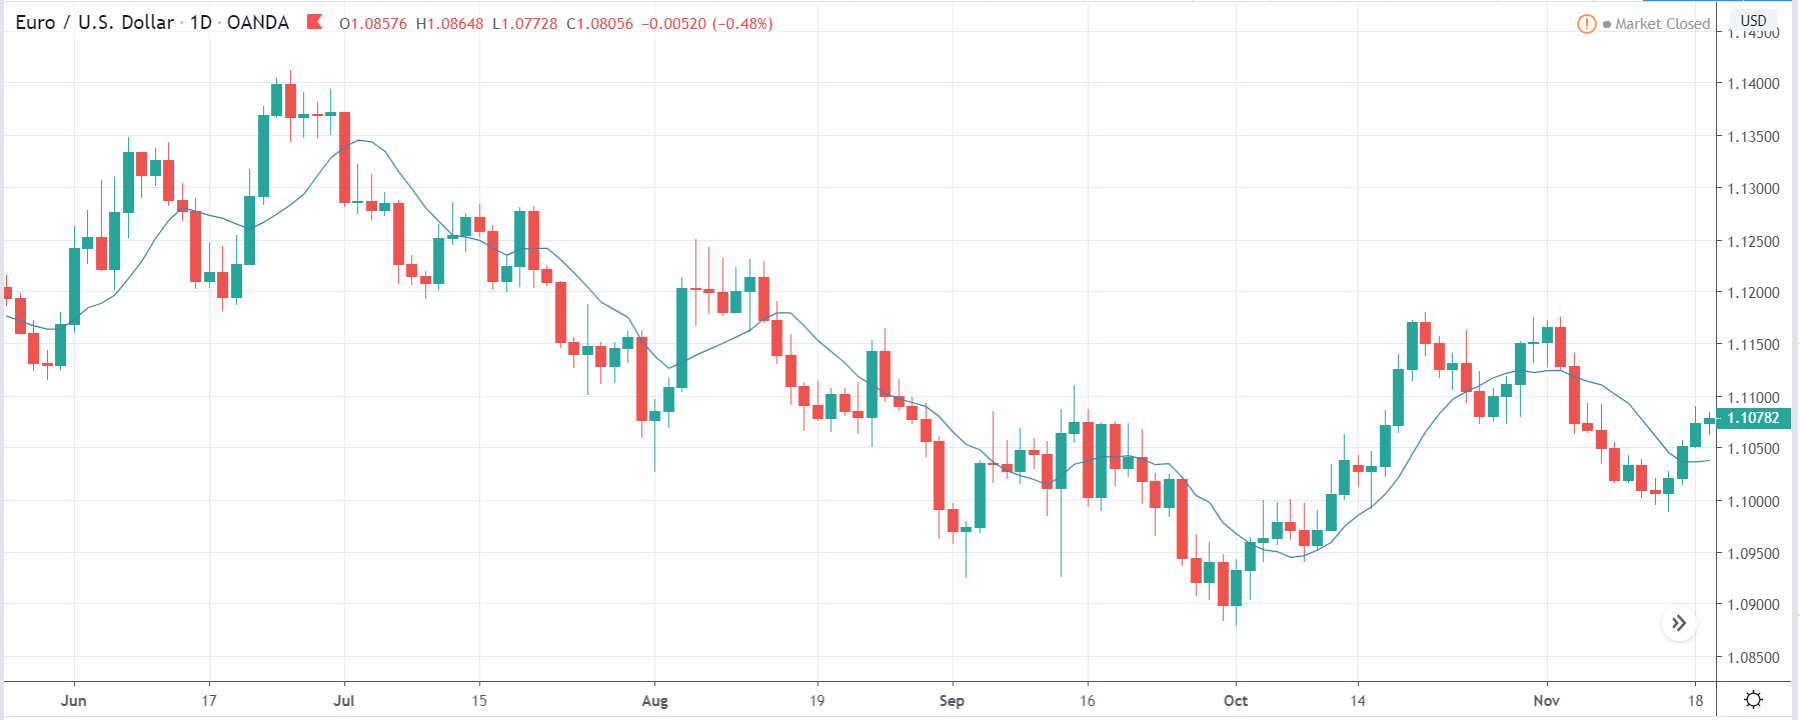
EUR/USD: Before the GDP Deflator Data Release on July 30, 
2020, Just Before 8.30 AM ET

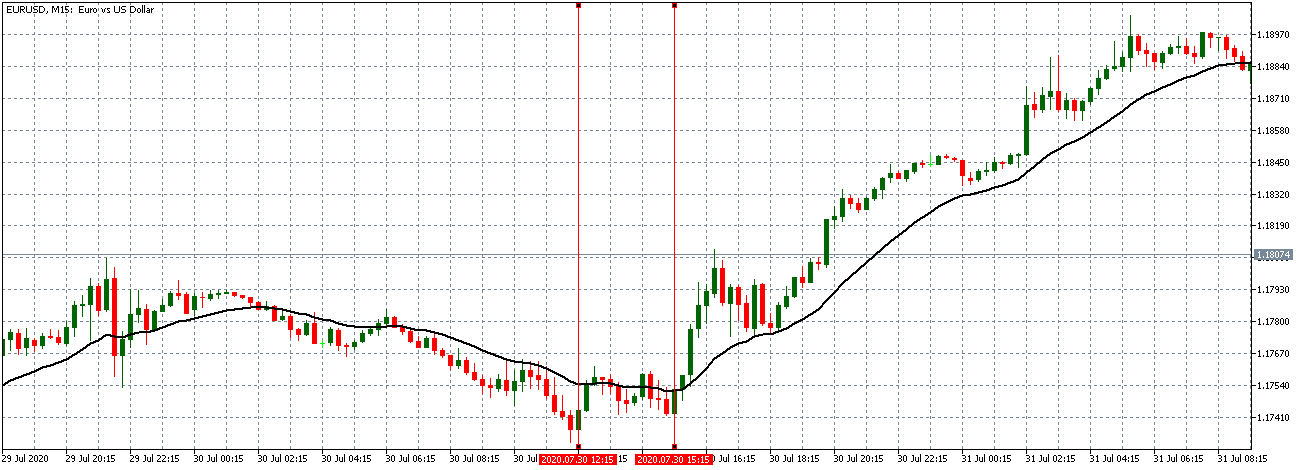
Before the news release, the EUR/USD pair traded in a neutral pattern. This trend is evidenced by the 15-minute candles forming on an already flattened 20-period Moving Average, as shown in the above chart.

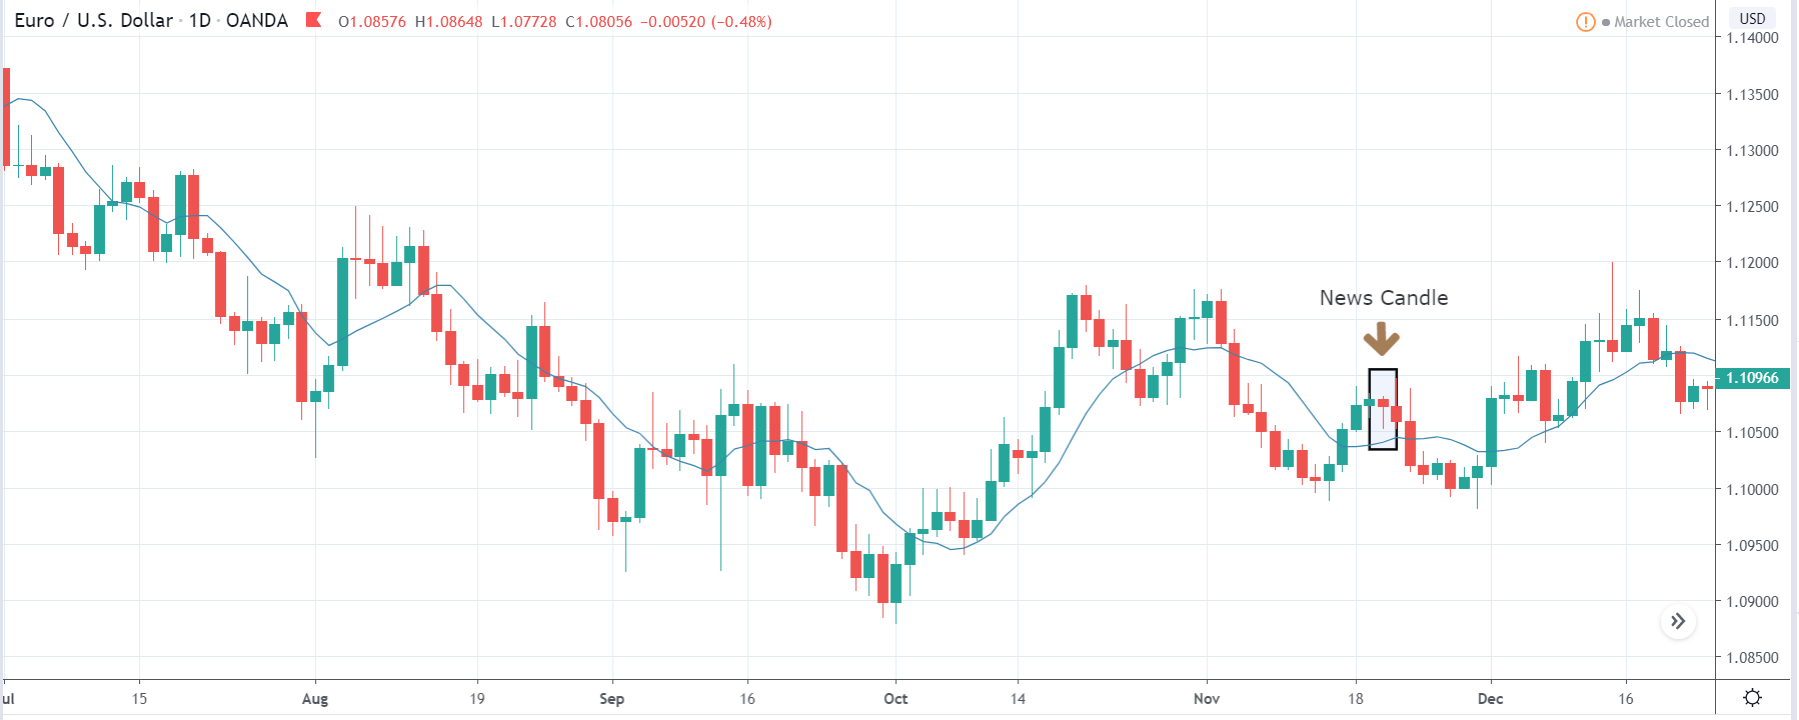
EUR/USD: After the GDP Deflator Data Release on July 30, 
2020, at 8.30 AM ET

After the data release, the pair formed a 15-minute “hammer” candle. This trend is as expected since the USD weakened against the EUR. The data release was significant enough to cause a change in the market trend. The market adopted a steady bullish stance as the pair traded in an uptrend with the 20-period Moving Average steeply rising.

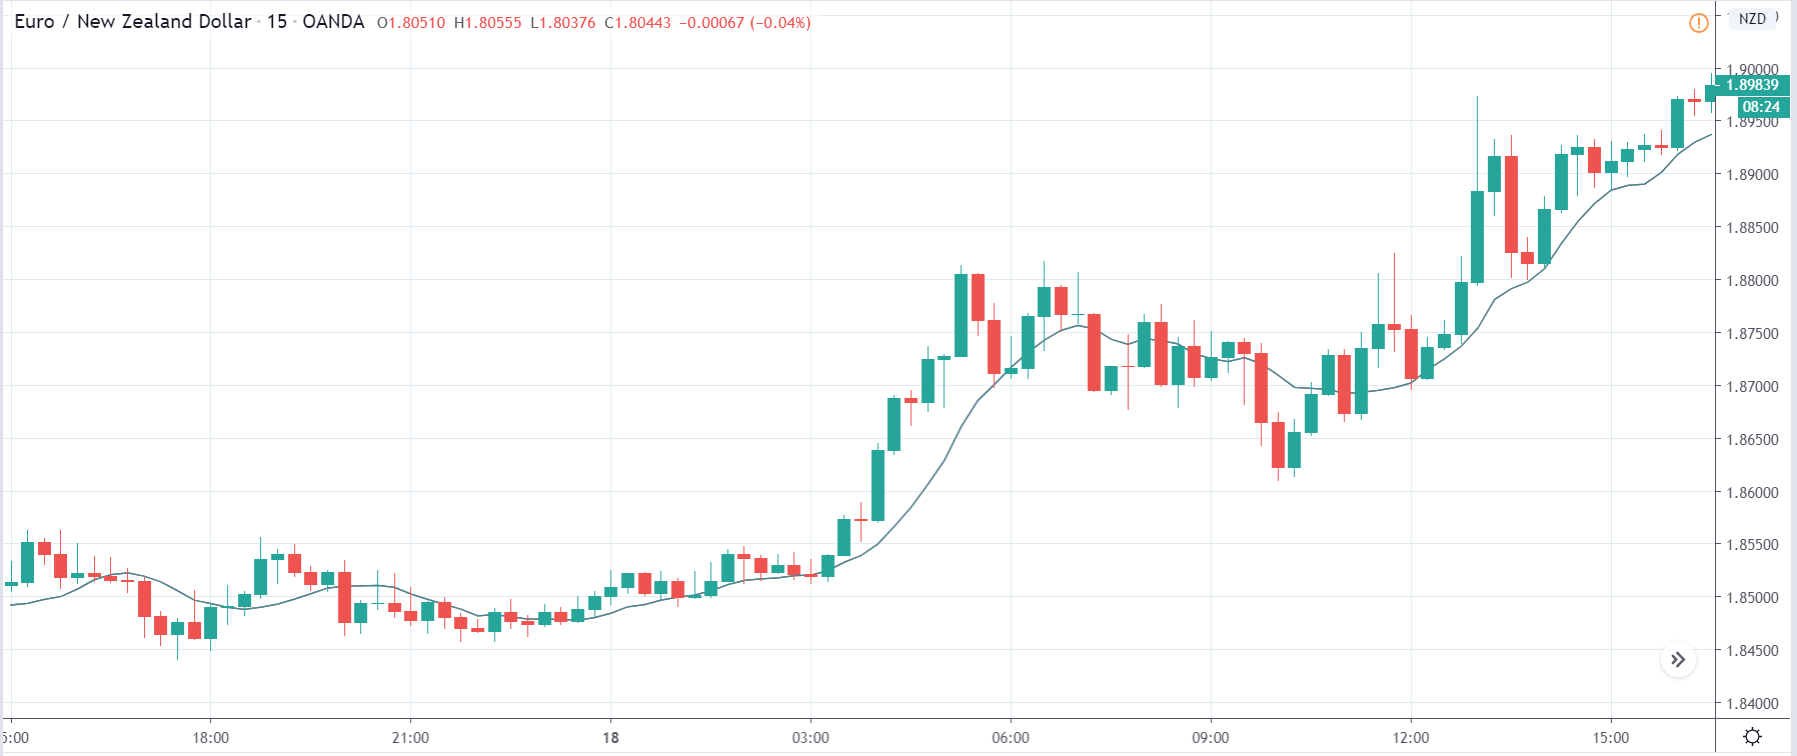
GBP/USD: Before the GDP Deflator Data Release on July 30, 
2020, Just Before 8.30 AM ET

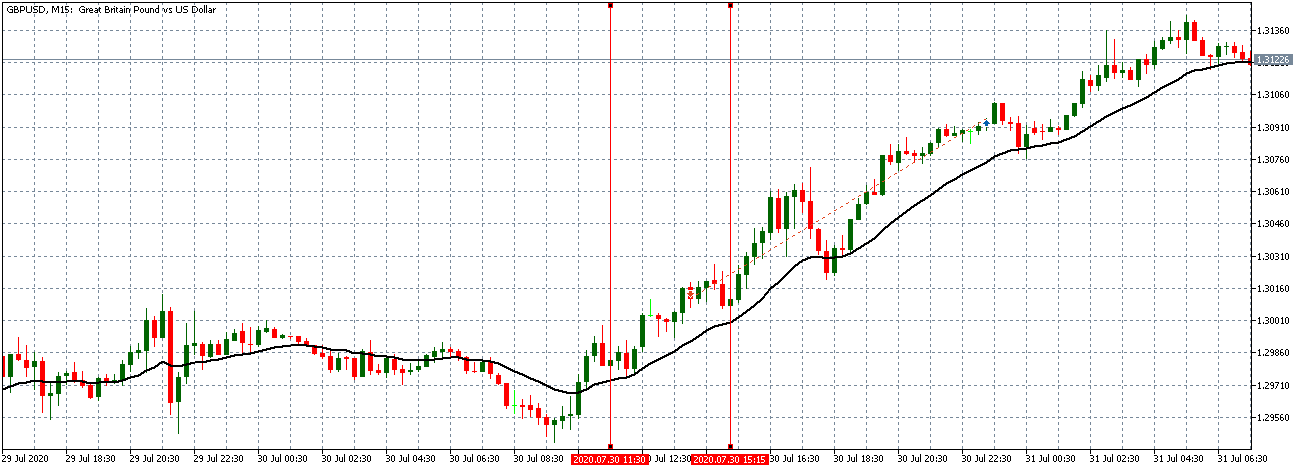
Unlike the EUR/USD pair, the GBP/USD pair was trading in a steady uptrend before the data release.

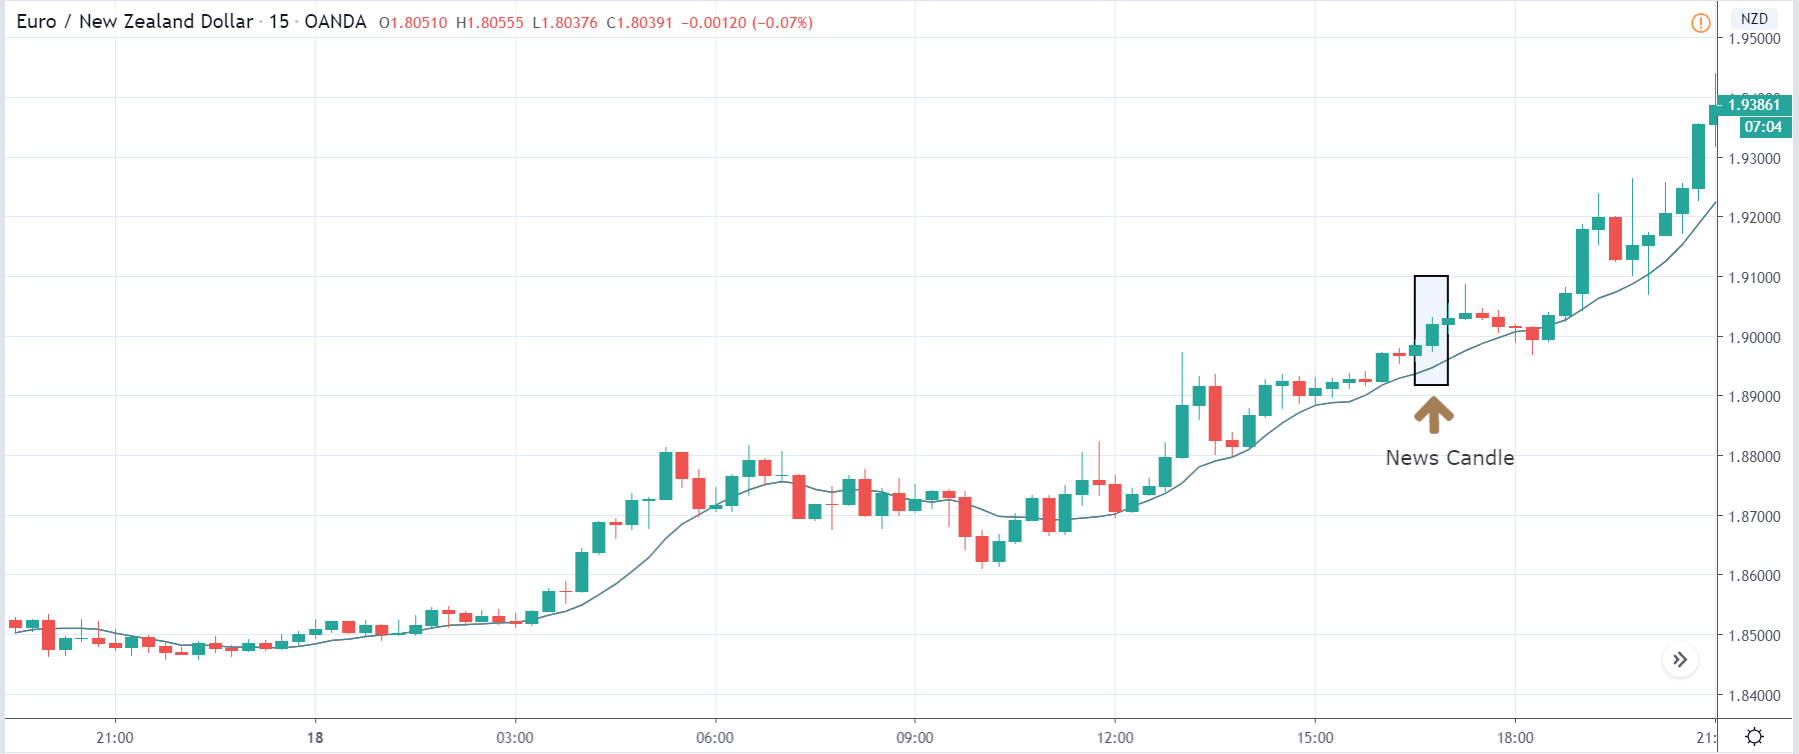
GBP/USD: After the GDP Deflator Data Release on July 30, 
2020, at 8.30 AM ET

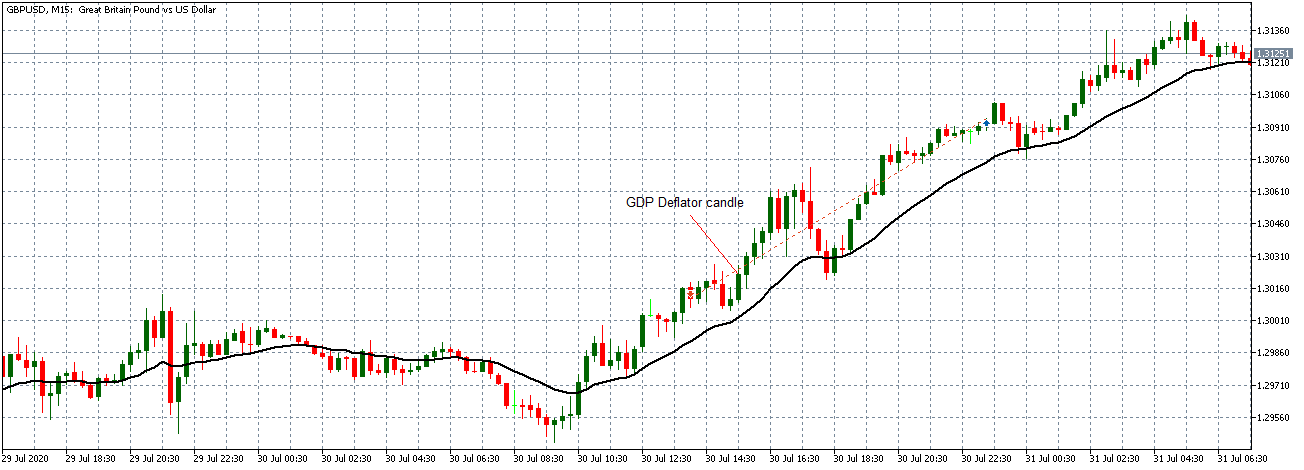
After the data release, the pair formed a bullish 15-minute candle. It subsequently traded in a renewed uptrend with the 20-period Moving Average steeply rising similar to the EUR/USD pair.

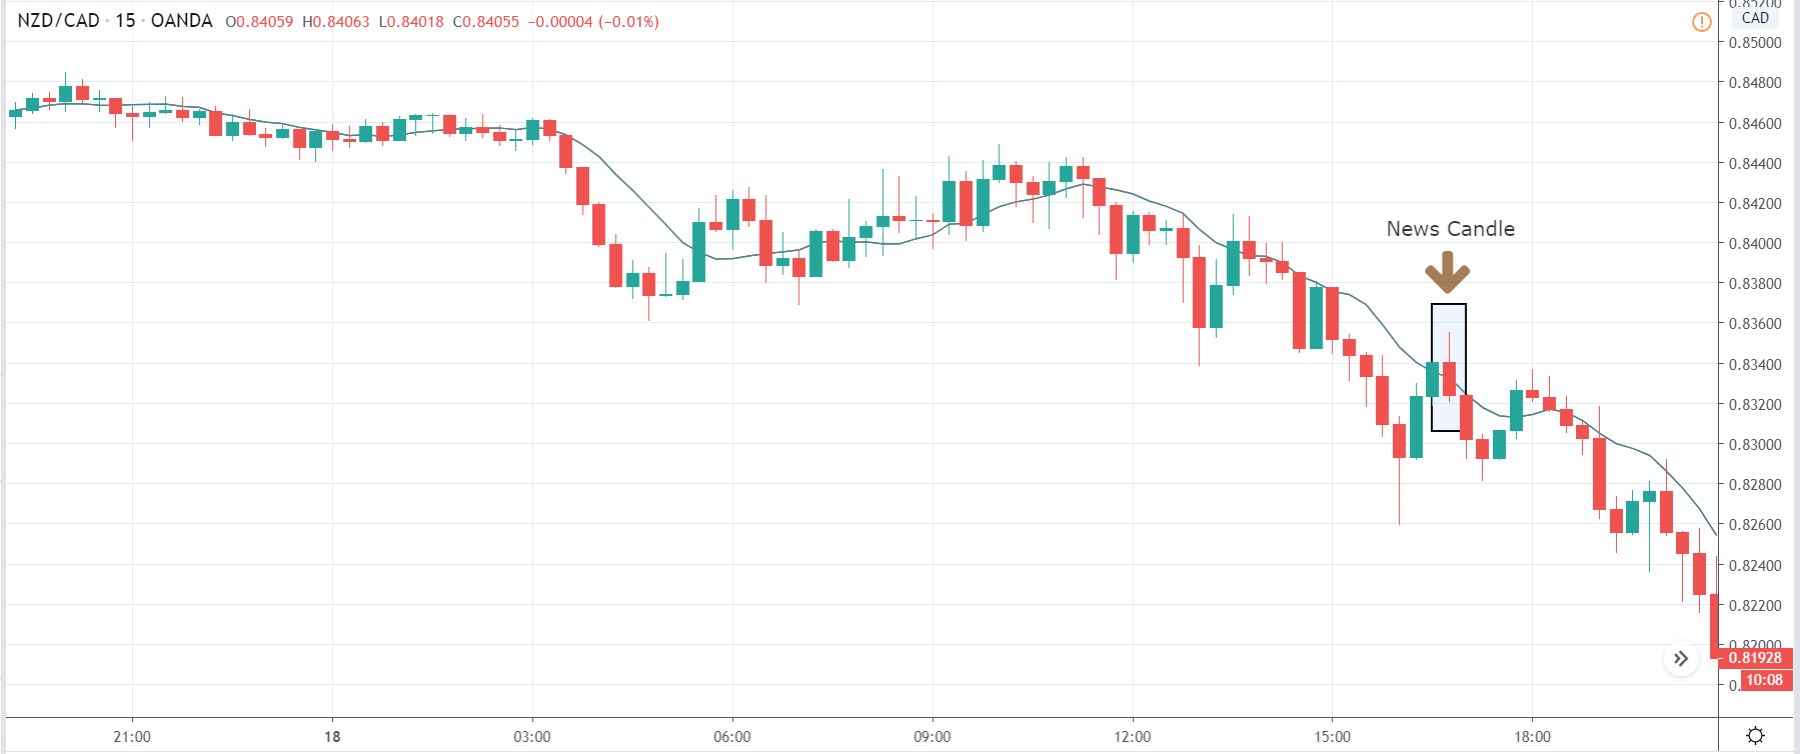
NZD/USD: Before the GDP Deflator Data Release on July 30, 
2020, Just Before 8.30 AM ET

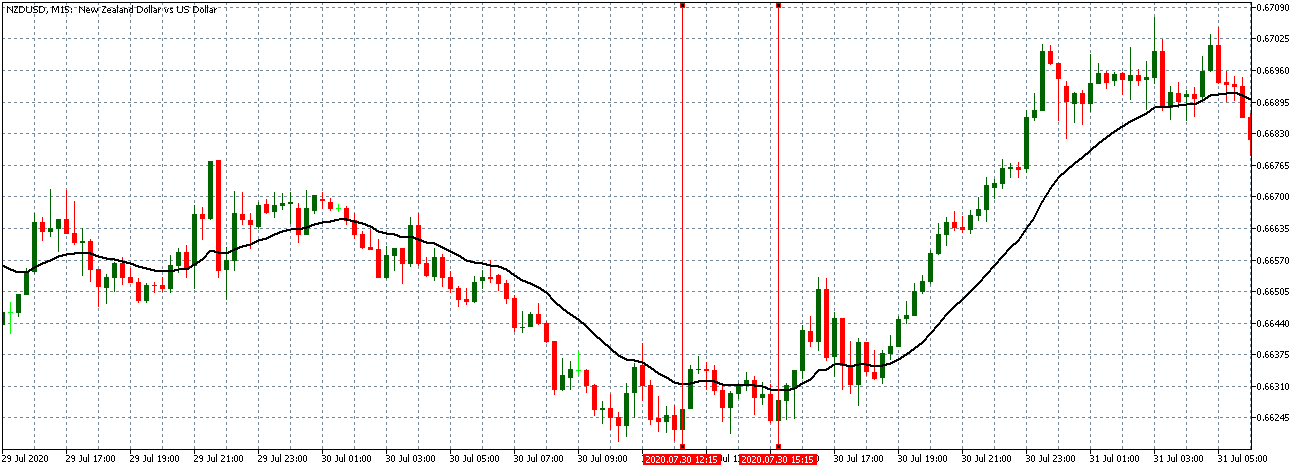
NZD/USD: After the GDP Deflator Data Release on July 30, 
2020, at 8.30 AM ET

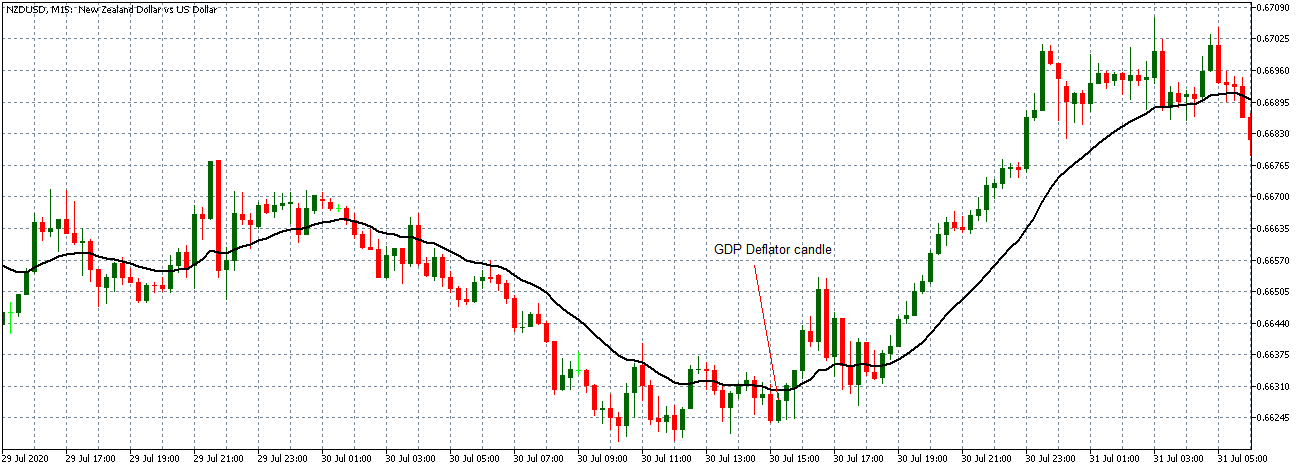
The NZD/USD pair was trading in a similar neutral pattern as the EUR/USD pair before the data release. Similar to the EUR/USD and the GBP/USD pairs, the NZD/USD pair formed a 15-minute bullish candle after the data release. Subsequently, the pair adopted an uptrend with the 20-period Moving Average steadily rising.

Bottom Line

As observed in this analysis, the GDP deflator has a strong impact on the price action, enough to alter the prevailing market trend upon its release. Forex traders should avoid having any significant open positions before the GDP deflator data release to avoid being caught on the wrong side of the news release.

Categories
Forex Fundamental Analysis

What Is GDP Annual Growth Rate & What Impact It Has On The Forex Price Charts?

Introduction

Apart from inflation, gross domestic product growth is one of the most closely monitored macroeconomic statistics. This interest in the GDP growth rate is because GDP is one of the leading indicators of economic health in any country. Therefore, apart from understanding how the GDP growth rate impacts a nation’s economy, forex traders must comprehend how it affects the exchange rate.

Understanding the GDP Annual Growth Rate

GDP: A country’s gross domestic product is the monetary measure of the entirety of goods and services that have been produced within an economy over a specific period. The formula for calculating the GDP for a country is summing up the households’ consumption expenditure, expenditure by the national government, spending by businesses, and the net value of exports. The fact that the GDP covers the entire expenditure within an economy makes it a robust leading indicator of economic health.

GDP Growth Rate: The measure of how the various components in an economy are changing over a given period is the GDP growth rate. The GDP growth rate shows how much a country’s economy has expanded or shrunk relative to the previous period. Thus, the GDP growth rate is the primary measure of how well or poorly an economy is performing.

GDP Annual Growth Rate: The GDP growth rate is calculated every quarter. However, the annual growth rate measures the change in the real GDP between a given quarter and a similar quarter in the previous calendar year. While the QoQ GDP growth rate gives a more recent picture of how the economy is fairing, the annual growth rate is necessary to indicate the longer-term trajectory of the economy.

How the GDP Annual Growth Rate is Measured

It is worth noting that the GDP annual growth rate is calculated using the “real” GDP, meaning that the GDP has been adjusted for inflation. This adjustment is made to ensure the effects of inflation do not result in a false sense of economic progression. There are two ways of determining the GDP annual growth rate.

The first one is by annualising the QoQ GDP growth rate. Annualising means converting the short term QoQ GDP growth rate into an annual rate.

Annualised GDP growth rate  = (1 + QoQ GDP)4 – 1

The second method for calculating the annual GDP growth rate is by comparing the rate of change from a given quarter with that of the same quarter in the previous year.

YoY GDP growth = (Current quarter GDP/ Similar Quarter's GDP – previous year) – 1

How the GDP Annual Growth Rate can be used for analysis

Economists track the GDP growth rate not just because it shows the current state of the economy but because it the primary objective of fiscal and monetary policy formulation. The annual GDP growth rate shows a long-term trajectory of the economy. It provides an effective measure to compare the sizes of economies of different countries.

Governments and central banks formulate their policies around the GDP growth numbers. When the YoY GDP is falling, expansionary monetary and fiscal policies that will be implemented. A falling GDP is an indicator that the economy is heading to higher levels of unemployment; reduced wages; and a general reduction in aggregate demand and supply. Therefore, to avoid recession, expansionary policies like a reduction in interest rates are introduced. These measures are reducing the cost of borrowing, which in turn leads to increased expenditure by households, businesses, and the government.

Conversely, a rapidly increasing growth rate of the annual GDP signifies that the economy is performing well. This economic prosperity translates to a higher rate of employment, higher wages; increased levels of investment and re-investments; and higher aggregate demand and supply within the economy. However, although an increasing GDP is good, a rapidly increasing annual growth rate could forebode an overheating economy.

An overheating economy is one that is experiencing an unsustainable period of prolonged economic growth. This prolonged growth risks high levels of runaway inflation in the economy due to the continually rising wages. More so, an overheating economy results in inefficient allocation of the factors of production since producers oversupply the economy to take advantage of the higher prices. These inefficiencies are likely to result in a nationwide economic recession.

To prevent the effects of an overheating economy, the government and central banks will implement contractionary monetary and fiscal policies. They include a reduction in government expenditure and increasing the interest rate. These policies will help slow down the rate of inflation and increase the cost of borrowing, effectively reducing the aggregate demand.

Therefore, the YoY GDP growth rate provides an important metric for the relevant authorities to ensure that the economy is progressing at a sustainable pace. Furthermore, it is a way for the governments and central banks to gauge the effectiveness of the policies put in place.

Impact on Currency

Forex traders keenly follow the changes in fundamental economic indicators to establish whether there will be a future hike or cut in the interest rate. A falling annual GDP growth rate is accompanied by expansionary monetary policies such as a reduction of the interest rate. This cut tends to depreciate a country’s currency. Therefore, a falling annual GDP growth rate is negative for the currency.

Conversely, an increasing annual GDP growth rate forestalls an increase in the interest rate to prevent runaway inflation. Therefore, it is expected that a rising annual GDP growth rate leads to the appreciating of the currency.

Sources of the GDP Annual Growth Rate

The statistics on global GDP annual growth rate can be accessed at Trading Economics and The World Bank.

How GDP Annual Growth Rate Data Release Affects The Forex?

This analysis will focus on the annual GDP growth rate in Australia. The most recent data release was on September 2, 2020, at 1.30 AM GMT and can be accessed at Forex Factory here. A more in-depth review of the data release can be accessed from the Australia Bureau of Statistics.

The screengrab below is of the annualised QoQ GDP growth rate from Forex Factory. On the right of the image is a legend that indicates the level of impact it has on the AUD.

As can be seen, both the annualised QoQ GDP growth rate data is expected o result in a high impact on the AUD.

In the 2nd quarter of 2020, the Australian economy contracted by an annualised rate of 7% compared to a 0.3% contraction in the first quarter. This contraction was worse than analysts’ expectation of 6%. This contraction is expected to depreciate the AUD relative to other currencies.

Let’s now analyse the impact made by this release on the Forex price charts of a few selected pairs.

AUD/USD: Before Annualised QoQ GDP Growth Rate Release on 
September 2, 2020, Just Before 1.30 AM GMT

From the above 15-minute chart, the AUD/USD pair was trading in a neutral trend before the data release. This trend is evidenced by candles forming just around an already flat 20-period Moving Average. However, 30 minutes to the news release, the pair adopted a steep downtrend forming two long bearish candles with the 20-period MA falling.

AUD/USD: After the Annualised QoQ GDP Growth Rate Release on 
September 2, 2020, at 1.30 AM GMT

After the data release, extreme volatility is observed. As expected, the pair forming a long 15-minute bearish candle due to the weakening AUD. The 20-period MA continued to fall steeply even though the pair started recovering from the worse than expected data release. Subsequently, the steepness of the 20-period MA subsided.

GBP/AUD: Before Annualised QoQ GDP Growth Rate Release on 
September 2, 2020, Just Before 1.30 AM GMT

The GBP/AUD pair traded in a similar pattern as observed with the AUD/USD pair before the annualised GDP data release.

GBP/AUD: After the Annualised QoQ GDP Growth Rate Release on 
September 2, 2020, at 1.30 AM GMT

As expected, after the news release, the pair formed a long 15-minute bullish candle due to the weakening AUD. As with the AUD/USD pair, the GBP/AUD pair underwent a period of correction with the 20-period MA flattening and the subsequent candles forming lower than the news candle.

EUR/AUD: Before Annualised QoQ GDP Growth Rate Release on 
September 2, 2020, Just Before 1.30 AM GMT

EUR/AUD: After the Annualised QoQ GDP Growth Rate Release on 
September 2, 2020, at 1.30 AM GMT

Like the other pairs, the EUR/AUD pair traded within a neutral trend with a significant shift in the trend immediately before the GDP data release. Like the GBP/AUD pair, the EUR/AUD pair formed a long 15-minute bullish candle after the news release due to the worse than expected data.

Bottom Line

The above analyses have shown that the GDP annual growth has a significant effect on price action. The period of relative market inactivity before the data release indicates that most forex traders avoid opening any new, significant positions until the data is released.

Categories
Forex Fundamental Analysis

What Is ‘GDP from Mining’ and What Should You Know About This Economic Indicator?

Introduction

The tracking of GDP from Mining can give us many economic conclusions. GDP from Mining’s importance comes from the fact that the final output of Mining Production is the primary input for many industries. Therefore, it is the core part of the business activity related to many industries.

Fluctuations in the GDP from Mining data will eventually translate to all the industries that are dependent on Mined resources for their production process. This effect can be many-fold, and hence it is a vital economic indicator for investors, economists, and government authorities.

Mining Production

It refers to the entire process of searching for, extraction, beneficiation (purification), and processing of naturally occurring minerals from the Earth. Minerals that are typically mined can be Coal, metals like Copper, Iron, Zinc, or industrial minerals like limestone, potash, and other crushed rocks.

Coal is considered as one of the primary sources of energy across the world. Metals like Iron, Bauxite, and Copper have a wide range of usage in various industries. Limestone and other rocks are being used in cement industries, which contribute a lot to the construction and related industries.

How can the GDP from Mining numbers be used for analysis?

The developing economies are primarily achieving their growth through exports of essential commodities like Food, Minerals, etc. For example, Australia primarily exports Iron Ore and Coal, due to which the economic growth and currency value are tightly linked to the Mining of these natural resources. When the GDP from Mining starts to recede, currency devaluation and slowing economic growth are inevitable.

Developed economies are more resilient to changes in GDP from Mining, as their growth is tied to multiple sectors and are not heavily dependent on any individual sector. The availability of modern technology and skilled labor contribute to the GDP from Mining figures positively. Mining is a labor-intensive task. Hence, it is obvious that Mining lies at the heart of all industrial activities. A decrease in GDP from Mining can adversely affect all the dependent industries, and correspondingly the effects will pass onto unemployment, layoffs, wages, economic slowdown, etc.

Impact on Currency

The GDP from Mining is a low impact indicator, as the Mining Production reports are published monthly by the Federal Reserve in the United States that are leading indicators. It is a proportional and lagging indicator. Hence, changes in GDP from Mining would have already been priced into the market through monthly Mining Production reports.

Also, GDP from Mining numbers does not give us a complete picture of the economy. However, it can be an important tool for the Central Authorities to keep track of the performance of the Mining Sector and its implications for the economy. As established, the Mining Sector is a significant contributor, due to many industries dependent on its output.

Hence, changes in this sector widely affect the overall economic health, and all the dependent industries therein. In general, Higher GDP from Mining is good for the economy and its currency, and vice-versa.

Sources of GDP from Mining

For the US, the BEA reports are available here – GDP -BEAGDP by Industry – BEA. For the world data below, two are useful references – Mineral Rents  – World % of GDPGDP from Mining – Trading Economics. The monthly Mining Production statistics can be found on the official website of the Federal Reserve for the United States, which can be found here – G7 Industrial Production and Capacity Utilization

GDP from Mining Announcement – Impact due to news release

Mining is an extremely important economic activity in any country. The benefits of Mining have been widely promoted by the industry and institutions such as the World Bank. In several low and middle-income countries rich in non-fuel resources, Mining makes significant contributions to the national economic development as measured by the Mining Contribution Index (MCI-Wr).

The contribution of Mining and Minerals to GDP reached a maximum at the peak of the mining boom in 2011. Now, the figures indicate a decline in the Mining’s contribution but are still considerably higher than before. This is one of the reasons why it not a major determinant of economic growth. Thus, investors do not give importance to the mining data when it comes to investing in an economy.

In today’s lesson, we will try to examine the impact of GDP on various currency pairs and see the volatility change due to the news release. The below snapshot shows the previous, predicted, and actual GDP data of Switzerland released in the month of March. As this is the quarter on quarter GDP data, we can expect moderate to high volatility in the currency during the announcement.

GBP/CHF | Before the announcement

Let’s review the GBP/CHF currency pair to observe the impact of the news release. We see that the market has made a ‘descending triangle‘ candlestick pattern before the news announcement, which essentially is a trend continuation pattern. Depending on the impact of the news release, we will take a suitable position in the currency pair.

GBP/CHF | After the announcement:

After the news announcement, we see a sudden surge in the price indicating bullishness in the currency. The bullish ‘news candle’ suggests a negative reaction to the GDP data as it was on expected lines with no major increase or decrease. The market appears to have broken above the ‘descending triangle’ pattern, which is why we should need to wait for clear signs from the market with respect to the direction it is heading.  

CAD/CHF | Before the announcement

CAD/CHF | After the announcement

The above images represent the CAD/CHF currency pair, where we see that the market seems to be in a downward channel before the news announcement with the price at the bottom of the channel. Since the impact of GDP is high, there is a high chance that the news release could result in a break down if the data comes out to be weak for the economy. Therefore we need to wait for confirmation from the market before we can take a trade.

After the news release, the price moves higher and volatility increases on the upside. Since the GDP data was pretty much equal to the forecasted number, it did not result in bullishness in the currency, and it ultimately weakened the currency for a while. One who takes a ‘buy’ trade should take profits at the top of the channel and not wait for too long. 

AUD/CHF | Before the announcement

AUD/CHF | After the announcement

The above charts belong to the AUD/CHF currency pair, where we see that before the news announcement, the market is moving within a ‘range.’ This means the price is not moving in any single direction, which can make trading a bit challenging in such an environment. The news release can effectively move the market in any direction, which is why we need to wait for the announcement to happen in order to get clarity.

After the news release, the price moves lower, but this gets immediately bought, and the ‘news candle’ closes with a wick on the bottom. We witness buying pressure in the market soon after the news release. we to be cautious before taking a ‘long’ position since the price is at the top of the ‘range.’ All the best!

Categories
Forex Fundamental Analysis

Understanding ‘GDP from Services’ As A Macro Economic Indicator

Introduction

The different proportion of contribution to GDP from the three sectors (primary, secondary, tertiary) can tell us a lot about the economic development stage a country is at the moment. GDP from Services can help us gauge the transition of countries from developing to developed status efficiently. Hence, it is useful for Central Authorities and business people to understand the growth of the Service Sector.

What is GDP from Services? 

Service Sector

It refers to the production of intangible goods, services to be exact, that are not goods. Services are intangible, non-quantifiable, and formless. The result of service may or may not produce a physical good. For example, a construction service would give the client a building, whereas a lawnmowing service would not. It is the largest sector in the global economy and bears high significance in advanced economies.

How can the GDP from Services numbers be used for analysis?

The three different sectors of an economy are associated with different activities. The primary sector is mainly associated with dealing with agriculture, farming. It answers the basic needs. The secondary sector deals with industrialization, where livelihood, employment are answered through the production of goods.

The tertiary sector comes into picture when the basic needs like food, employment, security are taken care of. The tertiary sector consists mainly of services. Countries that have Service Sector as their main contributor to GDP are generally considered the more advanced economies. Indeed, the underdeveloped nations will primarily struggle for food and water, where Agriculture would be the primary need to feed the population.

The industrialization growth will be associated with low-cost wage labors working in factories for mass production to compete in the global market. Whereas, the service sector will be associated with high-cost services generally to provide “good-to-have” commodities.

For example, a vegetable is cheaper than an industrial product. Likewise, an industry product would be cheaper than a service sector like antivirus software. The cost of a 1kg of potato is about 2.50 US dollars, whereas 1kg of potato chips from a company like lays would cost 10 US dollars, whereas a Netflix subscription (service) would cost around 10-15 dollars a month.

It is a general trend where a software employee (service sector) gets paid more than a factory worker (industrial sector). A factory worker generally gets paid more than a farmer (agricultural sector). It is easily observed the wealth generated from the Service Sector far outpaces that of the Industrial Sector and essentially the Agricultural Sector.

In general, countries start to grow from underdeveloped to developing nations through industrialization. China and Japan would be good examples of industrialization-led growth. Once a country has firmly established its primary and secondary sectors, it can reach the status of a developed economy through the service sector only. India and China would be good examples of developing economies, increasing their service sector to generate higher wealth.

Hence, GDP from Service is essential to assess the status of a country transitioning from an emerging or developing economy status to a developed economy. As the contribution of Service Sector to GDP increases, it implies that more percentage of people are engaged in higher revenue-generating activities, and have crossed the stages of addressing basic survival needs.

It is also essential to understand that GDP from Service can increase only when the country is firmly established and stable in the primary and secondary sectors. Because when primary and secondary needs are not answered, people will first engage in meeting primary needs and not providing services.

The developed economies have substantial contributions to GDP from Service Sector. For example, the United States and the United Kingdom, have about 80% of their GDP contributed from the Service Sector. Developing economies like India and China have over 50% of their GDP from Service Sector. Underdeveloped nations like Uganda have only 24% of the Service Sector.

Impact on Currency

Leading indicators like Services PMI or NMI already forecast the GDP from Service, which would mean the increases from GDP from Services is already priced into the market. It is a proportional and lagging indicator.

Also, GDP from Services does not paint the full picture of the economy. Still, it can be an essential tool for the Central Authorities to keep track of Service Sector performance and its relative implications to the economy. As established, the Service Sector is a significant contributor to the GDP in developing and developed economies.

Hence, Service Sector GDP improvements bring more prosperity to a nation than an equivalent improvement in Agriculture or Industrial GDP. Service Sector GDP increase brings wealth to a nation and improves the standard of living of its people better than any other sector. A country can become a developed nation only when its Service Sector GDP increases to 70-80% of its GDP.

In general, Higher GDP from Services is good for the economy and its currency, and vice-versa.

Sources of GDP from Services

For the United States, the BEA reports are available here – GDP -BEAGDP by Industry – BEA. World Bank also maintains the Service Sector’s contribution as a percentage of GDP on its official website – Service Sector – World % of GDPGDP from Services – Trading Economics.

GDP from Services Announcement – Impact due to the news release

In the previous section of the article, we saw the contribution made by the service sector to the GDP, and it’s importance in the growth of the economy. But when it comes to fundamental analysis of a currency, the service sector’s contribution alone is not of great importance to investors as it represents only a small portion of the whole GDP.

Therefore, traders and investors look at a broader figure, which is essentially the GDP itself, and take a currency position based on the GDP of a country. So an increase or decrease in the contribution of ‘Services’ to GDP does not have any impact on the currency.

Now, let’s analyze the impact of GDP on different currency pairs and observe the change in volatility due to the news release. The below image shows the latest quarter on quarter GDP data of New Zealand released in March.

NZD/JPY - Before the announcement

We will start with the NZD/JPY currency pair to examine the impact of GDP on the New Zealand dollar. The above chart shows the state of the market before the news announcement, where we see that the price was in a downtrend with the least number of retracements. Depending on the impact of the news release, we will position ourselves accordingly in the market. However, we should be looking to take a ‘short’ trade since the major trend of the market is down.

NZD/JPY - After the announcement

After the news announcement, the market moves lower by a little where the price closes, forming a bearish ‘news candle.’ The GDP data in the fourth quarter was lower than last time, which drove the price below the moving average. However, it did not cause a major crash in the market where the volatility slightly increased to the downside soon after the news release. One should wait for a price retracement before a ‘short’ trade.

NZD/CAD - Before the announcement

NZD/CAD - After the announcement:

The above images represent the NZD/CAD currency pair where we see in the first image the price violently moved lower, and few minutes before the news release, it has reversed from the ‘lows.’ Until the reversal is confirmed, we should be looking to sell the currency pair since the down move is very strong. Since a major news event is due, one should wait for its release and take a position based on the change in volatility.

After the news announcement, volatility expands on the downside, and the ‘news candle’ closes, forming a trend continuation pattern. The market reacted negatively to the GDP data since there was a decrease in the GDP by 0.3% in the fourth quarter. This can be taken as an opportunity for joining the downtrend where one can take a ‘short’ position with a stop loss above the ‘news candle.’

EUR/NZD - Before the announcement

EUR/NZD - After the announcement

The above images are that of the EUR/NZD currency pair, where the market is in an uptrend, and the price is currently at its highest point. The chart signifies weakness in the New Zealand dollar before the news announcement with no signs of strength. Technically, we will be looking to buy the currency pair after a pullback to a key technical level.

After the news announcement, the price moves higher and volatility expands on the upside, thereby further weakening the New Zealand dollar since it is on the right-hand side of the pair. At this point, one should be cautious by not taking a ‘long’ position as it would imply chasing the market. Cheers!

Categories
Forex Fundamental Analysis

Everything About GDP From Transport & Its Impact On The Forex Price Charts

Introduction

The Transportation Industry’s contribution to GDP is both direct and indirect. The real contribution of Transportation to overall economic growth goes beyond what the GDP can measure. Hence, Understanding the Role of Transportation in economic activity and its underlying importance that is both visible and subtle is essential for our overall fundamental analysis.

What is GDP from Transport?

Transportation

Transportation includes the types of services that are provided through operating vehicles, moving goods, or people over public transport systems like roads, railways, waterways, airways, etc.

The supply side of the Transportation system is called the Transportation Industry. It is also essential to note that the Standard Industrial Classification (SIC) and North American Industrial Classification System (NAIC) both consider Transportation as a separate industry. They do so through a standard set of definitions and criteria. Hence, not all Transportation services come under the Transportation Industry.

The Transportation services’ contribution to GDP can be measured in the following ways:

Final Demand: It is calculated by adding all the expenditures by households, private firms, and the government on Transportation related goods and services.

Value Added: It is calculated as the GDP contribution by the Transportation services overall. Transportation Value Added is a gauge of the transportation sector’s contribution to GDP. It is based on the difference between transportation services sold value and the goods and services used to produce Transportation.

The Bureau of Economic Analysis (BEA) takes industry value added to be a measure of an industry’s contribution to GDP.

From measurement viewpoint, three types of transportation operations can be distinguished:

  • For-hire operations: It includes those services conducted by transportation industries on a fee basis. A trucking company’s trucking operations is an instance of for-hire operations. 
  • In-house operations: also called, own-account operations, is conducted by non-transportation industries for their use. For instance, the Coca-cola company may transport its beverages to its local warehouse for storage through its trucks. 
  • Final user operations: Final users include the general population (end consumers) and the government who purchase transportation services like cars, trucks for their use.

Transportation Satellite Accounts: The Satellite industry segregates data by focusing on types of economic activity. Hence, the TSAs depict the contribution of for-hire, in-house, and household transportation services as they all form part of the Transportation Industry.

How can the GDP from Transport numbers be used for analysis?

The Transportation-related Final Demand metric is useful to compare the expenditures incurred on other industries like healthcare or housing. For sector-wise, growth analysis, investors can use this to gauge, which industries are experiencing increasing demand that can help them to invest accordingly.

On the other hand, it is not an accurate metric to measure the Transportation needed to support and sustain economic activity. For instance, if the investment into Transportation infrastructure is underfunded, then correspondingly, it will underestimate the final demand due to low economic output. The Transportation industry’s contribution in the year 2019 and 2018 has stayed around 3.2% of GDP as per BEA.

The value-added contribution of Transportation Industry to GDP is, however, understated for the following two reasons:

  • It only includes the contribution of for-hire transportation services. Many industries use transportation services for their use. In-house services do not contribute to GDP.
  • The extent to which industries depend on Transportation is not depicted in these figures. Mobility and interconnectivity between industries, states, and countries are critical factors in business growth in today’s interconnected international markets.

Accessibility to resources, end consumers are all enabled through Transportation and are heavily impacted with poor transportation infrastructure. The US Department of Transportation – Bureau of Transportation Statistics accounts for the TSA reports, and they, by far, depict the contribution of the Transportation industry better than other measures published.

Impact on Currency

GDP from transport does not paint the full picture of the economy but tells us the direct contribution of the Transport industry to the overall GDP. Still, for the International Markets, it does not serve as a useful indicator. It is a proportional and lagging indicator. Higher GDP from Transport is good for the economy and its corresponding currency, and vice-versa.

Sources of GDP from Transport

For the United States, the BEA reports are available here – GDP -BEA

We can use the GDP by Industry to get the transport’s contribution to GDP here –

GDP by Industry – BEATransportation Statistics –Annual Report – BTS

Transportation’s contribution to GDP for the world can be found here –

GDP from Transportation – Trading Economics

GDP from Transport Announcement – Impact due to news release

The main role of transport is to provide access to different locations to individuals and businesses. Transport facilitates a wider range of social and economic transactions than would otherwise be possible. Transport is an important sector in its own weight. Transport infrastructure and transport operations together account for more than 5% of the country’s GDP. In developed countries, further investment in that infrastructure will not only result in economic growth but also improve the quality of life, lower costs to access resources and markets, and improve safety.

Therefore, the transport sector is an important sector of the economy that many long-term benefits associated with it. Fundamentally speaking, investors would not invest based on a currency based on the contribution made by the transport sector alone, as its direct influence on the GDP is less. The transport industry indirectly helps in boosting the GDP by assisting in all business activities.

In today’s article, we will observe the impact of GDP on various currency pairs and observe the change in volatility because of its news announcement. For illustration, we have collected the latest GDP data of Switzerland, which was released in March. The below image shows that the GDP in the fourth quarter was slightly better than expectations and higher than the previous quarter.

USD/CHF | Before the announcement

Let us start with the USD/JPY currency pair in order to analyze the impact of GDP on the Swiss Franc. In the above Forex price chart, we see that the overall trend of the market is down where recently the price is moving in a ‘range.’ After the occurrence of a trend continuation pattern, a ‘sell’ trade can be taken with less risk. Conservative traders should wait for news releases and trade after the volatility settles down.

USD/CHF | After the announcement

After the news announcement, the price marginally increases that takes the market higher by just a few pips. We can argue that the GDP data had the least impact on the currency pair and did not induce any volatility in the market. As the data was as expected, it did not turn the market downside, and it moves as usual.

EUR/CHF | Before the announcement

EUR/CHF | After the announcement

The above images represent the EUR/CHF currency pair, it is clear that before the news release, the market is in an uptrend, and few minutes before the release, the price has been moving within a ‘range.’ This means the news event could either result in a continuation of the trend or a reversal of the trend.

Hence it is recommended to wait for the news announcement to watch the impact it makes on the price chart. After the news announcement, there is a slight increase in volatility to the downside after the close of news candle resulting in strengthening of the Swiss Franc. However, the ‘news candle’ itself appears to be impact-less, where there is hardly any change in price during the announcement.

NZD/CHF | Before the announcement

NZD/CHF | After the announcement

The above images are related to the NZD/CHF currency pair, where we see that the market is moving sideways before the news announcement. Just before the release, the price is close to the bottom of the ‘range.’ As the impact of these numbers is less, aggressive traders can take ‘long’ positions when technically the location is supporting for a ‘buy.’

After the news announcement, the market moves higher, and there is an increase in volatility to the upside. Since the GDP was not extremely bullish or bearish, the market did not react violently to the news release. Therefore, in such times we need to look at the charts from a technical angle. All the best!

Categories
Forex Fundamental Analysis

How The ‘Terrorism Index’ News Release Impacts The Forex Market?

Introduction

Terrorism Index is a macroeconomic indicator that can influence long term investing and foreign investments flowing into an economy. The smoothness in business activities and productivity of the economy is influenced by acts of Terrorism, thereby affecting the overall Gross Domestic Product (GDP). Hence, understanding the changes in Terrorism Index and its impact can help economists and policymakers make critical decisions towards the country’s growth.

What is Terrorism Index?

Terrorism Index, also known as the Global Terrorism Index (GTI), is a report that gives us a comprehensive summary of the key global trends and patterns in the acts of Terrorism. It is one of the measures of Terrorist Activity in different economic regions.

Terrorism: According to GTI, Terrorism is defined as the threatened or actual use of illegal force & violence by a non-state actor to achieve an economic, political, religious, or social goal through fear, coercion, or intimidation.

It also details incidents of Terrorism throughout the globe for the past 50 years, covering the period of the beginning of 1970 and the change in recent periods. It also identifies and categorizes terrorists into designated groups. GTI also ranks the countries that it covers as per the degree of Terrorist Activity being experienced by those economies. It covers 163 countries that attribute to about 99.7 percent of the world population.

Below is the top ten countries list losing their GDP due to acts of Terrorism.

How can the Terrorism Index numbers be used for analysis?

Acts of Terrorism harm the economy. The impact of Terrorism is calculated through IEP’s cost of violence methodology. The methodology includes direct costs like loss of lifetime earnings, medical bills for treatment, and property loss from terrorism incidents. It also accounts for indirect effects like a loss in productivity, job or earning losses, psychological traumas that impact the victims and their associated family and friends.

Prolonged periods of terrorist activities can result in an unstable economy, where people may panic and fear for their life that impacts social order, political tensions, security threats, and leads to economic contractions. The more the terrorist activities, the lesser the chance for governing bodies to spend on public and growth, and the overall majority of revenue goes into combating Terrorism and bringing back the economy to its normal state.

Overall the economic impact is divided into four categories: deaths, injuries or fatalities, destruction of property, and GDP losses from Terrorism. Terrorism has many implications for the larger economies. It depends on the duration, level, and severity of the terrorist activities. Typically, when countries suffer more than 1000 deaths from Terrorism, IEP’s model includes national output losses that are equivalent to two percent of the total GDP.

The deaths from Terrorism has a significant impact overall, followed by GDP losses. The global economic impact of Terrorism was 33 billion U.S. dollars in 2018, 38 percent lower than in 2017. Terrorism also has wide-ranging economic consequences that have the potential to spread quickly through the global economy with significant social ramifications.

The violence caused by Terrorism, and the fear of Terrorism creates critical disruptions in the economy. It changes the economy’s behavioral patterns, like changes in investment and consumption patterns, diverting public and private away from productive and economic activities towards protective measures. Developed economies are able to absorb the economic shocks of Terrorism better than growing economies. Terrorist activities directed towards specific organizations specifically hurt that company’s stocks in the short-term.

Trades become costlier as it has to account for increased security and higher wage premiums for workers working during such uncertain times. Countries whose main revenue streams include tourism take a severe hit as terrorist attacks significantly reduce tourist arrivals and, accordingly, the revenue from it.

Impact on Currency

GTI is an inverse indicator, meaning; low GTI levels are suitable for the economy and the currency. High levels of GTI results in allocating a lot of government resources in combating and containing Terrorism. In extreme cases, the regions experiencing high levels of terrorist activities can enter curfews for weeks or even months on end that is bad for the economy.

High GTI discourages foreign capital flow into the economy as investors are not sure of a smooth growth of business and industries within that economy when frequent disturbances are expected.

Terrorism Index is an annual metric and has a low impact on the volatility of the market as it is a lagging indicator and shows the long term trends and studies of Terrorism. The more direct consequences are obvious through other macroeconomic indicators, but GTI is useful for investors and impacts long term growth plans of the economy. High GTI can also lead to shying away from foreign companies to invest and expand in the country.

A decrease in the percentage of GTI is indicative of recovering economy and hence, can be used as a positive signal for growth overall.

Economic Reports

The Global Terrorism Index (GTI) report is released by the Institute for Economics and Peace (IEP) and was developed by Steve Killelea, the founder of IEP. It obtains its data from mainly from the Global Terrorism Database (GTD) and some other sources.

GTD data is collected at the University of Maryland by the National Consortium for the Study of Terrorism and Responses to Terrorism (START). It is an annual report that is released at the year-end, usually around November and December, on the official website of Vision of Humanity organization.

Sources of Terrorism Index

The GTI and Peace reports are available on the official website of the Institute for Economics and Peace – Institute for Economics and Peace – Reports

We can refer the 2019 GTI report here: GTI – 2019

We can find the GTI for different countries listed out in various categories here.

Impact of the ‘Terrorism Index’ news release on the price charts 

The report of the Global Terrorism Index is gaining a lot of importance today as it measures the amount of loss incurred by a country due to the destruction caused by the terrorism activities. The report consists of patterns and trends of terrorism activities in 163 countries. It also measures the economic impact of Terrorism.

Terrorism, for instance, impaired the GDP growth of 18 Western European countries from 1971 to 2004, where the GDP per capita fell by 0.4 percentage points. A large terrorist attack can affect financial markets negatively in the short-term. However, in the long term, they continue to function efficiently, absorbing the shock. Therefore, more and more countries try to quantify the effects of Terrorism on the granule level so that the currency is not adversely impacted.

In today’s article, we will be analyzing the impact of the Global Terrorism Index news announcement on various currency pairs and interpret the change in the volatility. For illustration, we have considered the Terrorism Index of the U.S., where the below image shows the Rank, Score, and the Change in Rank from the previous year. It represents the year-on-year Terrorism Index Score of the U.S., which was released in November.

EUR/USD | Before The Announcement

The above image is that of the EUR/USD currency pair before the news announcement, where we see that the overall trend is down, and currently, the price has retraced up to a key level of support equals resistance. From the knowledge of technical analysis, this is the perfect trade setup for going ‘short’ in the market, but since there is a news announcement on the next day, it is wise to wait and then trade based on the numbers. However, aggressive traders take a ‘short’ trade with a larger stop loss above the recent ‘high.’

EUR/USD | After The Announcement

After the Global Terrorism Index numbers are announced, the price goes lower, and there is an increase in volatility to the downside. But the candle leaves a wick on the bottom and closes near the opening price. Initially, traders bought U.S. dollars because of the positive economic indicator data where the Terrorism Score was better than last time, and the rank reduced by two positions. Even though it was positive, there were some traders who felt it was that robust, which is why the selling did not sustain. One can still go ‘short’ in the pair but with a shorter ‘take-profit.’

USD/JPY | Before The Announcement


USD/JPY | After The Announcement

The above images represent the ‘daily’ timeframe chart of USD/JPY currency pair, where in the first image, it is clear that the market is moving within a channel, and now it is at the bottom of the channel. Technically, it is the right place for going ‘long’ in the market as one can expect some buying force from here. A ‘buy’ trade is only for the aggressive traders, and others still need to wait for the clarity in news data. But since a news announcement.

After the numbers are published, volatility increases on both sides, and the candle managed to close in green. The market reaction was again neutral in this case as the Terrorism Index data was mildly positive to mixed, which is why the ‘news candle’ forms a ‘Doji’ candlestick pattern. Thus, one can now go ahead and take a ‘long’ position once the price goes the moving average with a ‘take-profit’ near the upper trendline.

NZD/USD | Before The Announcement

NZD/USD | After The Announcement

These are the images of NZD/USD currency pair, and since the U.S. dollar is on the right-hand side of the pair, a down-trending market means that the U.S. dollar is showing strength. Though recently, the price is moving in a range and right before the announcement, it is at the top of the range, also known as ‘resistance.’ Another important point of consideration is that the volatility has increased on the upside, and this could be a sign of reversal. Therefore, ‘short’ trades from here have to be taken with caution.

After the Terrorism Index data is released, we see that the market moves lower and a moderate increase in volatility to the downside. The news outcome did not create the kind of impact that was expected and seen in other pairs. Thus, we need more indication from the market in order to go ‘short’ in the currency pair.

This ends our discussion on the ‘Terrorism Index’ and its relative news release impact on the Forex price charts. If you have any questions, please let us know in the comments below. Good luck!

Categories
Forex Economic Indicators

What Is Gross Domestic Product (GDP) & How Is It Useful For The Forex Traders?

Introduction

Gross Domestic Product, also known as GDP, is one of the main Microeconomic Indicator in Forex. It is the total amount of money spent on final goods and services. GDP is expressed in percentage terms and is calculated across different time periods. The time period is usually from one quarter to another.

It is a standard measure for the value added to the country’s economy through the production of goods and services during a specific time period. GDP is published by the International Monetary Fund (IMF), and information on the same can be found on their official website.

What does GDP measure?

Just as explained in the beginning, GDP measures the health of an economy. If the GDP of a country is high, it means it is receiving capital flows from central banks and institutions, which is a big positive for that country. However, if the GDP numbers are declining quarter on quarter, it means the economic growth of the country is shrinking. When GDP falls, unemployment in the country rises, and output in production drops.

GDP is important because it gives a birds-eye view of how the economy is doing. It is a sign of people getting more jobs, getting better pay, and businesses feeling confident about investing more.

Calculation of GDP

The GDP of a country can be calculated by using the below-mentioned formula

GDP = C + I + G + (X-M)

Where C is the spending made by consumers

I is the investment by businesses

G is the government spending

(X-M) is the net exports

How do Forex traders use GDP?

GDP is an indicator that is used by both technical and fundamental traders. It is one of the most critical drivers of the economy and is closely monitored by all. GDP is important because it can affect how the financial markets can behave, both positively and negatively. Strong GDP growth translates into higher corporate earnings, which directly appreciates the currency value. Conversely, falling GDP means the economy is weakening, which is negative for the currency and, therefore, stock prices. According to economists, a recession is said to occur when there are two consecutive quarters of negative GDP growth.

One should not forget that GDP is a lagging indicator, meaning it shows what the economy did in the past. It does not predict the state of the economy in the near future. Hence, if the GDP data of a country is not good, traders view this as an opportunity to buy the currency and make a profit in the long term.

Summary

Understanding the Gross Domestic Product and its growth rate is essential for investors and traders as it affects the decision-making process of policymakers of the country. When the GDP growth rate is high, the central banks raise interest rates and encourage investment. High-interest rate is said to attract foreign investors and financial institutions. With the improvement in research and quality of data, statisticians and governments are trying to find measures to strengthen GDP and make it a comprehensive indicator of national income.