Categories
Forex Videos

Make Money In Forex With Less Risk Counter Trend Trading!


How to reduce risk while counter trading a trend

Thank you for joining this Forex Academy educational video.

In this session, we will be looking at how to reduce your risk in a counter-trend set up.

Trading against the trend is inherently risky.  However, as your experience grows as a trader, you will likely start seeing opportunities where trends run out of steam and look right for a reversal.  These kinds of trades can often be extremely profitable if the timing is right. 

Of course, trading any financial asset, but specifically foreign exchange, is almost impossible to correctly find entries and exits which are down to the pip perfect, i.e., identifying an entry or exit of a particular move within a single pip.

This is where it is important to adopt a variable approach to leverage.  Quite often, new traders will simply execute the same amount of leverage per trade, no matter what the circumstances.  So any particular trade, they might open with half a standard lot, or even a full lot, no matter whether they are trading after an economic data release, which might be low impact or a high-impact release such as non-farm payrolls, they keep their trade size the same no matter what, and this can be particularly dangerous and it is a poor aspect of money management.  A variable approach is another string to the bow of becoming a more rounded trader.

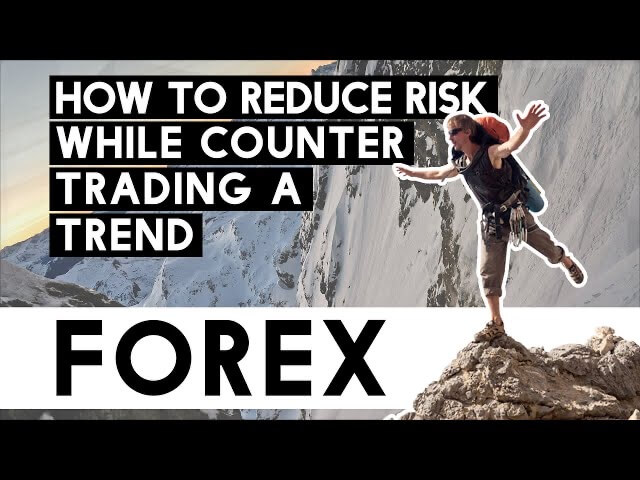
This is a 4-hour chart of GBP USD

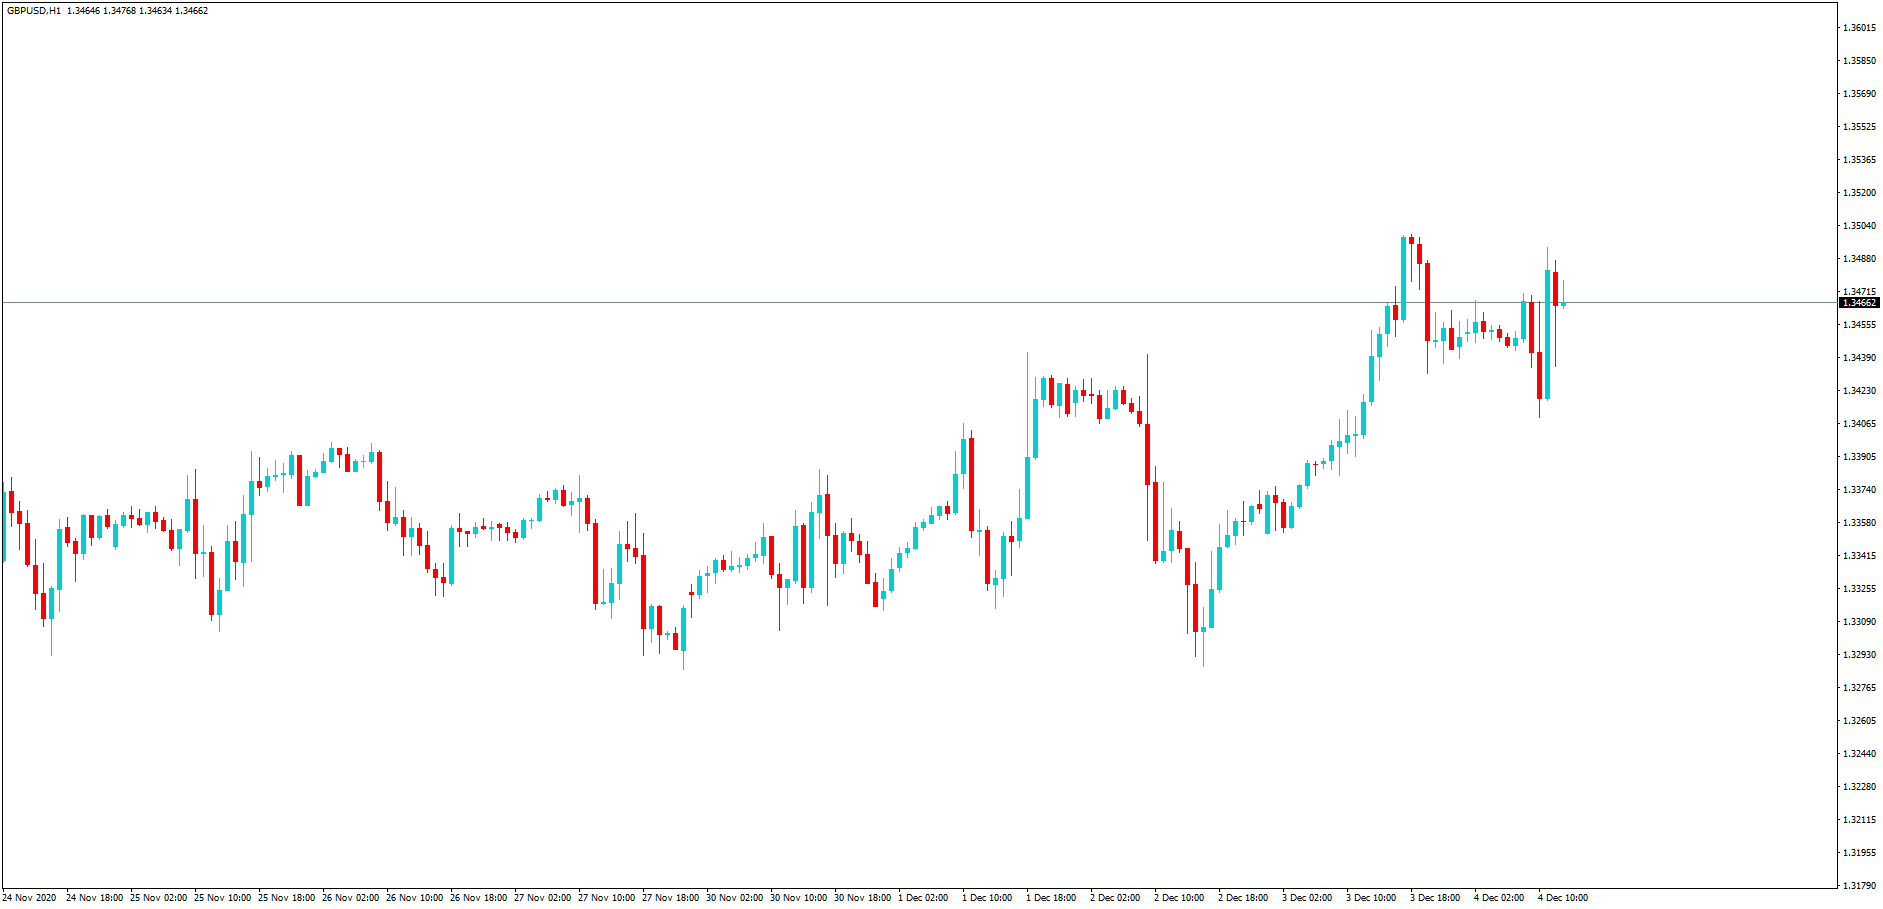
The majority of the price action as shown during position A in this section from the 24th of November to the 3rd of December has largely been a sideways move while traders wait for the outcome of the Brexit future trade negotiations with the EU. 

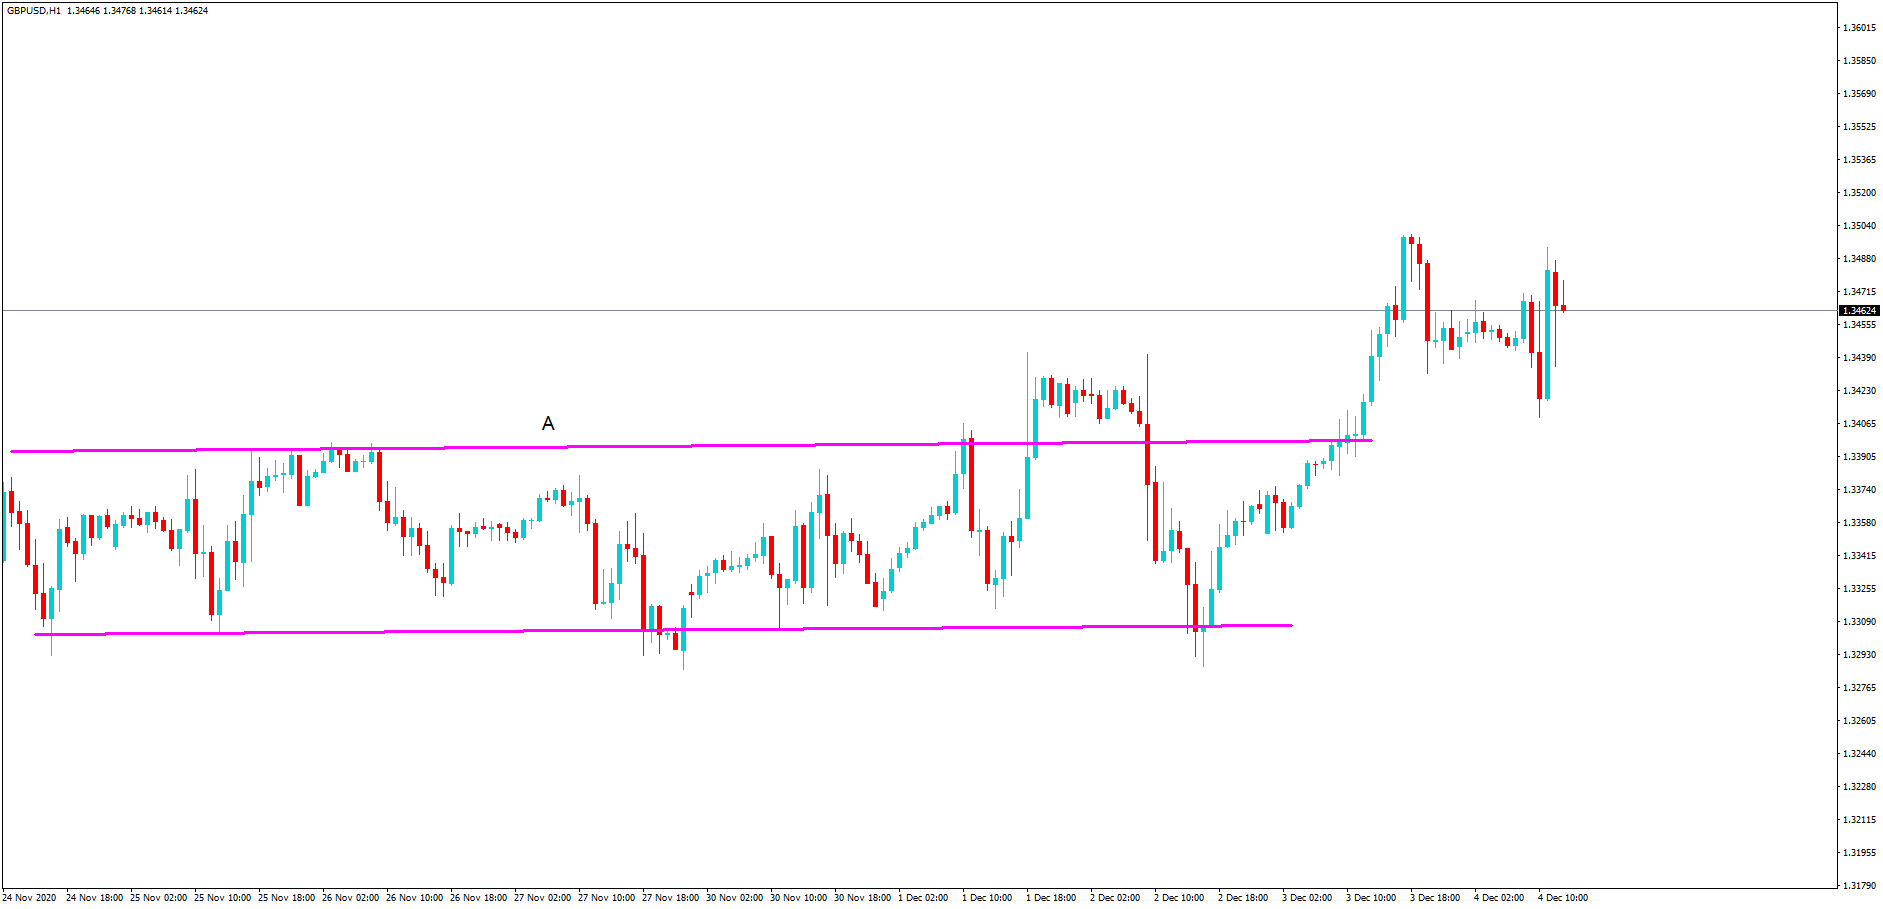
Although there was a spike outside of the range at position B, price action reverted back within the original range on the 2nd of December.

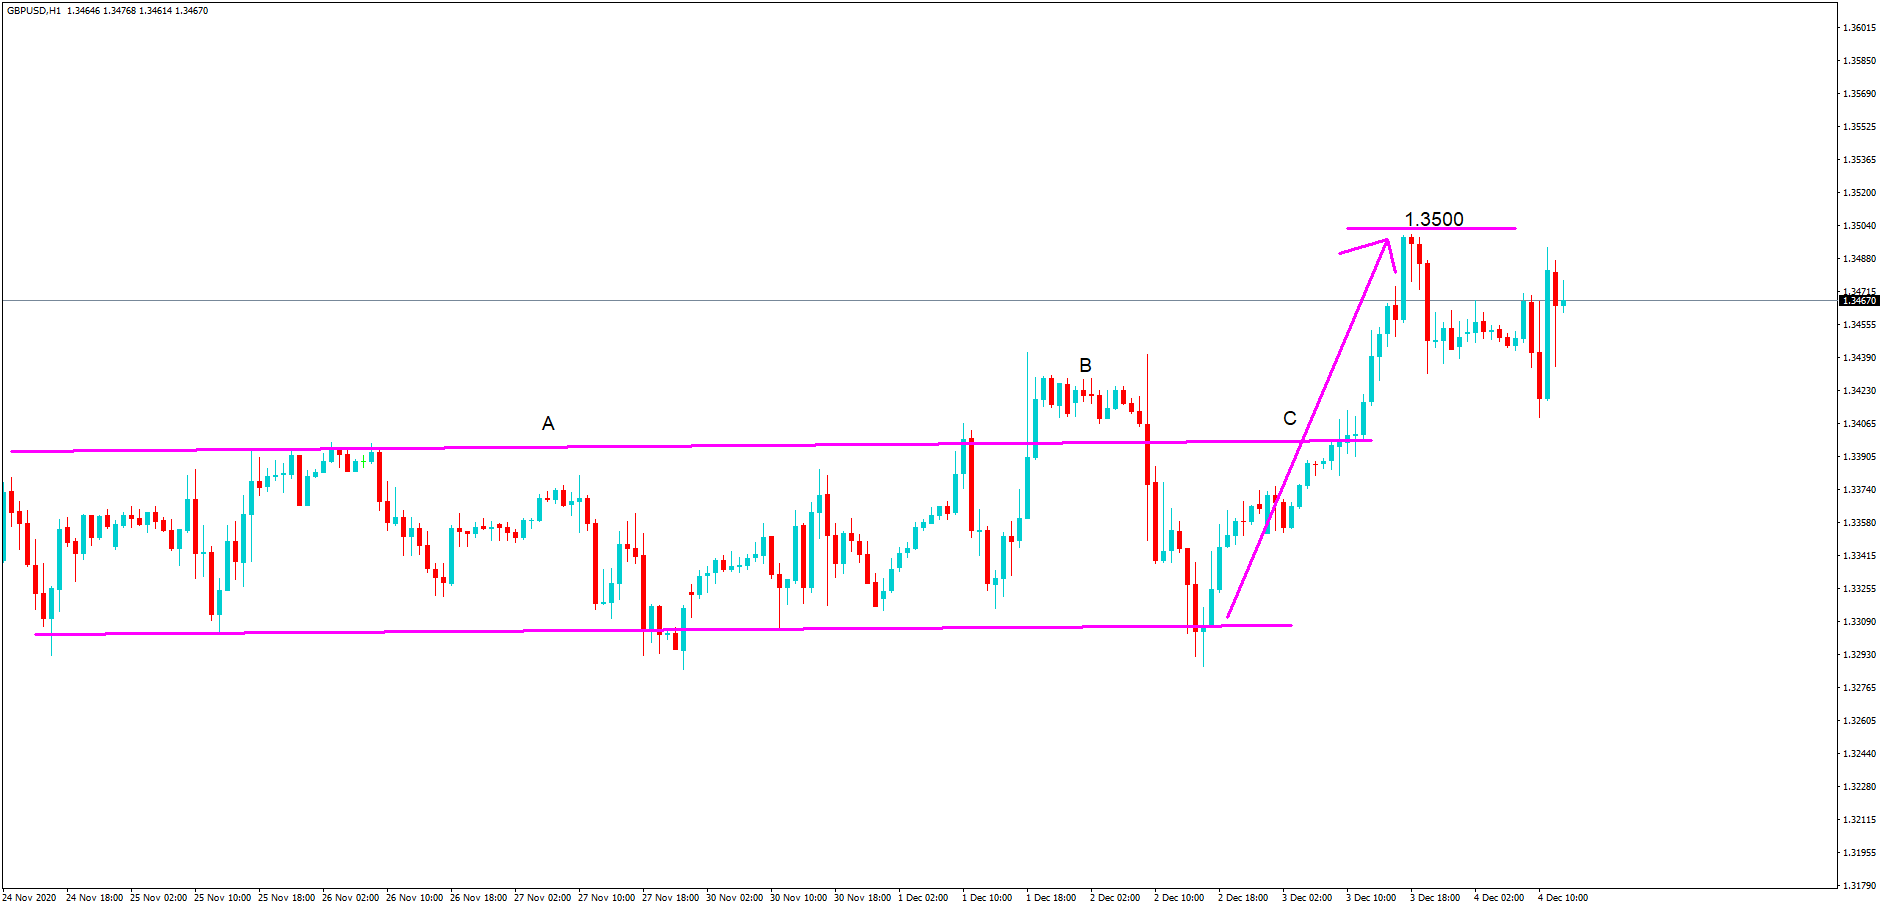
There is then a bounce off of the support line and a 200 pip bull run, which breaches the resistance line, and takes price action all the way up to within a pip of the key 1.3500 level.

This is a good opportunity for profit-taking for many traders and a potential double top reversal …….

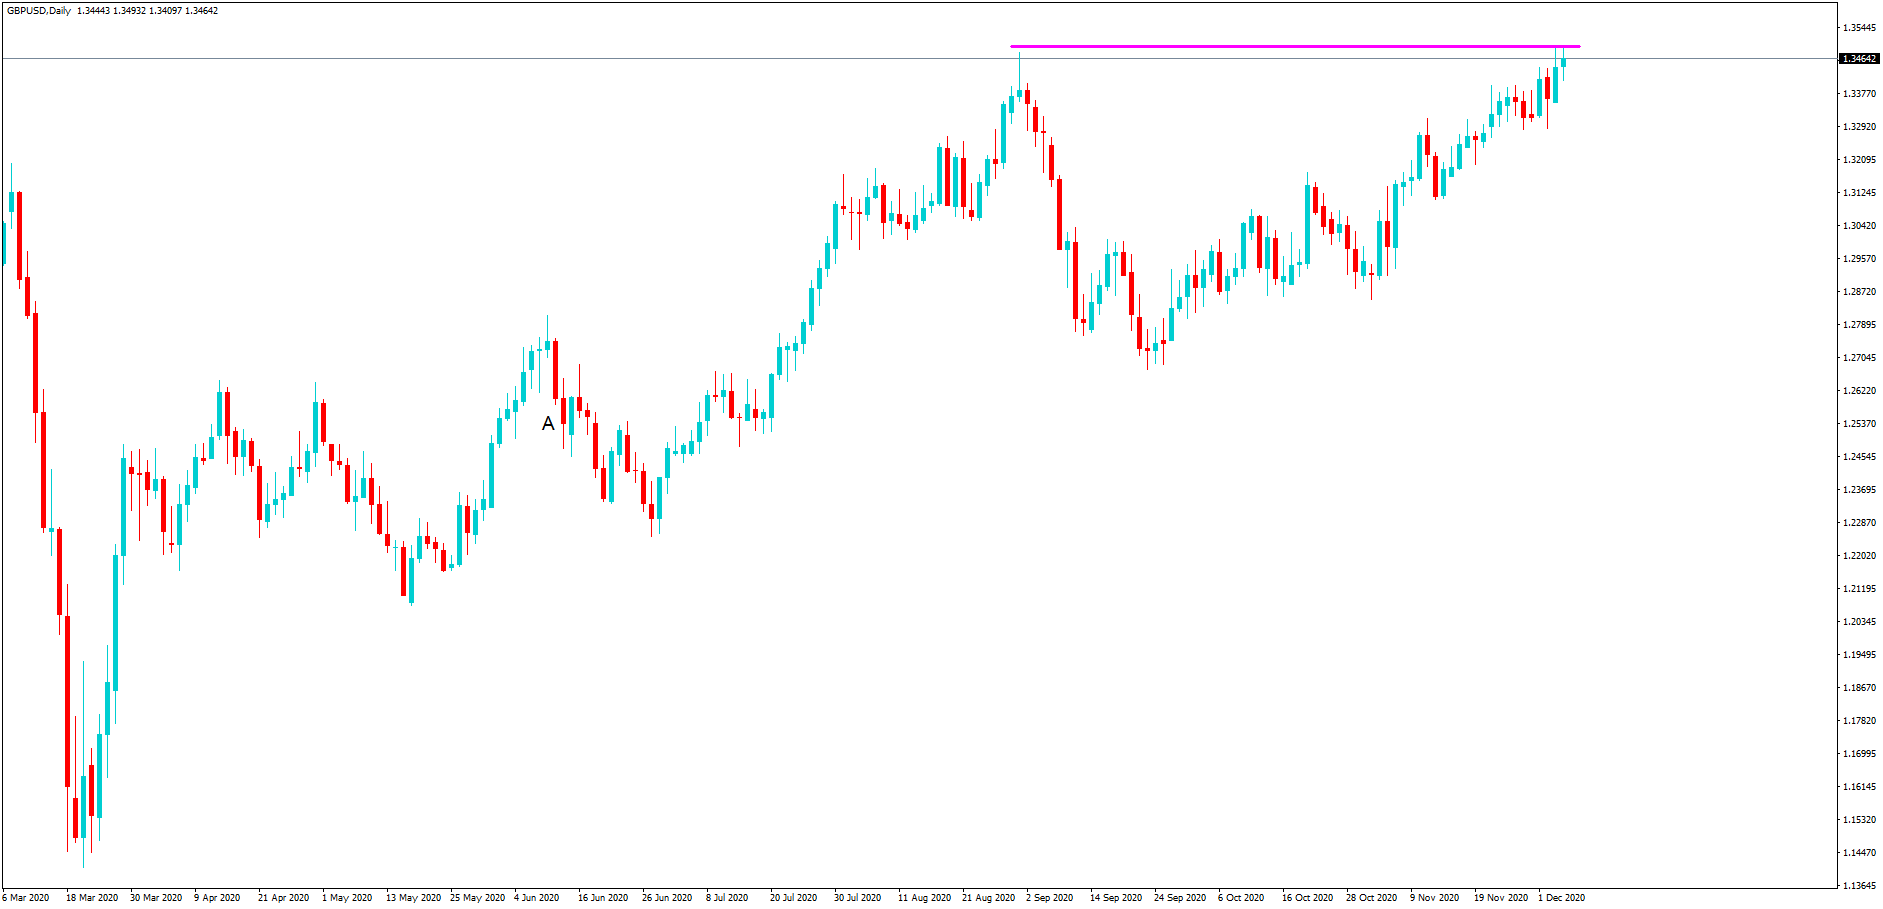
…from this daily chart of the pair with which was a multi-month as shown during August 2020.

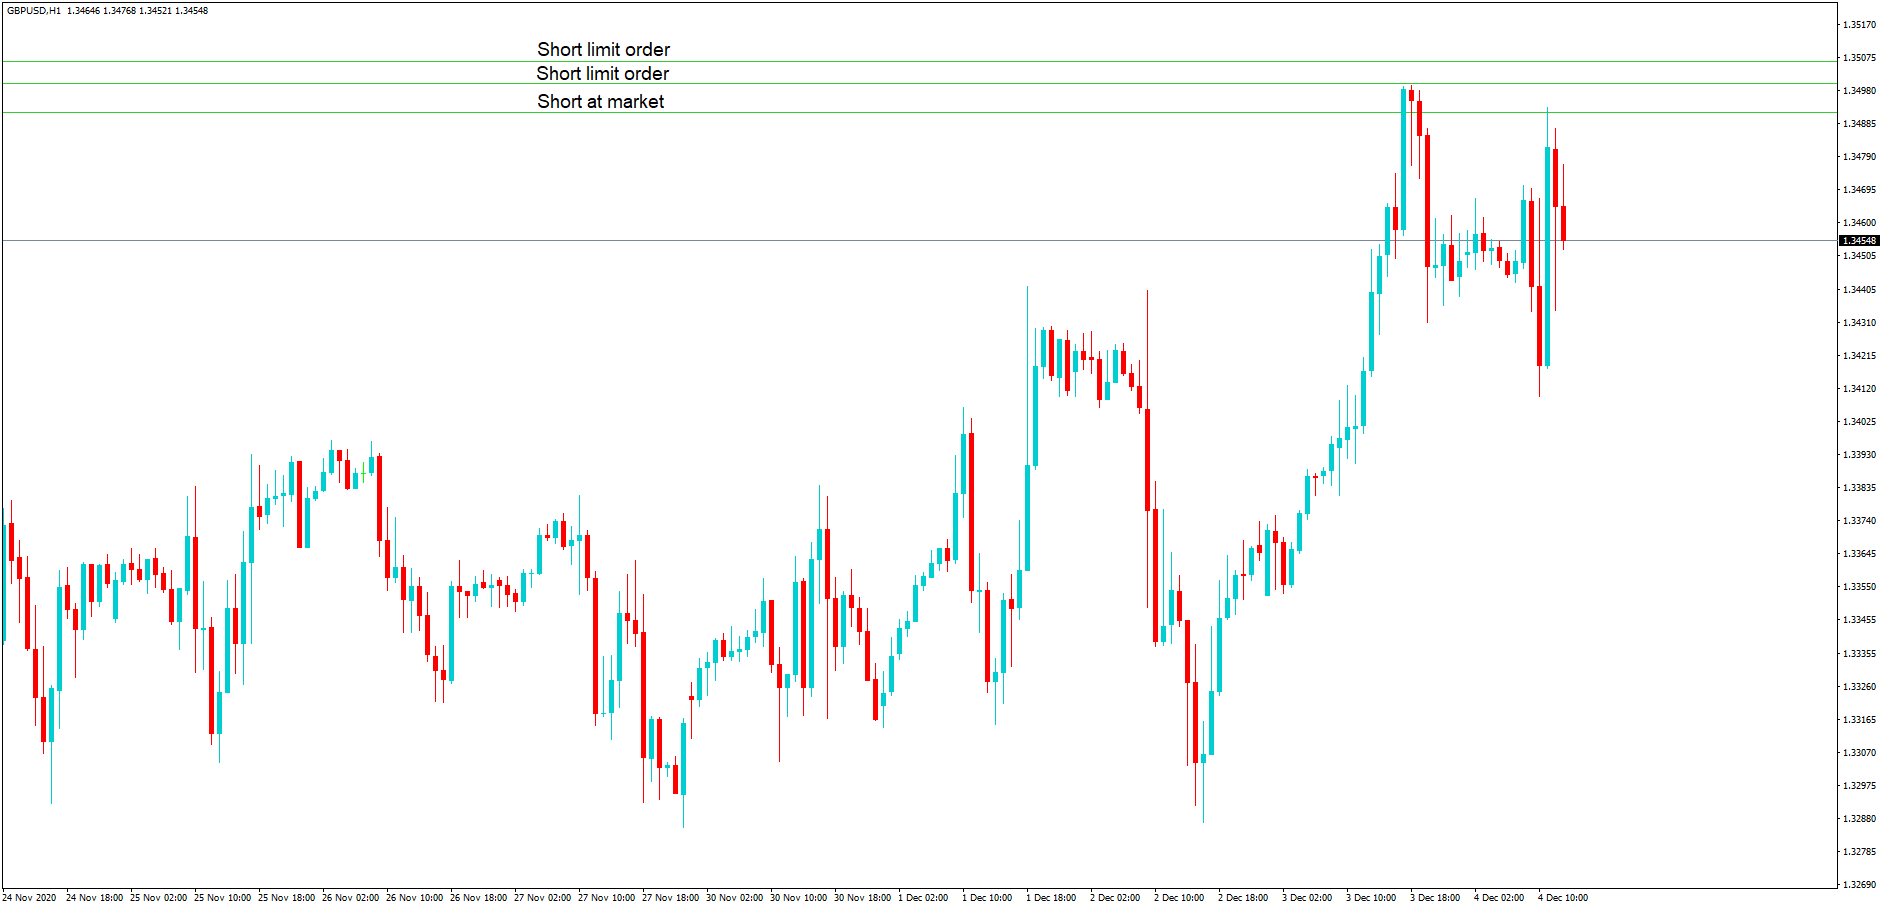
Under these circumstances, we believe there may be a reversal in price action, and we had decided to trade against the trend, believing that it will reverse at this point.  And we initiate a short trade, with reduced leverage than perhaps we might normally use because we are trading against the trend, and then we will layer the trade with market executions or sell limit orders just above our first trade, dependant on risk, and because we cannot predict where the reversal will happen, if at all.

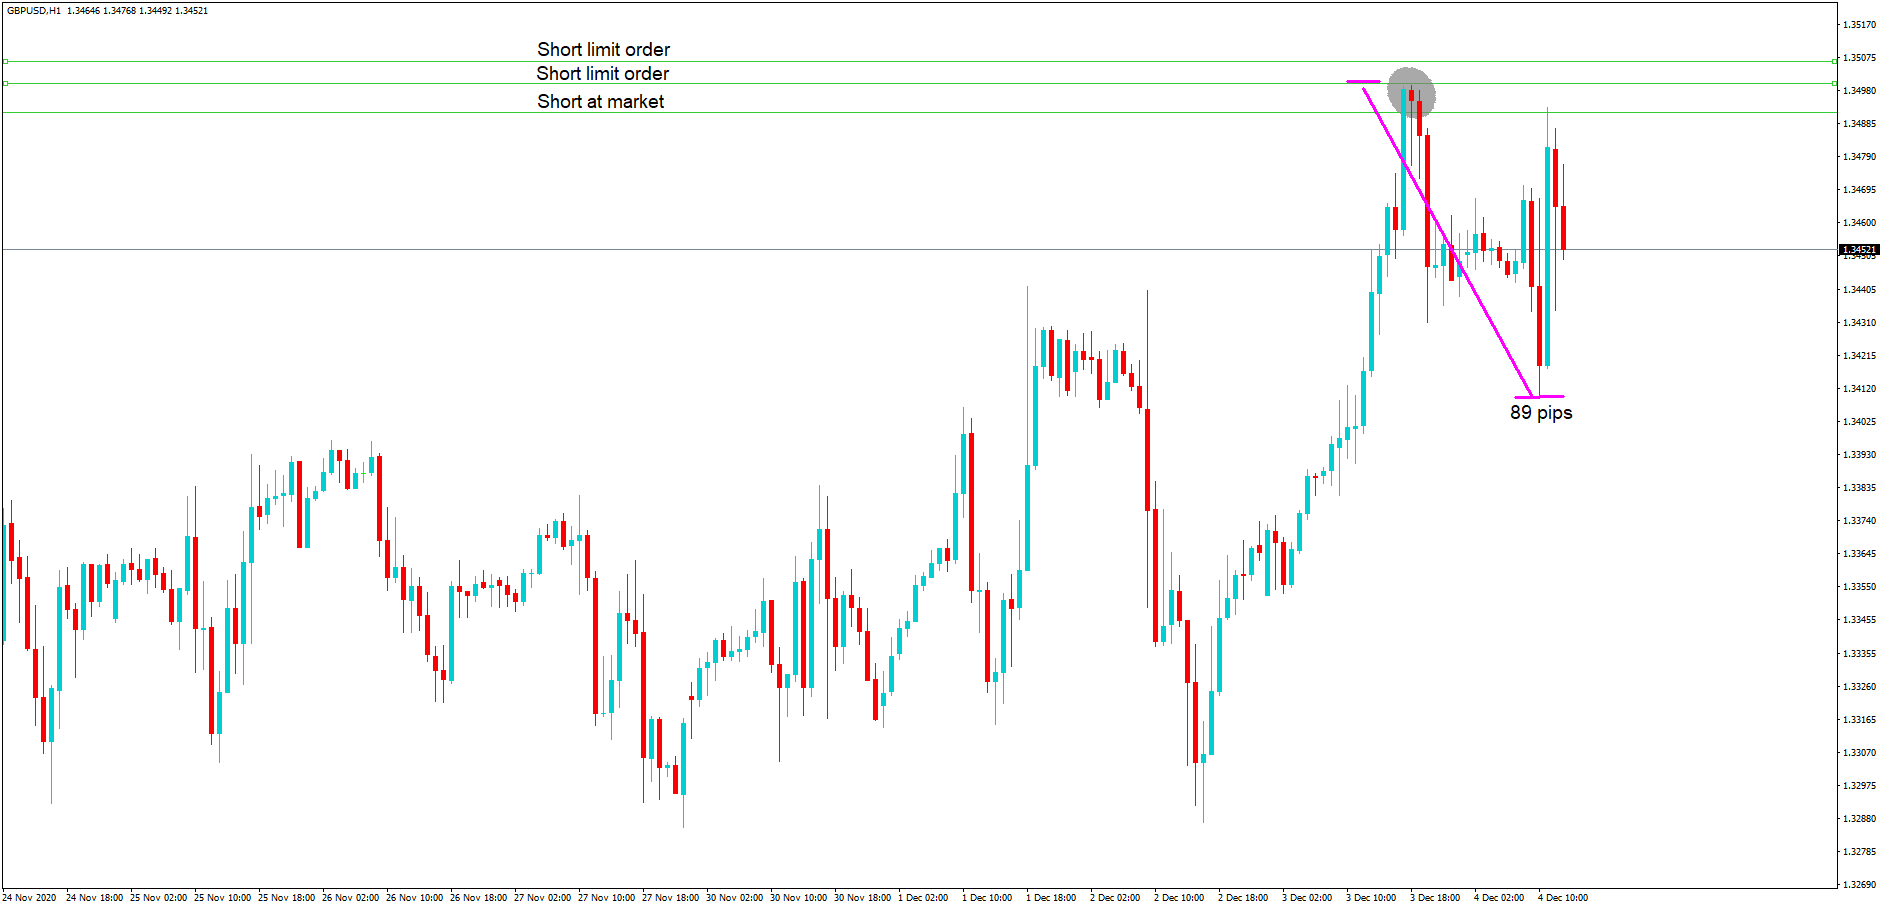
Had this been a real trade, at least two of the orders would have been filled, including the at market order and where there was a reversal of 89 pips, which is a healthy profit.

In this particular instance, we have taken advantage of uncertainty in the market with regard to Brexit, a multi month high, double top scenario, and a key round number 1.3500.  We have reduced our leverage because of uncertainty and the fact that it was a counter-trend reversal trade, which can be inherently risky.  But we have diluted that risk by lowering our leverage and layering the trades over varying exchange rates in close proximity to the key level of 1.3500. Stop losses should be implemented as per your personal risk appetite.    

This style can also be implemented for long trades with similar principles, and the reduced leverage and layering style can be adopted in any trade scenario. 

Categories
Forex Basic Strategies

When Is the Best Time to Use Trend Following Strategies? (The Answer May Shock You)

Trend following strategies are some of the most popular strategies around today, they have grown in popularity due to the increase in social media presence of some of the larger and most successful traders, these traders often use some form of trend following strategy that shows off large profitable trades. Something that a lot of newer traders want to be able to aim for.

There are also a large number of timeframes available to trade ranging from a one minute chart all the way up to a monthly chart where each candlestick is an entire month. So the question that we will be answering is which of these time frames would be best for a trend following strategy in order to try and emulate the trades and results of some of the most successful traders.

In order to answer that question, we first need to understand exactly what we mean by a chart timeframe. To put things simply, when you are looking at a chart, the candlestick chart, for instance, each candlestick will correspond to the timeframe of the chart, so on the one minute chart, a new candlestick will be made each minute on the 5-minute chart a new candlestick will be created every 5 minutes and so on all the way up to the monthly chart where a new candle will be created at the start of each month.

Each of these timeframes offers a lot of advantages and disadvantages depending on the strategy that you are using, and many strategies will require you to use multiple timeframes for the same strategy. The time frames are generally divided up into three different categories, the short-term timeframes which include the lowest timeframes for a minute up to several minutes. The medium-term timeframes work from around 10 minutes up to around an hour, and the long term trading time frames are often seen as an hour up. So let’s get into which ones will be best for a trend following strategy.

When looking at trend traders, a short term timeframe would last up to a week, a medium-term timeframe would last up to a few months and a long term timeframe could last up to a few years. Trend traders are looking for large movements that can last a long time, weeks to months at a time, so generally, they are looking for longer-term trades and long term timeframes.

If you were to try and trade a trend on a  small time frame, let’s take 5 minutes as an example, what information would you actually be able to see? Pretty much nothing that would relate to a trend, you would see the past hours movements which could simply be an up and down cycle, but if you can only see the past hour or so, then it may look like an upwards or downwards movement, but in reality, the markets could even be moving sideways, these lower time frames simply do not give you the scope to see what is actually going on long term in the markets.

Trend trading is one of the longer trading strategies in terms of the amount of time that you hold on to trades for and so one of the strategies where you need the higher timeframe on the charts too. Trading h trend basically means that you are looking for the overall movement of the markets and then try to trade along with the trend, coming out of your trade as the markets decide to reverse. Trend trading takes a lot of technical analysis to do properly, however, there is also an underlying issue of fundamentals to take into account.

Having said that, simply watching just the long term timeframes may not be enough for trend traders to be successful, you need to have a knowledge of all time frames in order to get the most information out of the markets as you can. Seeing a trend on the monthly chart is great, this is giving a good indication of the markets movements, however in order to work out the best point of interest, you may need to take a look at some of the lower time frames in order to work out what is happening on a more micro level. 

You also need to consider your own strategy, what size of trades are you putting on? If you are planning on trading the trend, then generally the trades will be smaller but held for much longer. If you try putting on large trades in order to follow the trend, you will be putting a lot of capital at risk on each trade. Remember, you are looking for huge movements in the markets, not just a little up or down, the larger the trade you put on the more risk you are putting too. So when using the higher time frames, ensure that you are scaling down your trade sizes too in order to ensure that your account will be able to handle holding on to those trades for extended periods of time, potentially weeks to months or even years.

So ultimately there isn’t a single best timeframe for trend trading, you will need to get a good understanding of a number of different timeframes. However, getting to grips with the longer time frames such as weekly and monthly will give you a much better overview of the current trends within the market compared to the smaller faster-paced timeframes. Do not be afraid to use the lower time frames to help with your conformations, just don’t use them as the basis for your entire trade.