Categories
Forex Course

123. Trading The Bullish & Bearish Bat Pattern

Introduction

The BAT is a harmonic pattern that appears in both up and downtrend. This pattern occurs when the trend temporarily reverses its direction and before continuing on its original course. As soon as this pattern ends, the markets resume it’s original direction, giving us an opportunity to enter the trade.

The Characteristics of the BAT Pattern

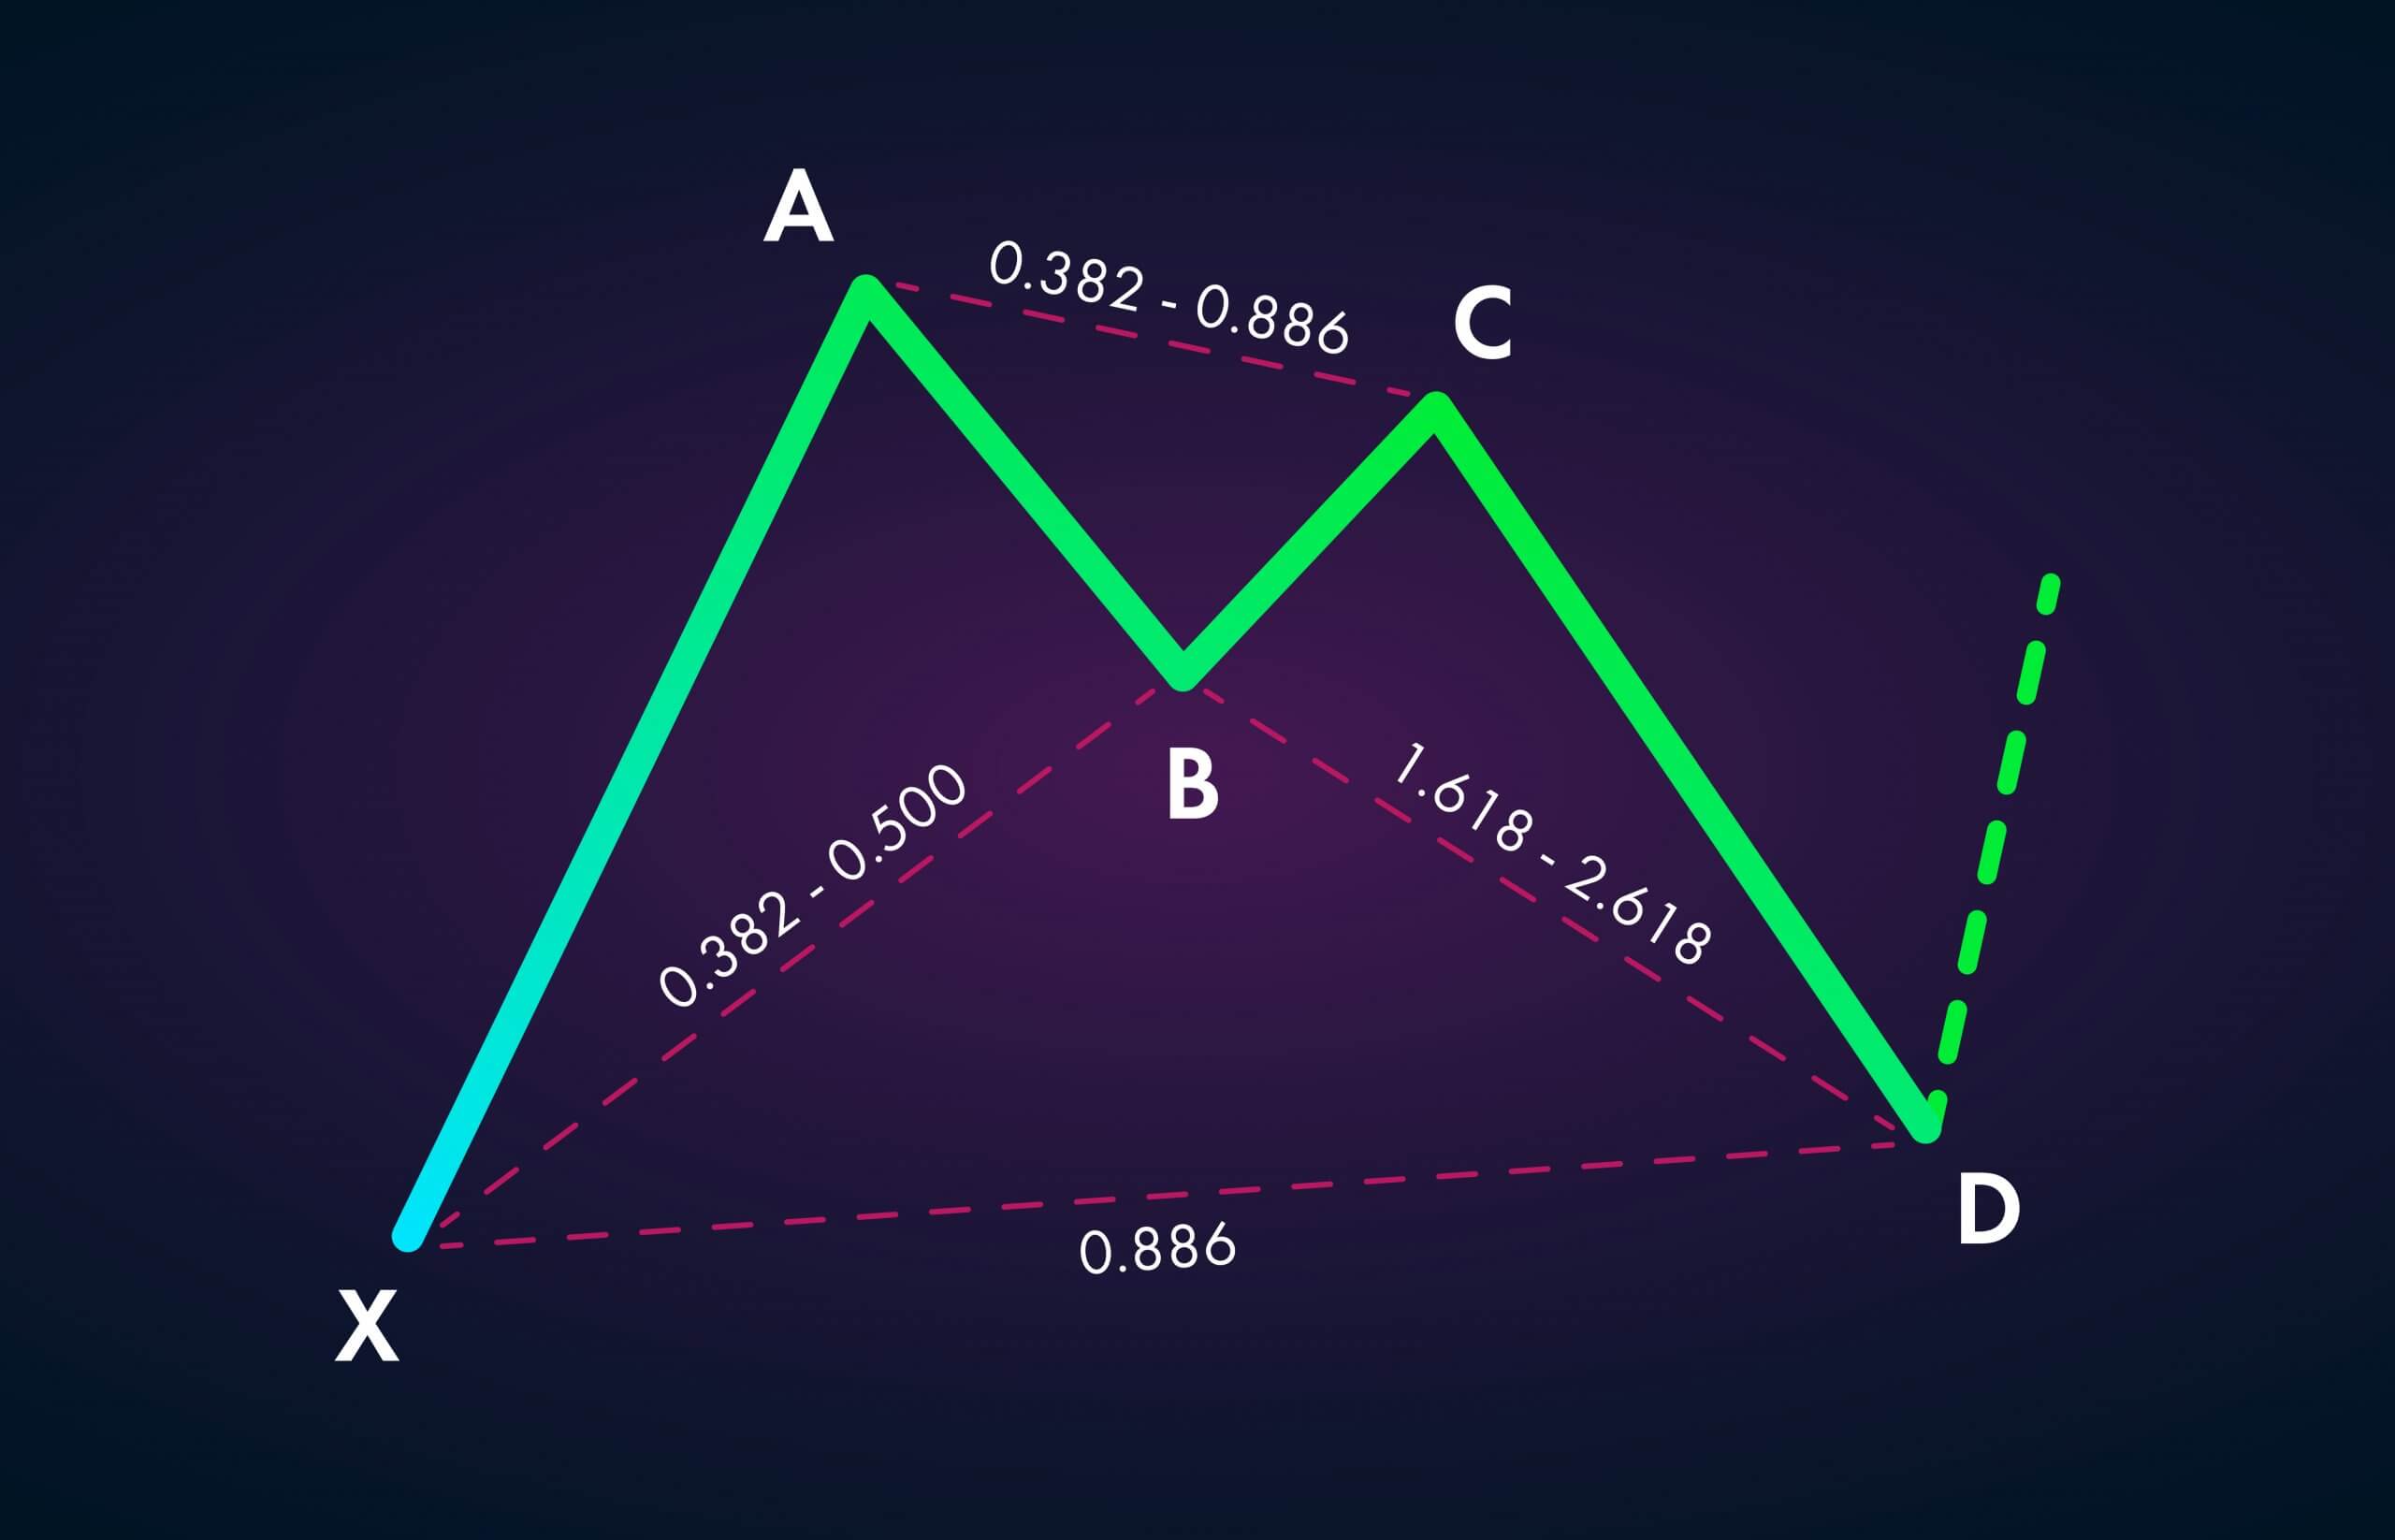
X-A – In its bullish version, the first leg forms when the price rises sharply from the point X to point A.

A-B – The AB leg retraces back between the 38.2% and 50% Fibonacci levels to the distance covered by XA leg.

B-C  – For BC leg, price changes its direction again and retrace anything between the 38.2% and 88.6% of the distance covered by the AB leg.

C-D – The CD leg is the final and most important part of the pattern. If this leg goes wrong, then the pattern can be considered invalid. We can go long when the CD leg has achieved 88.6% retracement of the XA leg.

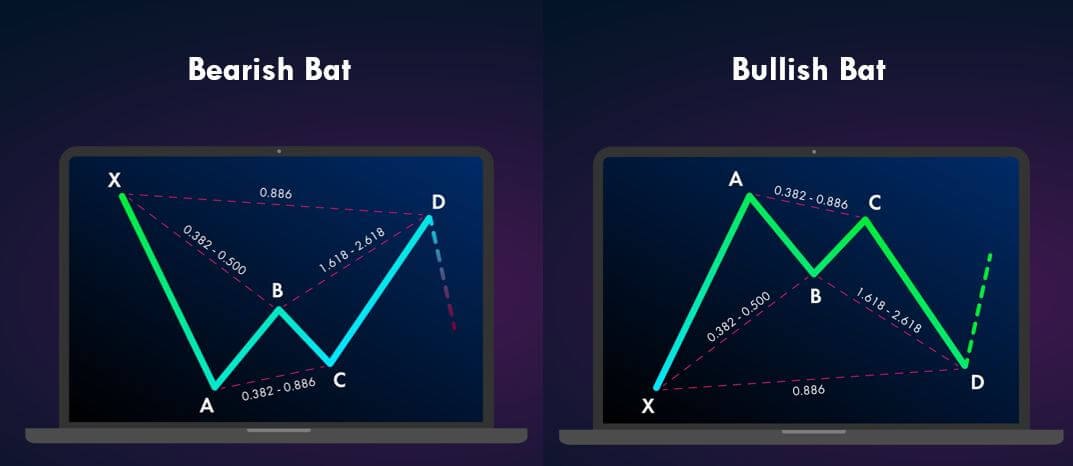
Below is how both Bearish and Bullish Harmonic Bat pattern would look like when Fib levels are applied to it.

Trading the Bullish Bat pattern

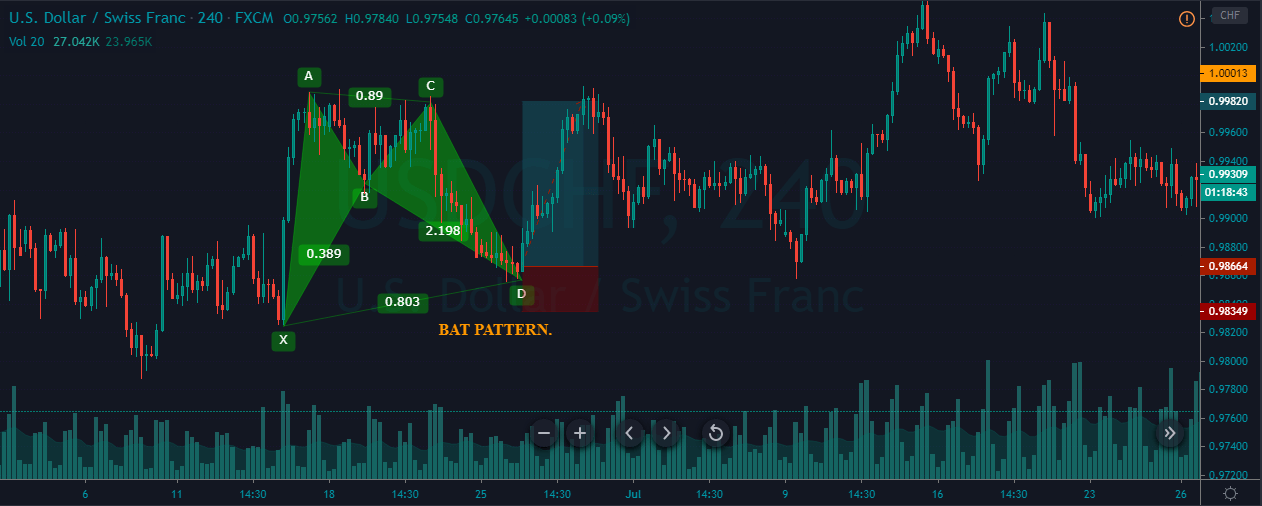
The below price chart represents the formation of a Bullish BAT pattern on the USD/CHF forex price chart.

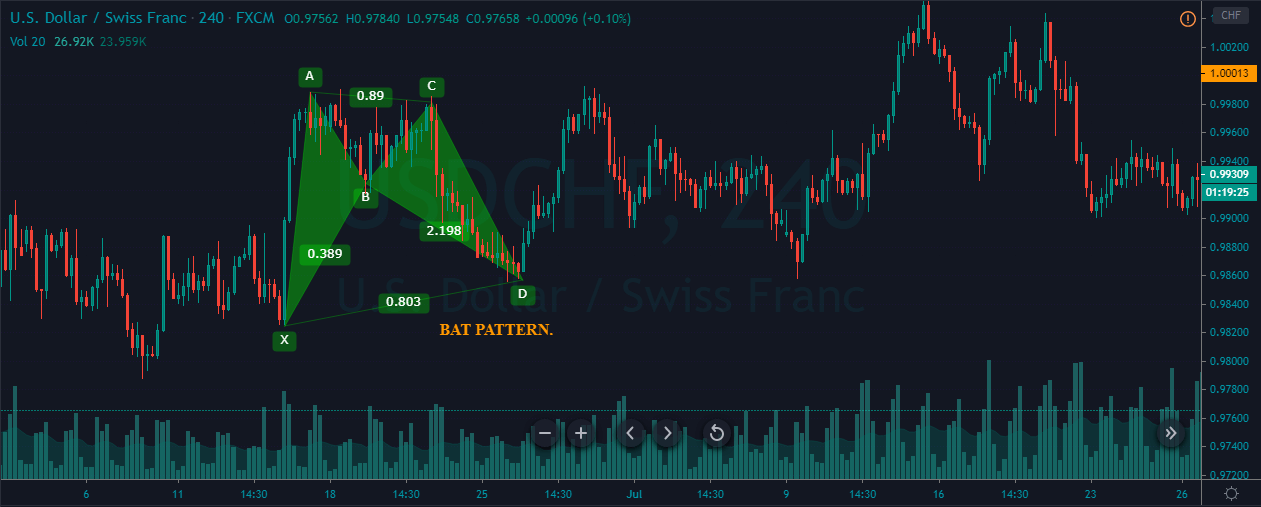
The below image represents our entry and exit while trading the Bullish Bat pattern. At first, we can see the price action printing the XA leg on the chart. Followed by that, the counter-trend AB move has retraced to 38.2% Fib level of the XA move. The BC leg followed the trend and retraced back to 88.6% of the AB leg. The last leg was the CD leg, which reached the 88.6% Fib level of the XA move. The trade activation was at point D, and the stop-loss is placed little below the D point. To place the take-profit order, we chose point A, and we can see how that placement is respected.

Trading the Bearish Bat pattern

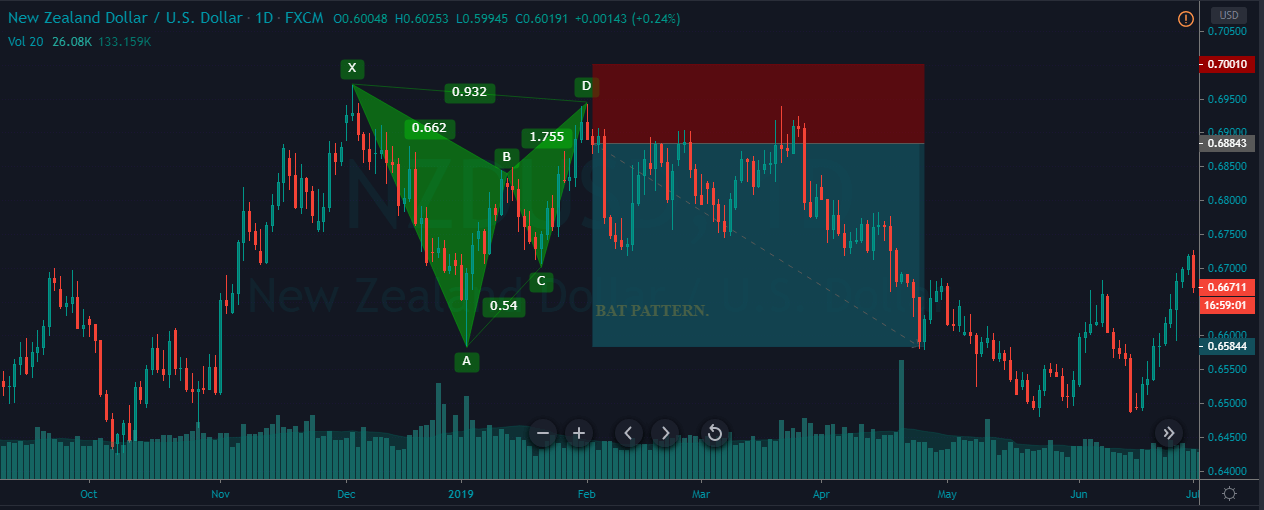
The image below represents the formation of a bearish bat pattern on the NZD/USD Forex price chart.

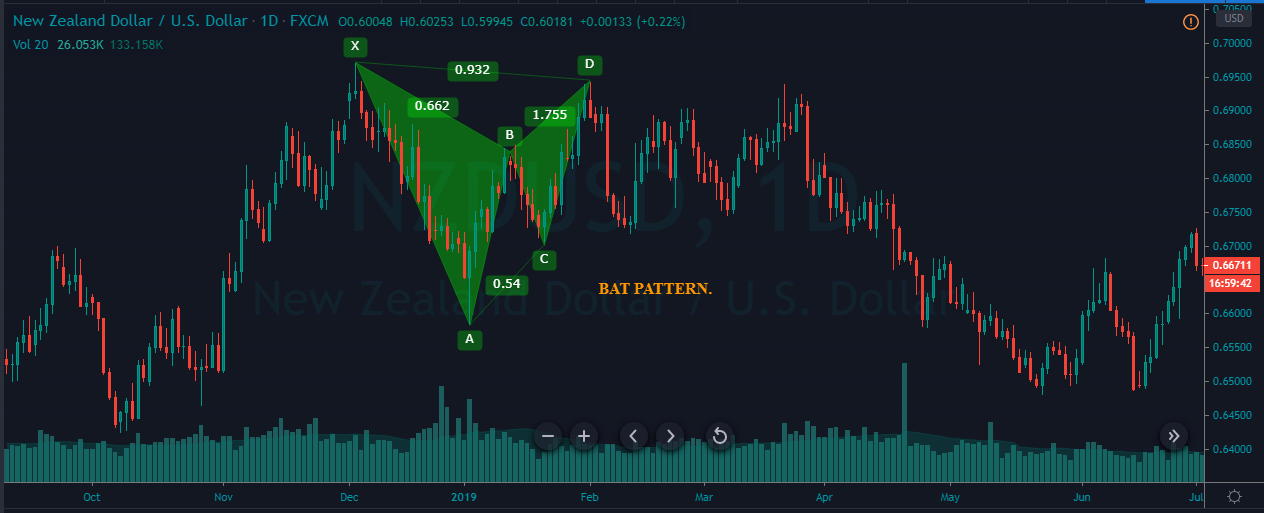
The formation of the pattern starts with the first leg at point X, and it ends at point A. The second leg AB was counter-trend, and it retraced back to 38.2% of the XA leg. The BC leg goes down, and even that retraced 38.2% of the AB leg. The last leg was the CD move, and if this leg doesn’t follow the rules, we shouldn’t consider the pattern valid. The CD leg goes up, and it retraces to 88.6% fib level. Hence, we can consider the pattern formed as valid. We have activated the trade at point D, and the stops were placed above point D. We have placed two take-profit orders – the first one was at point C, and the next one was at point A.

Conclusion

Bat is one of the most credible Harmonic patterns in the market. As the pattern ends at point D, our trade immediately resumes and often provides an excellent risk to reward ratio trades. Once you master trading the bullish pattern, the bearish one can easily be traded. The Bat is also considered one of the most reliable harmonic patterns; So whenever you identify this pattern, it is advisable to go big. Cheers!

[wp_quiz id=”77106″]
Categories
Forex Course

120. Introduction To Harmonic Patterns

Introduction

In the previous course articles, we have been discussing a lot of concepts related to Technical Analysis. In that journey, we have learned the trading of some of the most significant chart patterns like Head & Shoulders, Triangle, Wedge, etc. The extension to the learning of these concepts is to know the process of identifying and trading of Harmonic Patterns. We want to mention that learning this part is a bit tricky as the concepts are advanced and require a lot of practice to master them. Let’s get into details.

Brief History

The discovery of these Harmonic patterns dates back to the 1930s. H.M.Gartley, an American author and technical analyst, mentioned the trading of these unique patterns in his book ‘Profits In The Stock Market.’ Later these patterns were highly improvised by ‘Larry Pesavento’ by adding Fib ratios to identify and confirm these patterns. Finally, ‘Scott Carney’ discovered more Harmonic patterns and published them in his most famous book ‘Harmonic Trading.’

What Are Harmonic Patterns?

Harmonic Chart Patterns are nothing but the same kind of Forex chart patterns that we have learned in our previous lessons. But the shapes of these patterns look similar to the real-life birds and animals. For instance, one of the very well known harmonic chart patterns is the Butterfly pattern. That is, when this pattern is complete, we will be able to see a butterfly-like structure on the price charts formed by the price action.

All the Harmonic patterns are both bullish and bearish in nature. That is, these patterns can be identified and traded in both up trending & down trending markets. Also, some of the Harmonic patterns indicate that the current market trend is going to continue, and some of them indicate a market reversal. Hence we can consider Harmonics as both trend continuation and reversal patterns.

Why is it important to know them?

The harmonic patterns levels-up the pattern-based trading as it involves an additional technical tool to confirm and trade them. And that tool is none other than the well known Fibonacci levels. The harmonic patterns can only be confirmed by analyzing at what levels the price action turning its directions. Only if these levels are in line with the predefined Fibonacci levels, we can confirm and trade these patterns. The harmonic trading enables traders in predicting the future price movements of an asset more accurately than any other form of trading.

How many Harmonic Patterns are there?

In total, there are nine Harmonic patterns out of which six are used frequently by the traders to trade the Forex market. The ideology behind trading any of these patterns is the same; we must wait for a particular Harmonic pattern to form completely on the price chart and then take long or short positions accordingly. In the upcoming course lessons, we will be discussing the six Harmonic patterns that we have mentioned below.

The other three less used Harmonic patterns are Shark Pattern, Cypher Pattern, and the ABC Pattern. Stay tuned to learn the trading of these patterns in the easiest way possible. Cheers!