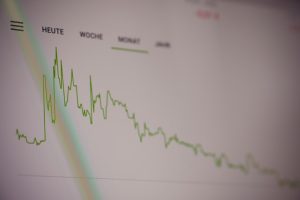
Forex trading is a complex discipline that requires one to master various skills and techniques to succeed in the market. One of the most important skills is the ability to read a chart. A forex chart is a visual representation of the price movements of a currency pair over a specific period. Reading a chart forex can seem intimidating at first, but it is a skill that can be learned with practice and patience. In this article, we will explore the basics of reading a forex chart.
Types of Forex Charts
There are three main types of forex charts: line, bar, and candlestick charts. Each chart type has its own advantages and disadvantages, and traders often use a combination of chart types to analyze the market.
Line Chart
A line chart is the simplest type of forex chart. It shows the closing prices of a currency pair over a specific period. The chart is created by connecting the closing prices with a line. Line charts are useful for identifying trends and support and resistance levels.
Bar Chart
A bar chart provides more information than a line chart. It shows the opening, closing, high, and low prices of a currency pair over a specific period. The opening price is represented by a horizontal line on the left side of the bar, and the closing price is represented by a horizontal line on the right side of the bar. The high and low prices are represented by the top and bottom of the vertical bar. Bar charts are useful for identifying the volatility of the market and the strength of the trend.
Candlestick Chart
A candlestick chart is similar to a bar chart, but it provides more information. It shows the opening, closing, high, and low prices of a currency pair over a specific period, like a bar chart. However, each candlestick represents a specific time period, such as one day, one hour, or one minute. The body of the candlestick is colored green or red, depending on whether the closing price was higher or lower than the opening price. The shadows above and below the body represent the high and low prices. Candlestick charts are useful for identifying reversal patterns and trading signals.
Reading a Forex Chart
Now that we have an understanding of the types of forex charts, let’s explore how to read a forex chart.
Price Axis
The price axis is the vertical axis on the chart. It shows the price of the currency pair. The price is usually on the right side of the chart, and it is displayed in pips. Pips are the smallest unit of measurement in the forex market.
Time Axis
The time axis is the horizontal axis on the chart. It shows the time period of the chart. The time period can range from minutes to months, depending on the chart type.
Trend Lines
Trend lines are lines that connect the lows or highs of a currency pair over a specific period. They are used to identify the direction of the trend. An uptrend is identified by connecting the lows of the currency pair, while a downtrend is identified by connecting the highs of the currency pair.
Support and Resistance Levels
Support and resistance levels are areas on the chart where the price tends to bounce off. Support levels are areas where the price tends to rise after falling, while resistance levels are areas where the price tends to fall after rising. These levels are important because they can be used to identify potential entry and exit points.
Indicators
Indicators are tools that traders use to analyze the market. They are displayed on the chart and are based on mathematical calculations. There are many indicators available, including moving averages, Bollinger Bands, and Relative Strength Index (RSI). Indicators can be used to identify trends, momentum, and potential trading signals.
Conclusion
Reading a forex chart is an essential skill for any trader. It requires an understanding of the types of charts, the price and time axis, trend lines, support and resistance levels, and indicators. With practice and patience, traders can learn to read a forex chart and make informed trading decisions. It is important to remember that no chart is perfect, and traders should use a combination of chart types and indicators to analyze the market.


