
Forex trading is a popular investment option that involves buying and selling currencies in the hopes of making a profit. To be successful in forex trading, one must possess a good understanding of the market and its trends. One way to gain insight into the market is through the use of charts, which provide a visual representation of the data. In this article, we will explore how to analyze charts in forex trading.
Understanding the Basics of Forex Charts:
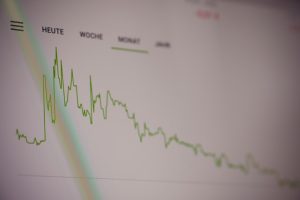
Forex charts are graphical representations of the price movements of various currency pairs. Traders use these charts to analyze trends and make informed decisions about buying or selling currencies. There are several different types of charts used in forex trading, including line charts, bar charts, and candlestick charts.
Line charts are the simplest type of forex chart and show only the closing prices for each time period represented. Bar charts show the high, low, open, and closing prices for each period. Candlestick charts are similar to bar charts but use colored candles to represent price movements. Green candles indicate a bullish trend, while red candles indicate a bearish trend.
Analyzing Forex Charts:
Once you understand the basics of forex charts, you can begin to analyze them to gain insight into the market. Here are some key factors to consider when analyzing forex charts:
1. Trend Analysis:
A trend is a long-term movement in the price of a currency. Traders analyze trends to determine whether to buy or sell a currency. To identify a trend, look for a series of higher highs and higher lows in an uptrend or lower highs and lower lows in a downtrend. You can use trend lines to visually connect the highs and lows and identify the trend.
2. Support and Resistance Levels:
Support and resistance levels are price points where the market has historically had difficulty breaking through. Traders use these levels to identify potential entry and exit points. Support levels are price points where the market has historically bounced back up from, while resistance levels are price points where the market has historically bounced back down from.
3. Technical Indicators:
Technical indicators are mathematical calculations that are applied to forex charts to help identify trends and potential trading opportunities. Some common technical indicators used in forex trading include moving averages, relative strength index (RSI), and stochastic oscillator.
Moving averages are calculated by averaging the closing prices of a currency pair over a specific period of time. They help traders identify the overall trend of a currency pair. RSI measures the strength of a currency pair’s price action by comparing the average gains to the average losses over a specific period of time. Stochastic oscillator measures the momentum of a currency pair by comparing the closing price to its price range over a specific period of time.
4. Chart Patterns:
Chart patterns are formations on a forex chart that indicate a potential trend reversal or continuation. Some common chart patterns include head and shoulders, double tops and bottoms, and triangles. Traders use these patterns to help identify potential entry and exit points.
Conclusion:
Analyzing forex charts is an essential part of forex trading. Traders use charts to identify trends, support and resistance levels, technical indicators, and chart patterns to make informed trading decisions. By understanding the basics of forex charts and the key factors to consider when analyzing them, traders can gain valuable insight into the market and increase their chances of making a profit.
Related posts
 Who is the best broker in forex?
 What is a forex scam?
 What is the most successful forex strategy?
 Trading forex alarm when candlestick changes color?
 How much is forex monthly fee?
 What secret can you share with me about forex?
 How to forex trade with bars?
 What is us 30 on forex?
 When does the forex market open after new year’s day?
 How long can u hold forex positions?
 What is xau in forex?
 10 reason why forex trading?